Research Article
Enhanced Duration of Truffle Sauce Preservation due to
Addition of Linoleic Acid
Bruno Tirillini,
1Filippo Maggi ,
2Roberto Venanzoni ,
3and Paola Angelini
31Department of Biomolecular Sciences, University of Urbino, Pesaro-Urbino, Italy
2School of Pharmacy, University of Camerino, Camerino, Italy
3Department of Chemistry, Biology and Biotechnology, University of Perugia, Perugia, Italy
Correspondence should be addressed to Paola Angelini; [email protected] Received 28 October 2018; Accepted 26 December 2018; Published 3 February 2019 Guest Editor: Rodrigo Ortega-Toro
Copyright © 2019 Bruno Tirillini et al. This is an open access article distributed under the Creative Commons Attribution License, which permits unrestricted use, distribution, and reproduction in any medium, provided the original work is properly cited. Food products based on truffles such as truffle sauces are commonly sterilized by autoclaving. With the aim of reducing sterilization durations and temperatures and therefore minimizing the formation of new molecules while maintaining sterile conditions, natural molecules with bacteriostatic action can be added. This work takes into account molecular variations in a truffle sauce with linoleic and stearic acids added at various temperatures and durations of sterilization. As controls, the sterilized truffle sauces, not additives, were taken. The SPME/GC has always detected changes in the composition of the headspace but more significant at longer durations. An increase in temperature leads to the transformation of an important fraction of total alcohol into total aldehydes. Bacteriological tests were performed on total aerobic bacteria and Clostridium spp. The total bacterial load, even if low, is instead present in the controls for all temperature/duration combinations. Linoleic acid is more effective than stearic acid and contributes with a con-centration of 10% (w/w) to a decisive reduction of the total bacterial load at 10′/121°C and 3′/130°C. The nutritional value of truffle
sauces can be increased by adding nutraceuticals, and amongst these, linoleic acid could be a valid candidate.
1. Introduction
Truffles (Tuber spp.) belong to the fruiting bodies of certain hypogeous ascomycetes, which may grow in ectomycor-rhizal symbioses with specified shrub and tree species [1, 2]. In particular, some species of truffle, Tuber magnatum Pico (white truffle), Tuber melanosporum Vittad (black truffle), and Tuber aestivum (Wulfen) Spreng., are the most ap-preciated for their organoleptic properties, and their de-mand is increasing in the food markets of many countries, particularly in Italy, France, Spain, and other European countries [3–5].
For this reason, the volatile components of Tuber aroma have been extensively studied. Using headspace solid-phase microextraction (HS-SPME), combined with gas chromatography-mass spectrometry (GC/MS), it was possible to identify 36 compounds in T. magnatum [6, 7], 70 compounds in T. melanosporum, and 40 compounds in
T. aestivum [8].
Truffles quickly lose their organoleptic characteristics. The large amount of bacteria present in the fruiting body leads to its rapid deterioration with loss of its edible properties [9–11].
Knowledge of the physicochemical and microbiological modifications during truffle storage is still limited [12, 13] despite Tuber volatiles being thoroughly investigated in relation to both truffle species identification [14–16] and to freshness evaluation [17].
To improve the shelf life of Tuber and preserve its sensory and structural characteristics, several methodologies have been applied.
One example of the methodologies used is the utilisation of 1.5 kGy irradiation, which safeguards some biochemical characteristics and causes a decrease in the truffle microbial flora [13]. However, standard protocols exist regarding the preparation of the fresh or preserved truffle market. Whilst truffles used for the production of a wide range of food products such as truffle sauces (homogenized with other
Volume 2019, Article ID 8421898, 10 pages https://doi.org/10.1155/2019/8421898
foods, i.e., porcini mushrooms) are immediately frozen or sterilized by autoclave at 120–130°C for 30 min. [18], fruiting
bodies used in fresh products have a minimal processing and require lower temperatures (usually 4°C) in order to preserve
quality and extend the shelf life of the fungus.
The conservation process of truffle sauces, however, leads to a variation of the organoleptic properties of the truffles. This is due to the autoclaving temperature, which is supposed to lead to the formation of reactions between the components of the truffle sauces with the production of new compounds, practically varying the chemical composition of the sauce. The complexity of the reactions of the matrix is not yet fully known, and one of the aims of this work was to identify the pattern of volatile compounds that are formed as a result of different autoclaving treatments. As a reference, the composition of the volatile compounds of an autoclaved truffle sauce at a lower temperature (110°C) and the shorter
duration (3 min.) necessary to sterilize the product was taken into consideration.
The nutritional value of truffle sauces can be increased by adding nutraceuticals, and amongst these, linoleic acid (18 : 2) could be a valid candidate. The linoleic acid could maintain normal blood cholesterol concentrations [19] and protect the skin from UV-induced damage [20] or give a contribution to the maintenance or achievement of a normal body weight [21].
The second aim of the present work was to determine how the VOC pattern of a truffle sauce added with linoleic acid varies and its microbiological modifications as a result of autoclaving conditions, in order to select the most suitable solution to be applied in future studies related to its pre-serving ability. Reference was made to stearic acid (18:0), a C-18 acid which reacted slightly to the various experimental autoclaving tested [22].
The final aim of this work was to vary experimental autoclaving conditions so as to achieve minimum bacteria levels in truffle sauces after 12 months of storage.
2. Materials and Methods
2.1. Sample. The truffle sauce was taken directly from the
company that produces it before industrial autoclaving and put into 100 g jars (standard sample). The truffle sauce contained other than Tuber melanosporum even Boletus edulis (1 : 1). 10 g of stearic acid or linoleic acid was added to the 100 g jars. 3 jars of each type were treated as shown in Table 1.
2.2. SPME-GC-MS. Volatile compounds were extracted by
the solid-phase microextraction technique (SPME). 100 mg of sample was placed in a 4 mL vial tightly sealed at 50°C. A
100 μm thick, and 1 cm long divinylbenzene/carboxen/ polydimethylsiloxane (DVB/CAR/PDMS, Supelco, Belle-fonte, PA, USA) fiber was used for sampling. The fiber remained in the vials for 20 min. The fiber was desorbed on the gas chromatography (GC) on liners for SPME (0.75 mm i.d., Supelco) at 250°C for 3 min.
Gas chromatography-mass spectrometry (GC-MS) an-alyses were performed on Agilent 6890 N coupled to a
5973 N mass spectrometer. The compounds were separated by a polar DB-WAX column (30 m, 0.25 μm i.d., 0.25 μm, J&W, Scientific, Folsom, CA, USA) with the following temperature program: 6 min at 45°C, then 6°C/min up to
140°C, and finally 25°C/min to 250°C.
The volatile organic compounds (VOCs) were identified by comparing the retention index and mass spectrum of the chromatographic peaks with those of standards analyzed under the same conditions (when available in the market). Retention indices were calculated using a mixture of normal alkane (C8-C30) (Supelco) diluted in hexane within a 4 mL vial sampled via the same CAR-DVB-PDMS fiber used for analysis of samples and using the same temperature program as mentioned above.
The peak assignments of the other volatile components were based on computer matching of the mass spectra obtained with the WILEY275, NIST 08, and ADAMS li-braries, taking into account the coherence of the retention indices of the analyzed compounds with those reported by Adams and NIST 08 libraries [23, 24].
2.2.1. Statistical Analyses. All the analyses were run in
triplicate and averaged.
(1) Cluster Analyses. To see if there was any evidence of
in-teresting natural groupings, we applied cluster analyses to the database. A hierarchical agglomerative clustering procedure, based on furthest neighbour, was carried out. All variables were measured on an interval scale using the Euclidean distance.
(2) One-Way Analysis of Variance. The hypothesis tested was
that the set of mean variables were the same across groups. Levene’s test was used for testing the homogeneity of var-iances. To determine which specific-group mean was dif-ferent, a post hoc multiple comparison technique was carried out. We used Tukey’s honestly significant difference (HSD). Values of p < 0.05 were considered as statistically significant. All statistical evaluations were performed by using the SPSS 16.0 software package for Windows.
(3) Principal Component Analyses. The database for the
principal component analyses is the matrix experimental mode x VOC. The intent behind the method was an attempt to reduce the complexity of the data by decreasing the number of variables that need to be considered.
2.3. Microbiological Analyses
2.3.1. Counts of Total Aerobic Bacteria. Counts of total
aerobic bacteria (TAB) were done in tryptone glucose yeast extract agar (TGYE, Merck, Milan, Italy) medium. Decimal dilutions of the sample were plated in triplicate and in-cubated at 30°C for 48 h. [25].
2.3.2. Counting of Sulphite-Reducing Clostridia and Clos-tridium perfringens. Selective enumeration was carried
out in pour plates of tryptose sulfite cycloserine agar (TSCA, Merck, Milan, Italy) to which 25 g NaCl was added
per litre. After incubation at 37°C for 18–24 h under
an-aerobic conditions, black colonies were counted and sub-sequently confirmed as C. perfringens according to ISO7937 [26], using fermentation of lactose (+), gelatin liquefaction (+), motility (−), and nitrate reduction (−) as criteria after anaerobic incubation for 24 h at 37°C.
3. Results and Discussion
Seventy-seven volatile components were identified in truffle sauce, corresponding to 86.75–99.89% of the total headspace compounds (VOCs) (Table 2). 2-Methyl-butanal is the most abundant compound and reaches the maximum concen-tration of 37.07% in P4.C. Other compounds are present in significant quantities such as 2-pentylfuran 14.92% in P2.2, benzyl alcohol 12.93% in P1.1, butanol 11.03% in P1.C, 2-butanone 9.96 in P3.1, 1-octe3-ol 9.46 in P1.C, and n-hexanal 9.16 in P2.2.
VOCs were rich in alcohols (17.46–39.9%), and in this fraction, 2-butanol (11.03 % in P1.C), 1-octen-3-ol (from 10% to 5.74%), and n-hexanol (10.18% in P1.2) formed the major contribution.
The variations of the VOCs classes for the various ex-perimental conditions are reported in Figure 1. As can be seen, varying the autoclaving duration results in more or less marked variations in the reciprocal relationships of the classes of chemical compounds.
The class of furan derivatives is represented by 2-pen-tylfuran, 3-furaldehyde, 2-furanmethanol, and 2(5H)-furanone. Among these, the 2-pentylfuran shows the wid-est variation in concentration depending on the operating conditions. The highest concentration is with conditions P2.2 (14.92%), and higher than average concentrations are also found with conditions P4.2 (5.59%) and P1.2 (4.59%) and even slightly less with conditions P3.2 (2.83%). We can hypothesize that the addition of linoleic acid promotes the formation of this compound at all temperatures and du-rations experienced while remaining much lower and constant in all other conditions.
In all the temperature and duration conditions experi-enced, the addition of stearic acid (SA) causes an increase in the quantity of acids.
The addition of the two acids tends to decrease the al-cohol content compared to the control but under conditions P4, the addition of linoleic acid (LA) causes a significant increase compared to the control.
Aldehydes increase with the addition of the two acids only under P2 conditions, under the other conditions they decrease by about the same amount. Under lowest condi-tions P1, the two acids act in the opposite way, and only the LA produces a significant increase compared to the control. A drastic decrease of aromatics occurs under P2 con-ditions with the addition of LA and a little less accentuated with the addition of SA. In all cases, the addition of LA leads to a more or less great decrease compared to the control.
Under P2 conditions, the addition of SA or LA produces a significant increase in ketones, while the addition of both causes a sharp decrease of ketones at lower tempera-tures (P1).
The esters and sesquiterpenes do not seem to be affected by the addition of SA or LA.
The furan derivatives are strongly influenced by the addition of LA under all the tested conditions, but under conditions P2, they produce the maximum increase of these compounds.
At the lower temperature, the addition of acids produces significant decreases in monoterpenes.
LA always produces a lowering of the quantity of oxy-genated monoterpenes. The SA in P4 produces a significant increase in oxygenated monoterpenes in contrast to the effect of linoleic acid.
The paraffins are drastically influenced by the addition of the two acids starting from the P2 conditions with increases due to the LA at least double compared to the SA.
At two lower temperatures, the addition of LA produces a net decrease of sulfur compounds while under P4 con-ditions, the addition of the two acids produces an increase in sulfur compounds.
Under P1 conditions, the addition of LA produces a de-crease in ketones, alcohols, and aromatics and an inde-crease in aldehydes and furan derivatives. The addition of SA decreases ketones and increases the aromatics and especially the acids. Under the experimental conditions P2, there is a strong increase in furan derivatives and, albeit less so, in ketones, Table 1: Autoclaving conditions of truffle sauce with or without the addition of fatty acids.
Sample Autoclaving conditions Component
ID Duration Temperature (°C) Pressure (atm)
P1.C A 10′ 110 0.41 Standard sample P1.1 10′ 110 0.41 +stearic acid P1.2 10′ 110 0.41 +linoleic acid P2.C B 10′ 121 1.02 Standard sample P2.1 10′ 121 1.02 +stearic acid P2.2 10′ 121 1.02 +linoleic acid P3.C C 3′ 130 1.66 Standard sample P3.1 3′ 130 1.66 +stearic acid P3.2 3′ 130 1.66 +linoleic acid P4.C D 5′ 130 1.66 Standard sample P4.1 5′ 130 1.66 +stearic acid P4.2 5′ 130 1.66 +linoleic acid
Table 2: Identification and quantification of VOCs. No. Component P1.C (%) P1.1 (%) P1.2 (%) P2.C (%) P2.1 (%) P2.2 (%) P3.C (%) P3.1 (%) P3.2 (%) P4.C (%) P4.1 (%) P4.2 (%) 1 Dimethyl sulfide∗ 0.25h 0.23h 0.2gh 0.22h 0.19fg 0.17f 0.18fg 0.16e 0.13d 0.12c 0.1b 0.07a 2 n-Octane∗ 2.54g 1.33cd 1.96f 0.3a 1.24cd 2.16fg 0.76b 1.6de 2.61g 0.89b 1.34cd 2.61g 3 Acetone∗ 5.8c — — 1a — — 1.32ab — — 1.47b — — 4 2-Butanone∗ 1.16a 0.47a 1.18a 1.9a 8.95cd 6.47b 7.02bc 9.96d 8.1cd 8.2cd 6.71b 6.51b 5 2-Methyl-butanal∗ 4.43a 1.44a 5.71a 7a 23.17cd 12.39b 24.69cd 21.21cd 19.58c 37.07e 26.97d 23.5chd 6 3-Methyl-butanal∗ — — — 2.8b — — — — — 0.39a — — 7 Ethanol∗ 3.05c 3.47cd 1.68b 0.2a 4.61ef 0.91ab 5.09f 4.02de 4.25ef — — 5.09f 8 n-Pentanal∗ 0.78bc 0.98cd 1.12cd 1.2d 0.8bc 0.65ab 1.69e 0.3a 1.12cd 2.39f 1.3de 0.99bbc 9 α-Pinene∗ 0.92ef 0.82ef 0.48ab 0.7de 0.71de 0.38a 0.49bc 0.74ef 0.64cd 0.95f 0.67cd 0.41a 10 2-Butanol∗ 11.03c 7.41b 6.34b 1.8a 1.43a 1.06a 1.03a 1.17a 1.11a 1.82a 1.5a 1.2a 11 Camphene∗ 3.83d — — 1.2c — 0.48ab — — 0.37ab 0.52b 0.26ab 0.55b 12 n-Hexanal∗ 0.95ab — 1ab 1.3ab 0.59ab 9.16c 0.29a 0.24a 0.59ab 0.34ab 0.49ab 1.01ab 13 Dimethyl disulfide∗ 0.05c 0.05c 0.03b 0.05c 0.05c 0.03b 0.03b 0.02ab 0.01a 0.03b 0.03b 0.01a 14 β-Pinene∗ 0.23d — — — 0.11bc — — 0.08ab — 0.07a 0.14c — 15 Ethylbenzene∗ — — — 1.2a — — — — — — — — 16 m-Xylene∗ — — — 1.8a — — — — — — — — 17 o-Xylene∗ 0.21a — — 7b — — — — — — — — 18 1-Butanol∗ 0.32cd — 0.44d 0.8e — 0.36cd 0.24ab — — 0.23a — 0.23a 19 α-Phellandrene∗ 0.11a — — — — — — — — — — — 20 β-Myrcene∗ 0.44f 0.32dee 0.35de 0.7g 0.2b — 0.27bc — — 0.26ab 0.37ef — 21 Limonene∗ 0.88a 0.85a 1.21b 1.8c 0.74a 0.87a 0.67a 0.73a 0.74a 0.68a 0.82a 0.85a 22 1,8-Cineole∗ 4.35e 4.45e 2.84bc 4.7e 3.72cd 2.46ab 3.6bc 3.78cd 2.93bc 3.02cd 4.21de 2.35a 23 Isopentyl alcohol∗ 2.38f 2.36f 1.28e 0.5cd 0.27bc 0.17bc — — — 0.4bc 0.69d 0.26bc 24 2-Pentyl-furan∗ 0.53a 0.51a 4.59bc 0.5a 0.49a 14.92d 0.43a 0.53a 2.83b 0.53a 0.65a 5.59c 25 c-Terpinene∗ 0.68a 0.83a 0.59a 0.7a 0.6a 1.68b 0.73a 0.82a 0.72a 0.64a 0.73a 0.67a 26 (E)-β-Ocimene 1.25bc 2.31d 2.86de 1bc 0.64a 2.97f 0.7ab 0.65a 0.87bc 0.56a 0.71ab 1.39c 27 3-Octanone∗ 0.9cd 1.08de 1.57f 1cd 0.82cd 1.37ef 0.73ab 0.97cd 0.94cd 0.63a 0.91cd 1.14de 28 1-Pentanol∗ 0.54bc 0.72d 0.72d 0.7cd 0.38ab 0.32a 0.43ab 0.43ab 0.4ab 0.3a 0.41ab 0.45ab 29 p-Cymene∗ 0.16a — 0.4b 0.5bc 0.51bc 0.55c 0.43bc 0.53bc 0.48bc 0.41bc 0.46bc 0.53bc 30 Hexyl acetate∗ — 0.08ab 0.17c — 0.06a 0.21d — — — — 0.09bc 0.1bc 31 Terpinolene∗ — 0.25a — — — — — — — — — — 32 n-Octanal∗ 0.45c 0.55cd 0.51cd 0.6d 0.44cd 0.44cd 0.44cd 0.4cd 0.39cd 0.35a 0.41cd 0.45cd 33 (3Z)-hexen-1-ol acetate 1.6cd 1.81d 1.15ab 1.4cd 1.39cd 0.92a 1.34bc 1.44cd 1.1ab 1.06ab 1.34bc 0.91a 34 2-Heptenal∗ 1.17d 1.14d 0.95d 0.5bc 0.5bc 0.52bc 0.67bc 0.4a 0.32a 0.47ab 0.69bc 0.71c 35 6-Methyl-5-hepten-2-one 0.07ba — 0.28cd 0.4e 0.16c — — 0.17c — 0.15bc — 0.35e 36 n-Hexanol∗ 3.23b 3.58b 10.18c 1.2a 0.9a 0.57a 1.01a 0.43a 0.65a 0.65a 1.03a 0.49a 37 3-Hexen-1-ol∗ 1.88g 2.14g 1.02de 1.5f 0.23a 0.71b 1.35ef 1.1de 0.93cd 1.2ef 1.33ef 0.7bc 38 n-Nonanal∗ 0.86a 0.76a 1.5cd 1.8d 1.3c 1.4cd 1.55cd 1.82d 1.66cd 1.27bc 1.4cd 1.44cd 39 3-Octanol∗ 1.15ab 1.88c 1.32b 1.1ab 1.09ab 1.14ab 1ab 1.15ab 1.03ab 0.84a 1ab 0.99ab 40 (Z)-2-Hexen-1-ol 0.5a 0.71bc 1.23e 0.9cd 0.64ab 1.11e 0.57ab 0.64ab 0.75bc 0.45a 0.5a 1.07de 41 Acetic acid∗ 1.77de 1.97e 1.34cd 1.8de 1.58de 1.17bc 1.23bc 1.4cd 1.2bc 1.07ab 1.3bc 0.93a 42 1-Octen-3-ol∗ 9.46de 7.92cd 5.74a 10e 8.45de 6.22bc 8.22de 6.78bc 6.39ab 7.35bc 7.98de 6.24ab 43 3-Furaldehyde 2.17bc 2.13ab 1.46a 4.1f 3.14ef 3.59ef 3.88ef 3.4ef 3.18ef 2.54cd 2.88de 2.93de 44 α-Copaene 1.05de 1.23e 0.9cd 1.9g 1.22de 0.68a 1.27ef 0.87bc 0.69a 1.19de 1.56f 0.76ab 45 Camphor∗ 3.14a 3.17a 3.04a 5.9d 5.28cd 4.63cd 5.22cd 5.57cd 4.74cd 4.21bc 4.79cd 3.89ab 46 1-Octanol∗ 1.06e — 0.94de 0.8cd — — 0.48b 0.62bc 0.45b 0.52b — 0.64bc 47 (E,E)-3,5-Octadien-2-one — 1.39d — 0.3b 0.53c 0.65c 0.21b 0.03a 0.22b — 0.69c — 48 Bornyl acetate∗ — 0.48c — — 0.29b 0.54c — 0.19a 0.45c — 0.32b 0.53c 49 2,3-Butanediol∗ 0.48e 0.13a 0.24cd 0.3e 0.26e 0.21cd 0.3e 0.22cd 0.16bc 0.17bc 0.19bc 0.13a 50 (E)-Caryophyllene∗ 0.76e 0.94f 0.5cd 0.6de 0.57cd 0.37ab 0.59d 0.56cd 0.41bc 0.48cd 0.53cd 0.34a 51 2-Undecanone∗ — — — — — — — — — — — 0.15a 52 Terpinen-4-ol∗ 0.34e 0.37e — 0.3de 0.25cd — 0.2bc 0.19bc — 0.16b 0.18bc — 53 2-Octen-1-ol∗ 0.42ef 0.48f — 0.5f 0.3cd 0.34de 0.26cd 0.24cd 0.23bc 0.18b 0.28cd — 54 Benzeneacetaldehyde∗ — — — — — — — — — — — 0.24a 55 2-Furanmethanol 4.51ab 5.34bc 3.66a 7.2d 5.12bc 5.37bc 6.43cd 5.12bc 5.13bc 3.67a 4.15ab 3.88ab 56 1-Nonanol∗ 0.53d 0.72e 0.47d 0.3c 0.08a 0.2b 0.1b8 0.16ab 0.13ab 0.13ab 0.19b 0.18b 57 δ-Terpineol∗ 0.13b 0.28d — — 0.17c — — — — 0.04a — — 58 α-Terpineol∗ 1.14 1.1de 0.73bc 1.1de 0.8de 0.56a 0.89de 0.73bc 0.62ab 0.72bc 0.85cd 0.65bc 59 Borneol 0.22d 0.2cd 0.2cd 0.2cd 0.19cd 0.22d — 0.16bc 0.15bc — 0.12b 0.17bc
Table 2: Continued. No. Component P1.C(%) P1.1(%) P1.2(%) P2.C(%) P2.1(%) P2.2(%) P3.C(%) P3.1(%) P3.2(%) P4.C(%) P4.1(%) P4.2(%) 60 Verbenone 0.1cd 0.13de 0.21f 0.1cd 0.08bc 0.15e 0.08bc 0.08bc 0.11cd 0.06a 0.07ab 0.1cd 61 α-Farnesene — 0.13a 0.17b — — 0.19b — 0.13a 0.12a — 0.1a — 62 2(5H)-Furanone∗ — 0.22c — — 0.11ab 0.07a 0.12ab 0.17bc 0.9 0.06a 0.11ab — 63 δ-Cadinene — — 0.13b — — 0.13b — — — — — 0.08a 64 1-(2-Butoxyethoxy)-ethanol — 0.29c — — 0.19b — — 0.13a — — 0.17ab — 65 2,4-Decadienal — 0.63c 0.65c — 0.21a 0.47b 0.26a 0.26a 0.46b 0.16a 0.21a 0.48b 66 Hexanoic acid∗ 0.12bc 0.13cbc 0.09 0.1bc 0.12bc 0.36d 0.08ab 0.08ab 0.07a 0.06a 0.08ab 0.06a 67 Geranyl acetone 0.37bc 0.44c 1.34f 0.2ab 0.18a 1e 0.11a 0.13a 0.38c 0.08a 0.09a 0.64d 68 Benzyl alcohol∗ 10.16de 12.93e 7.73cd 9cd 7.73cd 3.83a 8.41cd 9.17cd 7.9cd 6.85bc 7.5cd 5.93ab 69 Dimethyl sulfone∗ 0.6e 0.76f 0.36cd 0.4d 0.25bc 0.19 — 0.3cd 0.23b — 0.27bc 0.21b 70 Phenylethyl alcohol∗ 0.17c 0.19c 0.14bc 0.1ab 0.1ab 0.37d 0.08a 0.07a 0.09ab 0.06a 0.1ab 0.08a 71 Heptanoic acid∗ — — 1.2c — — 0.82b — — 0.47a — — 0.79b 72 p-Creosol 0.62d 0.7e — 0.7e 0.39bc — 0.3b 0.3b 0.25a 0.26a 0.34bc — 73 Octanoic acid∗ — — 0.11a — — 0.15b — — — — — 0.11a 74 Nonanoic acid∗ 0.74bc 0.52ab — 1d 0.66bc — 0.71bc 0.55ab — 0.8cd 0.45a — 75 Thymol∗ 0.26d — 0.16c — — 0.33e 0.19c 0.11ab 0.11ab 0.15bc — 0.1a 76 Dodecanoic acid∗ — 3.04c — — 1.46a — — 2.1b — — 2.27b — 77 Coumarin∗ 0.25a 0.5d 0.17a 0.3bc — 0.25a 0.25a 0.36c 0.2a 0.18a — 0.34bc
∗Compounds identified by standards and MS spectra. Compounds without the asterisk were identified by means of mass spectra and retention indices.
−Values not detected. Values are means of three determinations. Values within a row for each compound having different letters are significantly different
from each other using Tukey’s and LSD test (p> 0.05).
0 1 2 3 4 5 6 7 P1.C P1.1 P1.2 P2.C P2.1 P2.2 P3.C P3.1 P3.2 P4.C P4.1 P4.2 (a) 0 10 20 30 40 50 P1.C P1.1 P1.2 P2.C P2.1 P2.2 P3.C P3.1 P3.2 P4.C P4.1 P4.2 (b) 0 10 20 30 40 50 P1.C P1.1 P1.2 P2.C P2.1 P2.2 P3.C P3.1 P3.2 P4.C P4.1 P4.2 (c) 0 5 10 15 20 25 P1.C P1.1 P1.2 P2.C P2.1 P2.2 P3.C P3.1 P3.2 P4.C P4.1 P4.2 (d) 0 0.51 1.52 2.53 P1.C P1.1 P1.2 P2.C P2.1 P2.2 P3.C P3.1 P3.2 P4.C P4.1 P4.2 (e) 0 5 10 15 20 25 30 P1.C P1.1 P1.2 P2.C P2.1 P2.2 P3.C P3.1 P3.2 P4.C P4.1 P4.2 (f) 0 2 4 6 8 10 12 14 P1.C P1.1 P1.2 P2.C P2.1 P2.2 P3.C P3.1 P3.2 P4.C P4.1 P4.2 (g) 0 2 4 6 8 10 P1.C P1.1 P1.2 P2.C P2.1 P2.2 P3.C P3.1 P3.2 P4.C P4.1 P4.2 (h) 0 2 4 6 8 10 12 14 16 P1.C P1.1 P1.2 P2.C P2.1 P2.2 P3.C P3.1 P3.2 P4.C P4.1 P4.2 (i) 0 0.51 1.52 2.53 3.5 P1.C P1.1 P1.2 P2.C P2.1 P2.2 P3.C P3.1 P3.2 P4.C P4.1 P4.2 (j) 0 0.51 1.52 2.53 P1.C P1.1 P1.2 P2.C P2.1 P2.2 P3.C P3.1 P3.2 P4.C P4.1 P4.2 (k) 0 0.2 0.4 0.6 0.81 1.2 P1.C P1.1 P1.2 P2.C P2.1 P2.2 P3.C P3.1 P3.2 P4.C P4.1 P4.2 (l)
Figure1: Classes of compounds according to Table 2. (a) Acids. (b) Alcohols. (c) Aldehydes. (d) Aromatics. (e) Esters. (f) Furan derivatives. (g) Ketones. (h) Monoterpenes. (i) Oxygenated monoterpenes. (j) Paraffins. (k) Sesquiterpenes. (l) Sulfur compounds.
paraffins, and aldehydes induced by LA. Both acids cause a drastic reduction in the aromatics and, although less so, also in oxygenated monoterpenes and alcohols.
At higher temperatures P3 and P4, there is a drastic reduction of aldehydes following the addition of LA. SA has a similar but slightly less-accentuated action. Furano de-rivatives instead increase on the addition of LA and decrease on the addition of SA.
From the alimentary point of view, research in data-bases carried out on the molecules found has shown that none of these has toxic effects at least up to 10 mg/kg of body weight [27].
3.1. Cluster Analyses. The cluster analyses of the VOC
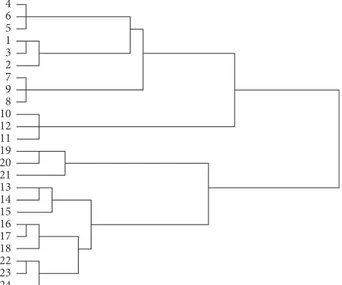
composition of the sauces without additions showed the formation of 4 distinct groups (P1.C-P2.C-P3.C-P4.C) (Fig-ure 2) corresponding to the four experimental conditions A, B, C, and D (Table 1). The P1.C and P2.C groups, which are formed at a distance cluster of 40 from the other groups, are distinct from the P3.C and P4.C groups which are a little more homogeneous among them forming a cluster distance of 20. The compositions of the VOCs within each group are very homogeneous, with an average cluster distance of 3 (Figure 2). The addition of stearic acid to the sauce has created the formation of new groups compared to the already formed groups P1.C-P2.C-P3.C-P4.C (Figure 3(a)). The effect of temperature and duration caused the VOC composition to vary in some cases. The groups P1.1-P1.C and P2.C separate from each other at a cluster distance 42. An increase in temperature (scheme B) led to the partial fusion of groups P2.1 with P3.C and P2.C with P3.1 (Figure 3(a)). The addition of linoleic acid to the sauce has created the formation of 8 homogeneous groups distinctly from each other (Figure 3(b)). The effect of the autoclaving temperature and duration always produced a variation of the VOCs compared to the controls. The groups begin to separate at a cluster distance of 40, and the homogeneity between the components is quite high (cluster distance between more homogeneous groups (P1.2-P1.C-P2.C): 4; more heterogeneous groups (P4.C): 8) (Figure 3(b)). According to the cluster analysis, two main group were formed, i.e., (P1.C-P1.1-P1.2-P2.C) and (P2.1-P2.2-P3.C-P3.1-P3.2-P4.C-P4.1-P4.2) at a distance cluster (ds) 42 (Figure 4).
We may suppose that starting from 121°C for 15 min,
substantial modifications occur in the chemical composition of the matrix. At lower ds (about 3), P1.C and P2.C separate from each other indicating that even under the milder duration/temperature autoclaving conditions, there was some modification in the chemical compositions.
3.2. Principal Component Analyses. Here, we opt to analyze
the correlation matrix since the variances of rates for dif-ferent types of VOC differ considerably. Working with the correlation matrix amounts to using the VOC rates after standardizing each to have unit standard deviation. This seems sensible since without standardization, the derived components are likely to be dominated by single variables with large variances. We choose the number of principal
components according to the number of eigenvalues above one which, in the case of the correlation matrix, amounts to identifying components with more variance than the average.
3.2.1. PCA for the Experimental P1.C-P2.C-P3.C-P4.C.
The first principal component has a variance of 35.88; this amounts to 54.36% of the total variance. The second prin-cipal component has a variance of 22.70 and accounts for a 34.40% of the variance. The first two (three) principal components account for 88.76% (100%) of the total variance. The screen plot (not reported) shows a marked decrease in downward slope after the second or third principal com-ponent, implying that we can summarize our VOC variables by the first two principal components. The first principal component has a high positive correlation with dimethyl sulfide/dimethyl disulfide/(E)-β-ocimene/acetic acid/α-ter-pineol/borneol/hexanoic acid/dimethyl sulfone. The second principal is much positively correlated with n-nonanal/
α-copaene/camphor. The principal component plot is given
in Figure 5(a).
3.2.2. PCA for the Experimental P1.C-P1.1-P2.C-P2.1-P3.C-P3.1-P4.C-P4.1. The first principal component has a variance
of 28.85; this amounts to 40.08% of the total variance. The second principal component has a variance of 17.50 and accounts for a 24.31% of the variance. The first two (three) principal components account for 64.39% (80.41%) of the total variance. The screen plot (not reported) shows a marked decrease in downward slope after the second or third principal component, implying that we can summarize our VOC variables by the first two principal components. The first principal component has a high positive correlation with
(E)-β-ocimene/n-hexanol/acetic
acid/(E)-caryophyllene/terpinen-4-ol/1-nonanol/verbenone/geranyl acetone/dimethyl sulfone/ phenylethyl alcohol. The second principal component is more positively correlated with n-hexanal/1-butanol. The principal component plot is given in Figure 5(b).
3.2.3. PCA for the Experimental P1.C-P1.2-P2.C-P2.2-P3.C-P3.2-P4.C-P4.2. The first principal component has a
vari-ance of 27.52; this amounts to 37.20% of the total varivari-ance. The second principal component has a variance of 16.09 and
1 3 2 4 6 5 7 8 9 10 11 12
Figure2: Cluster analysis (complete linkage clustering). Data from truffle sauces (control)∗.∗Ordinal numbers referred to data from
experiments as indicated in Table 1: 1–3 to P1.C/4–6 to P2.C/7–9 to P3.C/10–12 to P4.C.
accounts for a 21.75% of the variance. The first two (three) principal components account for 58.95% (76.03%) of the total variance. The screen plot (not reported) shows a marked decrease in downward slope after the second or third principal component, implying that we can summarize our VOC variables by the first two principal components. The first principal component has a high positive correlation with 3-hexen-1-ol/terpinen-4-ol/α-terpineol/p-creosol. The second principal component is much positively correlated with 3-octanol. The principal component plot is given in Figure 5(c).
The SPME CG/MS results from the combination of the VOC derived from the mushrooms, truffle, degradation of linoleic acid, and other compounds to form new com-pounds. According to [28], the monoterpenoids and ses-quiterpenoids fractions were apported to the mushrooms together to n-hexanal, n-hexanol, 1-octen-3-ol, benzalde-hyde, and benzyl alcohol. The solforate compounds derived from the truffle together with 2-methyl-butanal, 3-methyl-butanal, hexanal, 1-octen-3-ol, and benzaldehyde [8]. Other compounds derived from the secondary thermal degrada-tion of linoleic acid. It is known that the lipid autoxidadegrada-tion initially produces peroxides or hydroperoxides [29]. The peroxide values were smaller for the free fatty acids forms of linoleic acid at all durations. Generally, the hydroperoxide content decreased during heating in a secondary oxidation status of linoleic acid, and among the numerous categories of volatiles, aldehydes are particularly represented. The satu-rated aldehydes were generally the mainly represented ones; moreover, their percent content was always higher. Satu-rated aldehydes having chain length from C5 to C7 were detected for linoleic acid. According to other authors [29], generally hexanal was the main volatile oxidation product, which is derived from the 13-hydroperoxide degradation of linoleic acid [28]. Among monounsaturated aldehydes,
trans-2-heptenal was the most represented one for linoleic
acid model systems. It has been reported that trans-2-octenal would come from the unexpected 11-hydroperoxy-9,12-octadecadienoate [30].
The dimethyl sulfone is not contained in the components of truffle-like sauce but is formed following the thermal treatment [31].
Hexanal could be derived from mushroom, truffle, and linoleic acid thermal degradation, while hexanol, 1-octen-3-ol, and benzaldehyde derived from mushroom and truffle. 2-pentyl-furan and 2,4-decadienal isomers could be either 1 3 2 13 15 14 16 18 17 22 23 24 11 12 10 5 6 8 9 4 21 19 20 7 (a) 4 6 5 1 3 2 7 9 8 10 12 11 19 20 21 13 14 15 16 17 18 22 23 24 (b)
Figure3: Cluster analysis (complete linkage clustering). Data from truffle sauces added with (a) stearic acid∗ and (b) linoleic acid∗∗. ∗Ordinal numbers referred to data from experiments as indicated in Table 1: 1–3 to P1.1/4–6 to P2.1/7–9 to P3.1/10–12 to P4.1/13–15 to
P1.C/16–18 to P2.C/19–21 to P3.C/22–24 to P4.C.∗∗Ordinal numbers referred to data from experiments as indicated in Table 1: 1–3 to P1.C/
4–6 to P1.2/7–9 to P2.C/10–12 to P2.2/13–15 to P3.C/16–18 to P3.2/19–21 to P4.C/22–24 to P4.2. 4 6 5 1 3 2 7 9 8 10 12 11 19 20 21 13 14 15 16 17 18 22 23 24
Figure4: Cluster analysis (complete linkage clustering). Data from truffle sauces added with stearic and linoleic acids∗. ∗Ordinal
numbers referred to data from experiments as indicated in Table 1: 1–3 to P1.C/4–6 to P1.2/7–9 to P2.C/10–12 to P2.2/13–15 to P3.C/ 16–18 to P3.2/19–21 to P4.C/22–24 to P4.2.
VOCs from truffle or derived from a terminal de-composition of linoleic acid.
The low amounts of heptanal could be the chemical marker of small amounts of conjugated linoleic acids present in both truffle and mushrooms according to [30].
The fats in Tuber melanosporum content were about 11.30 g/100 g on dry weight, and the linoleic acid and stearic acid content was about 50% and 11% of the lipidic fraction, respectively [18]. The fats in Boletus edulis content was about 2.2 g/100 g on dry weight, and about 57% was the linoleic acid content, while the stearic acid content was about 2% [32].
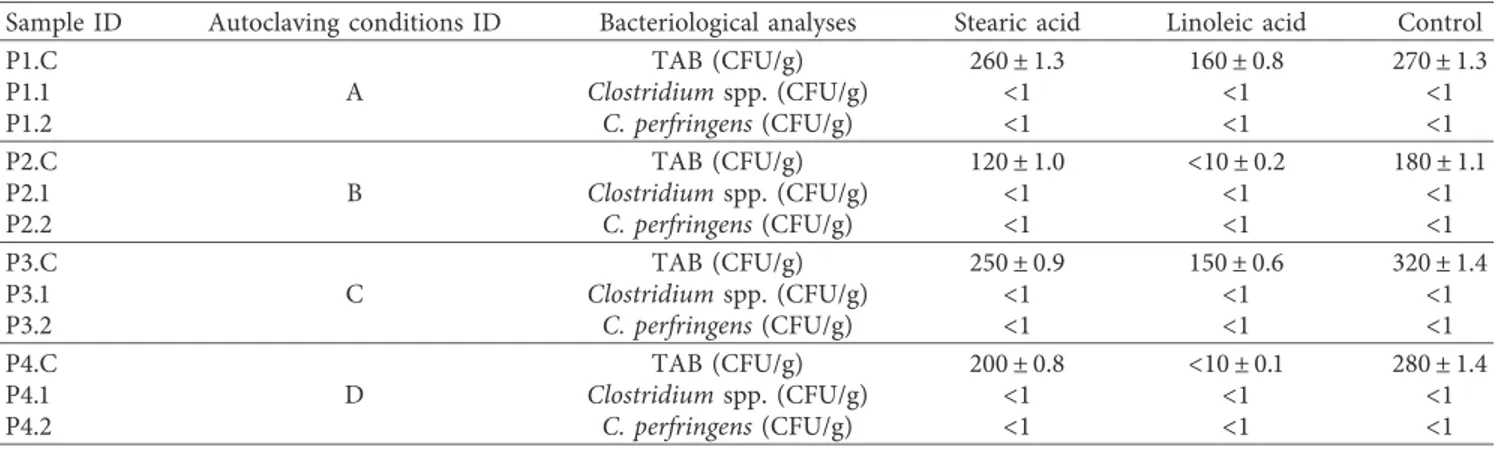
3.3. Microbiological Analyses. The microbiological quality of
samples produced with different experimental autoclaving conditions and different fatty acids is shown in Table 3. Total aerobic bacteria ranged from a mean of 10 to 320 CFU/g. It is present in all samples prepared for the different experi-mental conditions (A–D), although to varying degrees.
Clostridium spp. and C. perfringens were not detected in any
of the produce sauces tested. Linoleic acid is more effective than stearic acid, and in tests B and C, it contributes to a strong reduction of the total bacterial load (Tables 1 and 3). All the autoclaving temperature/duration combinations to which the samples and controls were subjected proved to be effective bacteriostatic against sulphite-reducing clos-tridia and Clostridium perfringens, and this regardless of the addition made to the normal formulation of the product. The total bacterial load, even if low, is instead present in the controls for all temperature/duration combinations. Linoleic acid is more effective than stearic acid and contributes with a concentration of 10% (w/w) to a decisive reduction of the total bacterial load in tests B and D (Tables 1 and 3).
4. Conclusion
The temperature, duration, and pressure of autoclave op-eration for truffle sauce sterilization induce variations in the
Pr inci pal co m po nen t 1 P1.C P4.C P3.C P2.C 1.5 Scatterplot A Principal component 2 1.5 1 1 0.5 0.5 0 0 –0.5 –0.5 –1 –1 –1.5 –1.5 (a) Pr inci pal co m po nen t 1 P1.C P3.C P1.1 P3.1 P4.1 P4.C P2.1 P2.C Scatterplot B Principal component 2 2 2 3 1 1 0 0 –1 –1 –2 –2 (b) Pr inci pal co m po nen t 1 P2.C P1.C P4.C P3.C P3.2 P4.2 P2.2 P1.2 Scatterplot C Principal component 2 2 1 0 –1 –2 1.5 2 1 0.5 0 –0.5 –1 –1.5 (c)
Figure5: Scatterplot of the first two principal components: (a) P1.C/1-P2.C/1-P3.C/1-P4.C/1, (b) P1.C/1-P2.C/1-P3.C/1-P4.C/1, (c) P1.C/ 2-P2.C/2-P3.C/2-P4.C/2.
Table3: Effect of various experimental autoclaving conditions and different fatty acids (10% w/w) on control of bacteria in truffle sauce.
Sample ID Autoclaving conditions ID Bacteriological analyses Stearic acid Linoleic acid Control
P1.C A TAB (CFU/g) 260± 1.3 160± 0.8 270± 1.3 P1.1 Clostridium spp. (CFU/g) <1 <1 <1 P1.2 C. perfringens (CFU/g) <1 <1 <1 P2.C B TAB (CFU/g) 120± 1.0 <10 ± 0.2 180± 1.1 P2.1 Clostridium spp. (CFU/g) <1 <1 <1 P2.2 C. perfringens (CFU/g) <1 <1 <1 P3.C C TAB (CFU/g) 250± 0.9 150± 0.6 320± 1.4 P3.1 Clostridium spp. (CFU/g) <1 <1 <1 P3.2 C. perfringens (CFU/g) <1 <1 <1 P4.C D TAB (CFU/g) 200± 0.8 <10 ± 0.1 280± 1.4 P4.1 Clostridium spp. (CFU/g) <1 <1 <1 P4.2 C. perfringens (CFU/g) <1 <1 <1
chemical composition of the sauce as shown by headspace examination.
Compared to hot sterilized sauces, also the addition of linoleic acid has made significant variations in the com-position of the headspace. The addition of stearic acid has an action much less than that of linoleic acid.
Data Availability
The data used to support the findings of this study are available from the corresponding author upon request.
Conflicts of Interest
The authors declare that they have no conflicts of interest.
References
[1] S. Perotto, P. Angelini, V. Bianciotto et al., “Interactions of fungi with other organisms,” Plant Biosystems-An In-ternational Journal Dealing with all Aspects of Plant Biology, vol. 147, no. 1, pp. 208–218, 2013.
[2] P. Angelini, B. Tirillini, A. Properzi, C. Rol, and R. Venanzoni, “Identification and bioactivity of the growth inhibitors inTuberspp. methanolic extracts,” Plant Biosystems-An In-ternational Journal Dealing with all Aspects of Plant Biology, vol. 149, no. 6, pp. 1000–1009, 2014.
[3] P. Angelini, B. Tirillini, D. Fiorini, E. Bricchi, and R. Venanzoni, “Can the fatty acids profile of Tuber aestivum-T. uncinatum species complex have chemotaxonomic value?,” Flora Mediterranea, vol. 25, pp. 95–104, 2015a.
[4] P. Angelini, E. Bricchi, M. S. Akhtar et al., “Isolation and identification of allelochemicals from ascocarp of Tuber species,” in Book: Plant, Soil and Microbes: Mechanisms and Molecular Interactions, K. R. Hakeem and M. S. Akhtar, Eds., vol. 1, pp. 225–252, Springer International Publishing Switzerland, Cham, Switzerland, 1st edition, 2016. [5] P. Angelini, A. Arcangeli, G. Bistocchi, A. Rubini,
R. Venanzoni, and C. Perini, “Current knowledge of Umbrian macrofungi (central Italy),” Plant Biosystems-An In-ternational Journal Dealing with all Aspects of Plant Biology, vol. 151, no. 5, pp. 915–923, 2016.
[6] F. Bellesia, A. Pinetti, A. Bianchi, and B. Tirillini, “Volatile compounds of the white truffle (Tuber magnatum Pico) from Middle Italy,” Flavour and Fragrance Journal, vol. 11, no. 4, pp. 239–243, 1996.
[7] A. M. Gioacchini, M. Menotta, M. Guescini et al., “Geo-graphical traceability of Italian white truffle (Tuber magna-tumPico) by the analysis of volatile organic compounds,” Rapid Communications in Mass Spectrometry, vol. 22, no. 20, pp. 3147–3153, 2008.
[8] P. D´ıaz, E. Ib´añez, F. J. Señor´ans, and G. Reglero, “Truffle aroma characterization by headspace solid-phase micro-extraction,” Journal of Chromatography A, vol. 1017, no. 1-2, pp. 207–214, 2003.
[9] P. Angelini, L. Costamagna, and M. Ciani, “Bacterial ecology of ascocarps of the Tuber sp. pl.: characterization of functional groups and their capability to metabolize sulfite and organic sulfur compounds,” Annals of Microbiology, vol. 48, pp. 59– 65, 1998.
[10] F. Bellesia, A. Pinetti, B. Tirillini, and A. Bianchi, “Temperature-dependent evolution of volatile organic compounds in Tuber
borchii from Italy,” Flavour and Fragrance Journal, vol. 16, no. 1, pp. 1–6, 2001.
[11] R. Saltarelli, P. Ceccaroli, P. Cesari, E. Barbieri, and V. Stocchi, “Effect of storage on biochemical and microbiological pa-rameters of edible truffle species,” Food Chemistry, vol. 109, no. 1, pp. 8–16, 2008.
[12] E. Harki, D. Bouya, and R. Dargent, “Maturation-associated alterations of the biochemical characteristics of the black truffle Tuber melanosporum Vitt,” Food Chemistry, vol. 99, no. 2, pp. 394–400, 2006.
[13] F. Nazzaro, F. Fratianni, G. Picariello, R. Coppola, A. Reale, and A. D. Luccia, “Evaluation of gamma rays influence on some biochemical and microbiological aspects in black truffles,” Food Chemistry, vol. 103, no. 2, pp. 344–354, 2007. [14] A. M. Gioacchini, M. Menotta, L. Bertini et al., “Solid-phase microextraction gas chromatography/mass spectrometry: a new method for species identification of truffles,” Rapid Communications in Mass Spectrometry, vol. 19, no. 7, pp. 2365–2370, 2005.
[15] M. Piloni, I. Tat, A. Tonizzo, and F. Battistutta, “Aroma characterization of white truffle by GC-MS and GC-O,” IJFS, vol. 17, pp. 463–468, 2005.
[16] R. E. March, D. S. Richards, and R. W. Ryan, “Volatile compounds from six species of truffle - head-space analysis and vapor analysis at high mass resolution,” International Journal of Mass Spectrometry, vol. 249-250, pp. 60–67, 2006.
[17] M. Falasconi, M. Pardo, G. Sberveglieri, F. Battistutta, M. Piloni, and R. Zironi, “Study of white truffle aging with SPME-GC-MS and the Pico2-electronic nose,” Sensors and Actuators B: Chemical, vol. 106, no. 1, pp. 88–94, 2005. [18] B. Granetti, A. De Angelis, and G. Materozzi, Umbria: Land of
Truffles. Umbria Region, Minister for Agriculture, Forestry, Hunting and Fisheries editor, Takamori, Japan, 2005. [19] EFSA, “Panel on dietetic products, nutrition and allergies
(NDA),” EFSA Journal, vol. 7, no. 9, p. 1276, 2009. [20] EFSA, “Panel on dietetic products, nutrition and allergies
(NDA),” EFSA Journal, vol. 9, no. 4, p. 2069, 2011. [21] EFSA, “Panel on dietetic products, nutrition and allergies
(NDA),” EFSA Journal, vol. 8, no. 10, p. 1794, 2010. [22] K.-S. Jaw, C.-K. Hsu, and J.-S. Lee, “The thermal
de-composition behaviors of stearic acid, paraffin wax and polyvinyl butyral,” Thermochimica Acta, vol. 367-368, pp. 165–168, 2001.
[23] R. P. Adams, Identification of Essential Oil Components by Gas Chromatography/Mass Spectrometry, Allured, Carol Stream, IL, USA, 4th edition, 2007.
[24] NIST 08, Mass Spectral Library (NIST/EPA/NIH), National Institute of Standards and Technology, Gaithersburg, MD, USA, 2008.
[25] N. da Silva, M. H. Taniwaki, V. C. A. Junqueira, N. F. A. Silveira, M. S. do Nascimento, and R. A. R. Gomes, Microbiological Examination Methods of Food and Water. A Laboratory Manual, CRC Press, Taylor & Francis Group, Boca Raton, FL, USA, 2012.
[26] S. M. Schulten, E. Benschop, N. J. D. Nagelkerke, and K. A. Mooijman, Validation of Microbiological Methods: Enumeration of Clostridium Perfringens According to ISO 7937, Report 286555002, National Institute of Public Health and the Environment, Bilthoven, The Netherlands, 2nd edi-tion, 2001.
[27] A. Mortensen, F. Aguilar, R. Crebelli et al., “Re-evaluation of fatty acids (E 570) as a food additive,” EFSA Journal, vol. 15, no. 5, p. 4785, 2017.
[28] P. G. d. Pinho, B. Ribeiro, R. F. Gonçalves et al., “Correlation between the pattern volatiles and the overall aroma of wild edible mushrooms,” Journal of Agricultural and Food Chemistry, vol. 56, no. 5, pp. 1704–1712, 2008.
[29] T. I. H¨am¨al¨ainen, S. Sundberg, T. Hase, and A. Hopia, “Ste-reochemistry of the hydroperoxides formed during autoxida-tion of CLA methyl ester in the presence of α-tocopherol,” Lipids, vol. 37, no. 6, pp. 533–540, 2002.
[30] M. C. Garc´ıa-Mart´ınez, G. M´arquez-Ruiz, J. Fontecha, and M. H. Gordon, “Volatile oxidation compounds in a conju-gated linoleic acid-rich oil,” Food Chemistry, vol. 113, no. 4, pp. 926–931, 2009.
[31] G. G. Dimalla and J. Van Staden, “Metabolism of dimethyl sulfoxide in sprouting potato tubers,” Environmental and Experimental Botany, vol. 20, no. 1, pp. 55–59, 1980. [32] S. A. Heleno, R. C. Ferreira, A. L. Antonio, M.-J. R. P. Queiroz,
L. Barros, and I. C. F. R. Ferreira, “Nutritional value, bioactive compounds and antioxidant properties of three edible mushrooms from Poland,” Food Bioscience, vol. 11, pp. 48–55, 2015.
Hindawi www.hindawi.com International Journal of Volume 2018
Zoology
Hindawi www.hindawi.com Volume 2018 Anatomy Research InternationalPeptides
Hindawi www.hindawi.com Volume 2018 Hindawi www.hindawi.com Volume 2018 Journal of Parasitology ResearchGenomics
International Journal of Hindawi www.hindawi.com Volume 2018Hindawi Publishing Corporation
http://www.hindawi.com Volume 2013 Hindawi www.hindawi.com
The Scientific
World Journal
Volume 2018 Hindawi www.hindawi.com Volume 2018Bioinformatics
Advances inMarine Biology
Journal ofHindawi www.hindawi.com Volume 2018 Hindawi www.hindawi.com Volume 2018