New sensible method to quantize the intestinal absorption of receptor ligands
Michela Buccioni, Diego Dal Ben, Catia Lambertucci, Aleix Martí Navia, Massimo Ricciutelli, Andrea Spinaci, Rosaria Volpini, and Gabriella Marucci*
School of Medicinal Sciences and Health Products, Medicinal Chemistry Unit, University of Camerino, via S. Agostino 1, 62032 Camerino, Italy.
* Corresponding Author. Tel.: (+39)0737402223; email: [email protected]
Abstract
In recent years, special attention has been paid to the A3 adenosine receptor (A3AR) as a possible pharmacological target to treat intestinal inflammation. In this work, it was set up a novel method to quantify the concentration of a promising anti-inflammatory agent inside and outside of intestinal barrier using the everted gut sac technique. The compound chosen for the present study is one of the most potent and selective A3AR agonist reported so far, named AR 170 (N6
-methyl-2-phenylethynyl-5’-N-methylcarboxamidoadenosine). In order to evaluate the intestinal absorption of AR 170 the radioligand binding assay in comparison with HPLC-DAD was used. Results showed that the compound is absorbed via passive diffusion by paracellular pathway. The concentrations determined in the serosal (inside the sac) fluid by radioligand binding assay are in good agreement with those obtained through the widely used HPLC/MS protocol, demonstrating the reliability of the method. It is worthwhile to note that the radioligand binding assay allows detecting very low concentrations of analyte, thus offering an excellent tool to measure the intestinal absorption of receptor ligands. Moreover, the AR 170 quantity outside the gut sac and the interaction with A3AR could presuppose good topical anti-inflammatory effects of this compound.
KEYWORDS: everted sac; adenosine receptors; intestinal inflammation; intestinal absorption; paracellular pathway; binding study.
Millions of people worldwide suffer from a chronic inflammation of the gastrointestinal tract called inflammatory bowel disease (IBD). IBD is characterized by a chronic mucosal inflammation that causes colonic tissue damage and inflammation of the small bowel and/or the colon leads to persistent diarrhea and abdominal pain. This pathology is due to a hyper-activation of effector immune cells, which produce high levels of pro-inflammatory cytokines such as tumor necrosis factor alpha (TNF-α), interleukin 1 beta (IL-1β), and interferon gamma (IFN-γ).1 In the
immunological situation, nuclear factor-kappa B (NF-κB) was known as one of the crucial regulators.2,3 In fact, its activation stimulate the pro-inflammatory genes expression influencing the
progression of mucosal inflammation. An anti-inflammatory strategy in IBD was based on inhibition of NF-κB activation.
In rodent models, to induce intestinal inflammation, dextran sulfate sodium (DSS) is usually used.4,5 The treatment with DSS produces weight loss, bloody diarrhea, epithelial cell damage, and immune cell infiltration, as well as an increased production of TNF-α, IL-1β, NF-κB etc.6,7
Purine nucleosides and nucleotides like adenosine (Ado) and Ado-5‘-triphosphate (ATP) are involved in a relevant number of physiological functions8,9 through the activation of specific membrane receptors called P1 (A1, A2A, A2B, and A3) and P2 (P2X1-7 and P2Y1,2,4,6,11-14), respectively.10-14 It is widely documented that Ado and ATP released from enteric purinergic nerves or from smooth muscle cells15 regulate intestinal functions. In addition, it has been demonstrated that Ado also regulates carrier-mediated glucose transport.16
Adenosine A3 receptor (A3AR), which belongs to the Gi/Gq-coupled receptor family have been considered as a possible pharmacological target for intestinal inflammation treatment.17-20
Stimulation of A3AR inhibits adenylate cyclase activity, activates phospholipase C, and triggers
calcium mobilization, leading to modulation of signaling pathways such as Wnt, PI3K/AKT, and NF-κB. IB-MECA (N6-(3-iodobenzyl)adenosine-5’-N-methylcarboxamide; Ki 1.2 nM for A3AR, 3- and 2,100-fold selectivity versus A1, and A2A ARs, respectively),21 an A3AR agonist, induces a significant improvement in the pathological state both in DSS-induced colitis and in spontaneous colitis in IL-10 knockout mice.22
Considering the role of adenine nucleosides and nucleotides in the pathophysiology of gastrointestinal tract it is hence crucial the development of compounds able to modulate the purinergic signalling.23-26
For these reasons, the present study was centered on setting up a new method to quantize the concentration of a promising anti-inflammatory agent inside and outside the intestinal barrier using the everted gut sac technique.27 The used compound named AR 170 (N6
-methyl-2-phenylethynyl-5’-N-methylcarboxamidoadenosine; Fig. 1) results one of the most potent and selective A3AR agonist reported so far (AR 170; Ki 0.44 nM for A3AR, 74, 131 and 93,325-fold selectivity versus A1, and A2A ARs, respectively).28,29 The analysis of compound concentration in the serosal and mucosal fluids are usually performed by HPLC analysis, but the HPLC technique setting is far from easy since the fluid obtained from the everted sac is rich in mineral salts and amino acids, causing a signal noise increase. Moreover, HPLC-DAD requires relatively high quantity of samples and the detector sensibility often varies according to the class of compound that is being quantified; thus, detecting molecules from different classes can be difficult.30
On the other hand, it is problematic to use HPLC/MS analysis in a saline solution even if with this method it is possible to reach picogram concentrations.
To determine the compound concentrations in serosal and mucosal fluid, given the ability of AR 170 to bind selectively the A3AR, it was used a radioligand binding assay as analytical technique. The advantages of using this technique are the possibility to quantify a small amount of compound, such as a concentration of 300 nM utilized in the experiment, the easy procedure, and the fact that the biological medium does not interfere with the experiments.
Hence, the aim of the present study was the development of a new method based on the radioligand binding assay that could be utilized to study the intestinal absorption of receptor ligands and to quantify the AR 170 outside the gut sac in order to predict topical anti-inflammatory effects.
N N N N NH O OH HO H3C Ph O H N H3C AR 170
Figure 1. Structure of the A3AR agonist AR 170.
2. Materials and Methods
2.1. Animals
Directive of 24 November 1986 (86/609/EEC).
Twenty adult male Wistar rats (250–300 g; 11–12 weeks) were purchased from Charles River Laboratories Srl (Lecco, Italy).27
2.2. Test materials
TC199 medium (with Hank's salts and L-glutamine, without NaHCO3) was purchased from Sigma-Aldrich (Milan, Italy) and radiolabelled 2-hexyn-1-yl-N6-methyladenosine ([3H]HEMADO) was a concession by Prof. Klotz K.N. (Institute of Pharmacology and Toxicology, University of Wuerzburg, Germany). All other chemical used were of reagent grade.
The authors synthesized N6-Methyl-2-phenylethynyl-5’-N-methylcarboxamidoadenosine (AR 170).28 Characterization data of this compound: Mp > 250 °C; 1H NMR (DMSO-d6) δ 2.76 (d, 3H, J = 4.8 Hz, CH3-NHCO), 2.97 (m, 3H, CH3-NH), 4.14 (m, 1H, H-3’), 4.32 (s, 1H, H-4’), 4.59 (m,
1H, 2’), 5.59 (d, 1H, J = 5.6 Hz, OH), 5.78 (d, 1H, J = 3.6 Hz, OH), 5.96 (d, 1H, J = 7.2 Hz, H-1’), 7.46 (m, 3H, H-Ph), 7.61 (d, 2H, J = 6.0 Hz, H-Ph), 8.09 (m, 1H, NH-CH3), 8.47 (s, 1H, H-8), 8.63 (m, 1H, NH-CO). ESI-MS: negative mode m/z 407.4 ([M-H]-), 443.4 ([M+Cl]-), 497.5 ([M+Br]-); positive mode m/z 409.4 ([M+H]+), 431.4 ([M+Na]+). Anal. calcd for C20H20N6O4: C, 58.82; H, 4.94; N, 20.58; found: C, 59.21; H, 5.33; N, 20.23.
2.3. Cell culture and membrane preparation
CHO cell line stable transfected with hA3ARs (kindly given by Prof. Klotz K.N., Institute of Pharmacology and Toxicology, University of Wuerzburg, Germany) was grown in DMEM/F-12 supplemented with 10% FBS, 100 U/ml penicillin and 100 µg/ml streptomycin, 2.5 µg/ml amphotericin B, 0.1 mg/ml geneticin and 1 mM sodium pyruvate. Cells were cultured in a humidified atmosphere at 37 °C in 5% CO2/95% air as described earlier.31 Crude membranes for radioligand binding experiments were prepared by collecting cells (CHO stably expressing hA3ARs) in ice-cold hypotonic buffer (5 mM Tris/HCl, 2 mM EDTA, pH 7.4). The cell suspension was homogenized on ice (Ultra-Turrax, 2 x 20 sec at full speed) and the homogenate was spun for 10 min (4 °C) at 3200 rpm. The supernatant was then centrifuged for 45 min at 37000 rpm at 4 °C. The membrane pellet was resuspended in the specific binding buffer, frozen in liquid nitrogen at a protein concentration of 2–4 mg/ml and stored at -80 °C.
2.4. Everted gut sac studies
Studies were carried out on adult male Wistar rats (250–300 g; 11–12 weeks). Before being sacrificed by cervical dislocation, animals were fasted for 12-16 h. The small intestine was removed
washed with TC199 medium and the duodenum segment (1 cm from the pylorus) was isolated and everted on a glass rod. It was divided into segments and each of them was bonded with a silk braided suture. They were filled with fresh medium and were tied off with a second moistened thread to create a shut section (sac). Each sac was placed in a 50 ml beaker containing 9.0 ml of oxygenated (O2/CO2, 95%:5%) TC199 medium at 37 °C. 1 ml of medium, containing AR 170, was added to obtain the final concentration of 300 nM, 1, 3 and 10 µM. After the 60 min of incubation the serosal (inside the sac) and mucosal (outside the sac) fluids were taken.27 In order to detect the concentrations of compound in the serosal and mucosal fluids a 6-point analytical curve was constructed using the radioactive binding technique, for each point 6 replicates were conducted.
2.5. Radioligand binding assay
The samples from serosal and mucosal fluid withdrawn from everted gut sac studies were incubated for 3 h with membranes of A3AR transfected cells in the presence of the radioactive [3H]HEMADO, a high affinity A3AR agonist. In order to calculate the compound concentrations inside and outside the sacs the calibration curve was constructed. The mixture was incubated in a 96-well plate, and after the incubation time, it was filtered utilizing a 96-well microplate filtration system to separate the free fractions from the bound fractions. The filters were washed three times with 200 µl of ice-cold binding buffer (50 mM Tris/HCl, 10 mM MgCl2, 1 mM EDTA, pH 8.25) and subsequently dried. After the addition of 20 µl of scintillation cocktail, the bound radioactivity was determined using a Perkin Elmer Microbeta2 scintillation counter. Non-specific binding of [3H]HEMADO was determined in the presence of 100 mM of N6phenylisopropyladenosine (R-PIA).31 All binding data were calculated by non-linear curve fitting with Prism 5.0 programme (GraphPad Software, San Diego, CA, USA).
2.6. Apparent permeability coefficients
Permeability coefficients (Papp)32 were calculated according to the following Eq.:
Papp ___dQ dt x ___
1 ACt =
Papp (cm/s) is the apparent permeability coefficient; dQ/dt (nM/s) is the analyte quantity, per unit
time, transported across the membrane. A (3.93 ± 0.038 cm2) is the surface area of everted gut sac intestinal mucosa available for permeation and Ct (µg /ml) is the initial analyte concentration
2.7. Percentage of drug absorption (A%) and drug retention (Ad%)
At the end of each experiment, the concentration of analyte absorbed was calculated according to the following Eq.:
A% = ___Cs
Ci x 100
Cs and Ci (nM) represent the analytes concentrations inside the sacs (serosal) and the initial
concentration of the drug outside the everted gut sacs, respectively. The percentage of drug retained was calculate using the Eq.:
Ad% = 100 - (C_________s+ Cm)
Ci x 100
Cs and Cm (nM) represent the analytes concentrations quantified inside (serosal) and outside
(mucosal) the sacs, respectively; Ci (nM) is the initial concentration of the drug outside the everted gut sacs.27
2.8. HPLC-DAD analysis
The experiments were carried out with an Agilent 1100 Series (Agilent Technologies, Palo Alto, CA, USA). The system consisted of a G1312A binary pump, a mobile phase vacuum degassing unit, a G1329A auto sampler, a temperature controlled column compartment, G1315C Diode Array Detector and an Agilent G2445DSL LC/MSD Trap SL (Ion Trap Mass Spectrometer) equipped with an electrospray source; data were acquired and integrated by the ChemStation (LC System Rev. B01.03[204], Agilent Technologies, Milan, Italy). The stationary phase was composed of Spherisorb ODS-2 material (Merck, Milan, Italy) packed in a stainless steel column (250 mm×4.6 mm with 5-µm particle size). Chromatographic separations were achieved using a mobile phase consisting of water with 0.1% of formic acid and methanol with 0.1% of formic acid (30:70, v/v), working in the isocratic mode at a flow rate of 0.8 ml/min. The column temperature was set at 35 °C and the injection volume was 5-µl. HPLC-DAD analysis, which was used for the quantification, was performed monitoring wavelengths at 310 nm.
The standard curves of AR 170 was constructed. A 5-point calibration curve was constructed by analysing various amounts (100, 300, 1,000, 3,000, and 10,000 nM) of AR 170 diluted in medium solution. The curve showed an expected linearity in the whole range of the tested concentrations, with a regression coefficient (R2) of 0.9984. The limits of detection (LOD) and quantification (LOQ), under the present chromatographic conditions, were determined at a signal-to-noise ratio
(S/N) of about 3 and 10; they were 0.011 and 0.036 mM, respectively. The precision of the method was demonstrated as the intra- and inter-assay RSD% values were in all cases below 2.6%. Appropriate dilutions were carried out to obtain concentrations in the range of the calibration conditions. The system showed no interference from other components in the samples according to guidance (FDA 2013, USA: FDA DRAFT Guidance for Industry: bioanalytical method validation).
2.9. Statistical analysis
Statistical analysis was performed using Student’s t-test, or ANOVA. The results were represented as mean of 4-5 replicates of different animals ± standard error (±SE) for all experiments. The apparent permeability average values (Papp) were compared for each sample using one-way analysis of variance (ANOVA) test. Student’s t-test was used to compare differences between drug diffusion data sets. A p-value <0.05 was considered to indicate a significant difference.
3. Results and discussion
The determination of the promising anti-inflammatory AR 170 was conducted inside and outside of duodenum since it is the intestinal portion where the digestion of nutrients is completed and most of the monosaccharides and amino acids pass into the blood. Moreover, upper gastrointestinal inflammatory processes are extremely common and have a wide spectrum of causes and manifestations.
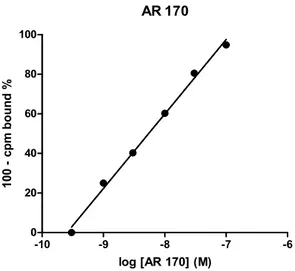
In order to evaluate the exact concentration of AR 170 by planned binding assay, an AR 170 analytical curve on hA3AR stably transfected cell membranes was constructed using concentrations ranging from 0.3 to 100 nM (Fig. 2). These concentrations were chosen based on the high affinity of this compound versus the A3AR (Ki 0.44 nM).
-10 -9 -8 -7 -6 0 20 40 60 80 100 AR 170 log [AR 170] (M) 10 0 - cp m b o u n d %
Figure 2. Calibration line of AR 170 obtained through radioligand binding assay on A3AR.
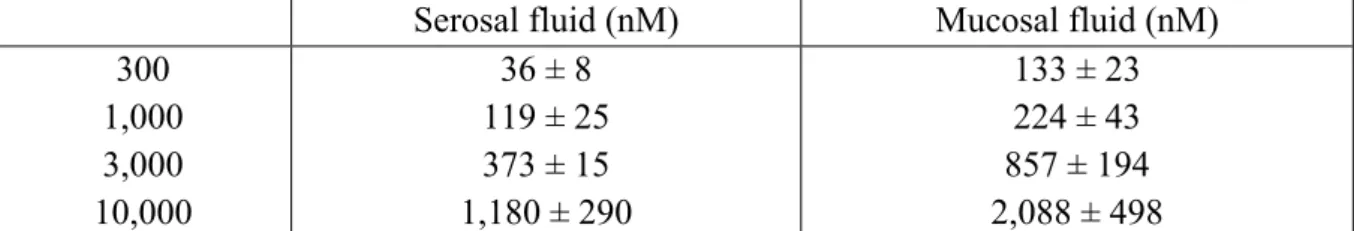
The 6-point calibration line was constructed by analysing various amounts (0.3, 1, 3, 10, 30, and 100 nM) of AR 170 diluted in medium solution. The curve showed an expected linearity in the whole range of the tested concentrations, with a regression coefficient (R2) of 0.9989. The calibration line was constructed using binding competition experiments, based on the displacement of [3H]HEMADO by AR 170. [3H]HEMADO is an agonist with high affinity and selectivity for A3AR, even if less than AR 170. It is a useful tool for specific screening of A3AR receptor agonists and antagonists in radioligand binding assay. Both the compound concentrations in mucosal (outside the sac) and serosal (inside the sac) fluids were studied by using radioligand binding assay method, too. Glucose was used to verify the integrity and viability of the gut sacs. Glucose was incubated at 20 mM for 60 minutes. The glucose concentration was measured by a glucometer in both solutions inside and outside the sac. At the same time, intestine duodenal sacs were exposed at a range of AR 170 concentrations (Tab. 1) with respect to glucose treated tissues. AR 170 and glucose samples were collected from both the serosal and the mucosal side of the rat gut sacs at a fixed time. The concentrations of the AR 170 present in serosal and mucosal fluids were not found within the range of concentrations reported in the calibration line. Therefore, appropriate dilutions were carried out to obtain concentrations in the range of the calibration conditions. These fluids were incubated in a 96-well plate that, after filtration, was read by a radiometric detection system. Results obtained are expressed as number of photons detected per time unit and indicated as counts per minute (cpm). The AR 170 concentrations (expressed in nM) inside and outside the sacs after 60 min of incubation are summarized in the Table I.
Table I. Results obtained from the absorption studies of AR 170 through binding assay.
Serosal fluid (nM) Mucosal fluid (nM)
300 36 ± 8 133 ± 23
1,000 119 ± 25 224 ± 43
3,000 373 ± 15 857 ± 194
10,000 1,180 ± 290 2,088 ± 498
The data represent the means ± SE (n= 3-4 experiments). Compound concentration values are statistically different (p < 0.05).
The results showed different compound concentrations in the serosal and mucosal fluids; the serosal fluid concentrations are, in all cases, proportional to the amount of compound applied to the medium. This is evident considering the percentages of AR 170 absorbed (A%) and retained (Ad%) on intestinal tissue (Tab. II).
Table II. Percentages of drug retention (Ad%) and absorption (A%), across the everted gut sac, and apparent permeability coefficient Papp (cm/s).
AR 170 Concentration nM Percentage of drug retention (Ad%) Percentage of drug absorption (A%) Papp (x10-6 cm/s) 300 44 ± 13 12 ± 1.9 8.5 ± 0.7 1,000 65 ± 16 11.9 ± 2 8.4 ± 0.6 3,000 59 ± 12 12.4 ± 2.4 8.5 ± 0.9 10,000 67 ± 14 11.8 ± 2.6 8.4 ± 0.8
The data represent the means ± SE (n= 4-5 experiments). Compound percentage values are statistically different (p < 0.05).
The linear increase in the amount of AR 170 present inside the sac indicates that its transport across the intestinal membrane is probably mediated by passive diffusion with a A% about 12 % for all concentrations utilized.
It is interesting to note that the percentage of AR 170 absorbed is the same even using high concentrations of compound; this confirms that the transport across the intestinal barrier is certainly due to passive diffusion and it is not saturable.
The most common absorption mechanism across the intestine is passive diffusion and it is divided into two distinct pathways: paracellular and transcellular pathways. The first one is characteristic of hydrophilic drugs that diffuse through the aqueous pores at the tight junctions between the intestinal enterocytes.33 Molecules that are absorbed through this pathway are usually small and hydrophilic (molecular weight (MW) < 250 Da and logP < 0, respectively). The absorption by paracellular
pathway is minor since the tight junctions account about 0.01% of the total surface area of intestinal membrane.34
On the other hand, the transcellular pathway is characteristic of quite large and lipophilic drugs (MW > 300 Da and logP > 0, respectively) that pass across the lipid cell membrane of the intestinal enterocytes by tree different ways: transcellular diffusion, carrier mediated transportation, and transcytosis.34 In order to calculate the LogP of AR 170 and to predict ADMET properties, it was used a freely accessible web server (http://structure.bioc.cam.ac.uk/pkcsm).35 Results showed that the AR 170 value of logP is -0.367 with a MW = 408.418. This suggests that AR 170 may not have affinity for membrane-bound transporters and therefore may be excluded the involvement of the transcellular pathway, confirming that it is absorbed through paracellular pathway. The majority of drugs are transported across the transcellular pathway, and the few, which typically rely on the paracellular transport pathway, have usually much lower bioavailability. Another parameter that is important to pay attention is the percentage of drug retention (Ad%).
The amount of retained analyte, by the everted gut sac tissues, ranged from 44 to 67 %. This percentage is apparently quite high, also according to Gurunath and coworkers who suggest that percentages of drug retention on the intestinal barrier should be less than 10%.36
Moreover, permeability coefficient (Papp) value is a direct and highly sensitive measurement of the ability to cross the intestinal barrier.37 Experimental Papp values are used as markers to distinguish the test compound as highly or poorly permeable. Generally, compounds that have a Papp greater than approximately 10×10−6 cm/s are classified as well‐absorbed compounds.38 Data obtained from apparent permeability studies further confirmed the absorption of AR 170, underlined by the low permeability coefficient (Papp) value (8.5×10⁻⁶ cm/s, Tab. 2).
A possible explanation of the low amount of AR 170 inside the intestinal sac is that a fraction of it was not recovered probably because it was metabolized, as revealed by the presence of many peaks close to AR 170 area by HPLC-DAD (data not shown).
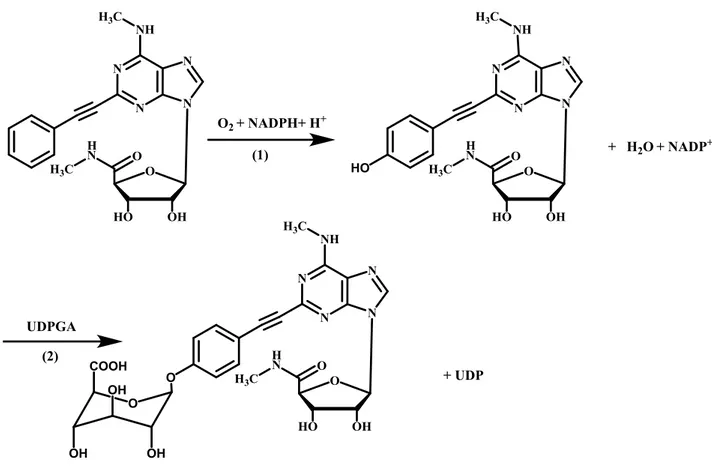
In fact, many sites in the body are involved in drug metabolism including the gastrointestinal mucosa39-41. The phenylethynyl chain in 2 position of AR 170 could be oxidated by cytochrome P450 enzyme (phase I metabolism) to give the corresponding phenol derivative, which could be rapidly eliminated after glucuronide conjugation (phase II metabolism). The supposed metabolic reactions are reported in Figure 3.
This hypothesis could explain the high amount of compound retained. Another explanation of this phenomenon could be related to the interaction of AR 170 with the ARs present in the crypts around the villi.42-44 This hypothesis could be in favor of the AR 170 topical anti-inflammatory effects.
N N N N NH O OH HO H3C O H N H3C N N N N NH O OH HO H3C O H N H3C HO O2+ NADPH+ H+ + H2O + NADP+ N N N N NH O OH HO H3C O H N H3C O UDPGA O COOH OH OH OH + UDP (1) (2)
Figure 3. Metabolism reactions catalyzed by cytochrome P450 (1) and uridine diphosphate (UDP)– glucuronosyltransferases (2)
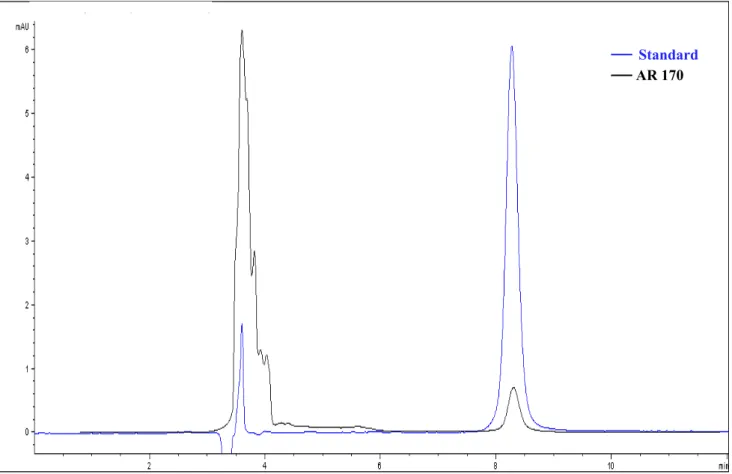
In order to validate this method, the concentrations of AR 170 in the serosal fluids were also investigated by HPLC-DAD analysis and the results compared to the ones obtained by radioligand binding assay. Due to the low concentrations utilized, it was possible to analyse only the most concentrated samples (3 µM and 10 µM). The presence of the AR 170 in the mucosal and serosal fluids was studied in comparison with standard solutions. In Figure 4 it is reported an example of the AR 170 chromatogram. The perfect overlapping of its peak with that of the standard solution containing only pure compound confirms the specificity of the method.
Figure 4. Chromatogram of the AR 170 salt standard at 310 nm.
Results, showed in Table 3, underline a good correlation with data obtained though radioligand binding assay, confirming the validity of the novel approach to study the intestinal absorption.
Table 3. Results obtained from the absorption studies of A3AR agonist AR 170 through HPLC-DAD analysis in comparison withradioligand binding assays.
AR 170 (nM) Concentration nM Serosal fluid analysed by
HPLC-DAD analysis
Serosal fluid analysed by radioligand binding assay 300 - 36 ± 8 1,000 - 119 ± 25 3,000 550 ± 115 373 ± 15 10,000 2,000 ± 437 1,180 ± 290 Standard AR 170
The data represent the means ± SE (n= 3-4 experiments)
4. Conclusion
In this work, we developed a novel analytical method by combining a radioligand binding assay with the everted gut sac technique, to evaluate the intestinal absorption of a potent and selective A3AR agonist. Results showed that the compound is absorbed in small quantity by paracellular pathway in duodenum tract and the estimated concentrations in the serosal fluid by radioligand binding assays are in good agreement with those obtained through the widely used HPLC-DAD protocol, demonstrating the reliability of the method. Moreover, the AR 170 quantity outside the gut sac and the interaction with A3AR could presuppose good topical anti-inflammatory effects of this compound.
Radioligand binding assay allows a higher sensibility respect to HPLC-DAD method, offering an excellent tool to measure the intestinal absorption of receptor ligands. The new developed technique avoids also the long set up of the HPLC parameters when it is necessary to quantify molecules that are difficult to separate by chromatography.
ACKNOWLEDGMENT
This work was supported by the University of Camerino (Progetto FAR FPI000042) and by a grant from the Ministry of Research (PRIN N° 2015E8EMCM_008, 2015).
References
1 Matricon J, Barnich N, Ardid D. Immunopathogenesis of inflammatory bowel disease. Self Nonself. 2010; 1(4):299–309. https://doi.org/10.4161/self.1.4.13560
2 Wullaert A, Bonnet MC, Pasparakis M. NF-kappaB in the regulation of epithelial homeostasis and inflammation. Cell Res. 2011; 21(1):146–158.
https://doi.org/10.1038/cr.2010.175
3 Spehlmann ME, Eckmann L. Nuclear factor-kappa B in intestinal protection and destruction.
Curr Opin Gastroenterol. 2009; 25(2):92–99.
https://doi.org/10.1097/MOG.0b013e328324f857
4 Xue X, Ramakrishnan S, Anderson E, Taylor M, Zimmermann E, Spence J, Huang S, Greenson, J, Shah Y. Endothelial PAS Domain Protein 1 Activates the Inflammatory Response in the Intestinal Epithelium to Promote Colitis in Mice. Gastroenterology. 2013; 145(4):831–841. https://doi.org/10.1053/j.gastro.2013.07.010
5 Ren T, Qiu Y, Wu W, Feng X, Ye S, Wang Z, Tian T, He Y, Yu C, Zhou Y. Activation of Adenosine A3 Receptor Alleviates TNF-α-Induced Inflammation through Inhibition of the NF-κB Signaling Pathway in Human Colonic Epithelial Cells. Mediators Inflamm. 2014, ID 818251. http://dx.doi.org/10.1155/2014/818251
6 Lee HJ, Lee HG, Choi KS, Surh YJ, Na HK. Diallyl trisulfide suppresses dextran sodium sulfate-induced mouse colitis: NF-kappaB and STAT3 as potential targets. Biochem Biophys Res Commun. 2013; 437(2):267–273. https://doi.org/10.1016/j.bbrc.2013.06.064
7 Dai C, Zheng CQ, Meng FJ, Zhou Z, Sang LX, Jiang M. VSL#3 probiotics exerts the anti-inflammatory activity via PI3k/Akt and NF-kappaB pathway in rat model of DSS-induced colitis. Mol Cell Biochem. 2013: 374(1-2):1–11. https://doi.org/10.1007/s11010-012-1488-3
8 Haskò G, Cronstein BN. Adenosine: an endogenous regulator of innate immunity. TRENDS Immunol. 2004; 25:33-39. https://doi.org/10.1016/j.it.2003.11.003
9 Haskó G, Cronstein B. Regulation of Inflammation by Adenosine. Front Immunol. 2013; 4:85.https://doi.org/10.3389/fimmu.2013.00085
10 Cristalli G, Lambertucci C, Marucci G, Volpini R, Dal Ben D. A2A adenosine receptor and its modulators: overview on a druggable GPCR and on structure-activity relationship analysis and binding requirements of agonists and antagonists. Curr Pharm. 2008; 14 (15):1525-52. https://doi.org/10.2174/138161208784480081
11 Burnstock G. Purinergic signalling in the gastrointestinal tract and related organs in health and disease. Purinergic Signal. 2014; 10(1): 3–50. https://doi.org/10.1007/s11302-013-9397-9
12 Diezmos EF, Bertrand PP, Liu L. Purinergic Signaling in Gut Inflammation: The Role of Connexins and Pannexins. Front Neurosci. 2016; 10:311.
https://doi.org/10.3389/fnins.2016.00311
13 Burnstock G. Purine and purinergic receptors Cell. Brain and Neuroscence Advances. 2018; 2:1-10 https://doi.org/10.1177/2398212818817494
14 Burnstock G. Purinergic signalling: from discovery to current developments. Exp Physiol. 2014; 99(1):16–34. https://doi.org/10.1113/expphysiol.2013.071951
15 Burnstock G. Purinergic signalling in the gut. Adv Exp Med Biol 2016; 891:91-112.
https://doi.org/10.1007/978-3-319-27592-5_10
16 Kimura Y, Turner JR, Braasch DA, Buddington RK. Lumenal adenosine and AMP rapidly increase glucose transport by intact small intestine. Am J Physiol Gastrointest Liver Physiol. 2005; 289(6):1007–1014. https://doi.org/10.1152/ajpgi.00085.2005
17 Antonioli L, Colucci R, Pellegrini C, Giustarini G, Tuccori M, Blandizzi C, Fornai M. The role of purinergic pathways in the pathophysiology of gut diseases: Pharmacological modulation and potential therapeutic applications. Pharmacol. Ther. 2013; 139(2):157-188.
https://doi.org/10.1016/j.pharmthera.2013.04.002
18 Dal Ben D, Antonioli L, Lambertucci C, Fornai M, Blandizzi C, Volpini R, Purinergic Ligands as Potential Therapeutic Tools for the Treatment of Inflammation-Related Intestinal Diseases. Front Pharmacol. 2018; 9:212. https://doi.org/10.3389/fphar.2018.00212
19 Wu W, He Y, Feng X, Ye S, Wang H, Tan W, Yu C, Hu J, Zheng R, Zhou Y. MicroRNA-206 is involved in the pathogenesis of ulcerative colitis via regulation of adenosine A3 receptor. Oncotarget. 2017; 8(1):705-721. https://doi.org/10.18632/oncotarget.13525
20 Jacobson KA, Merighi S, Varani K, Borea PA, Baraldi S, Tabrizi MA, Romagnoli R, Baraldi, PG, Ciancetta A, Tosh DK, Gao ZG, Gessi S. A3 Adenosine Receptors as Modulators of Inflammation: From Medicinal Chemistry to Therapy. Med Res Rev. 2017; 38(4):1031-1072. https://doi.org/10.1002/med.21456
21 Klotz KN, Hessling J, Hegler J, Owman C, Kull B, Fredholm BB, Lohse MJ. Comparative pharmacology of human adenosine receptor subtypes - characterization of stably transfected receptors in CHO cells. Naunyn Schmiedebergs Arch Pharmacol. 1998; 357(1):1-9.
22 Ren T. Tian T, Feng X, Ye S, Wang H, Wu W, Qiu Y, Yu C, He Y, Zeng J, Cen J, Zhoub Y. An adenosine A3 receptor agonist inhibits DSS-induced colitis in mice through modulation of the NF-κB signaling pathway. Sci Rep. 2015; 5:9047-9054.
http://dx.doi.org/10.1038/srep09047
23 Ren W, Yin J, Wu M, Liu G, Yang G, Xion Y, Su D, Wu L, Li T, Chen S, Duan J, Yin Y, Wu G. Serum amino acids profile and the beneficial effects of L-arginine or L-glutamine supplementation in dextran sulfate sodium colitis. PLoS One 2014; 9, e88335
https://doi.org/10.1371/journal.pone.0088335
24 Burnstock G, Jacobson KA, Christofi FL. Purinergic drug targets for gastrointestinal
disorders. Curr Opin Pharmacol. 2017; 37:131-141.
https://doi.org/10.1016/j.coph.2017.10.011
25 Bhave S, Gade A, Kang M, Hauser KF, Dewey WL, Akbarali HI,. Connexin–purinergic signaling in enteric glia mediates the prolonged effect of morphine on constipation. FASEB J. 2017; 31 (6): 2649-2660. https://doi.org/10.1096/fj.201601068R
26 Longhi MS, Moss A, Jiang ZG, Robson SC. Purinergic signaling during intestinal inflammation. J Mol Med. 2017; 95(9): 915-925. https://doi.org/10.1007/s00109-017-1545-1
27 Amenta F, Buccioni M, Dal Ben D, Lambertucci C, Martí Navia A, Ngouadjeu Ngnintedemb MA, Ricciutelli M, Spinaci A., Volpini R, Marucci G. Ex-vivo absorption study of lysine R-lipoate salt, a new pharmaceutical form of R-ALA. Eur J Pharm Sci. 2018; 118:200–207. https://doi.org/10.1016/j.ejps.2018.03.025
28 Volpini R, Buccioni M, Dal Ben D, Lambertucci C, Lammi C, Marucci G, Ramadori AT, Klotz, KN, Cristalli G. Synthesis and biological evaluation of 2-alkynyl-N6-methyl- 5′-N-methylcarboxamidoadenosine derivatives as potent and highly selective agonists for the human adenosine A3 receptor. J Med Chem. 2009; 52(23):7897-7900.
https://doi.org/10.1021/jm900754g
29 Dal Ben D, Buccioni M, Lambertucci C, Marucci G, Thomas A, Volpini R, Cristalli G. Molecular modeling study on potent and selective adenosine A3 receptor agonists. Bioorg Med Chem. 2010; 18 (22):7923-7930. https://doi.org/10.1016/j.bmc.2010.09.038
30 Fang H, Pajski LM, Ross AE, Venton BJ. Quantitation of dopamine, serotonin and adenosine content in a tissue punch from a brain slice using capillary electrophoresis with fast-scan cyclic voltammetry detection. Anal Methods. 2013; 5(11):2704–2711.
31 Falsini M, Squarcialupi L, Catarzi D, Varano F, Betti M, Dal Ben D, Marucci G, Buccioni M, Volpini R, De Vita T, Cavalli A, Colotta V. The 1,2,4-Triazolo[4,3-a]pyrazin-3-one as a Versatile Scaffold for the Design of Potent Adenosine Human Receptor Antagonists. Structural Investigations to Target the A2A Receptor Subtype. J Med Chem. 2017; 60(3):5772-5790. https://doi.org/10.1021/acs.jmedchem.7b00457
32 Lassoued MA, Khemissb F, Sfar S. Comparative study of two in vitro methods for assessing drug absorption: Sartorius SM 16750 apparatus versus everted gut sac. J Pharm Pharmaceut Sci. 2011; 14(1): 117–127. https://doi.org/10.18433/J3GC7R
33 Nellans HN. Intestinal calcium absorption. Interplay of paracellular and cellular pathways. Miner Electrolyte Metab. 1990; 16(2-3):101-108. https://doi.org/10.3748/wjg.v21.i23.7142
34 Lennernas H. Does fluid flow across the intestinal mucosa affect quantitative oral drug absorption? Is it time for a reevaluation? Pharm Res. 1995; 12(11):1573-1582.
https://doi.org/10.1023/A:1016220428705
35 Pires DE, Blundell TL, Ascher DB. pkCSM:Predicting Small-Molecule Pharmacokinetic and Toxicity Properties Using Graph-Based Signatures. J Med Chem. 2015; 58(9):4066-72.
https://doi.org/10.1021/acs.jmedchem.5b00104
36 Gurunath S, Nanjwade BK, Patila PA. Enhanced solubility and intestinal absorption of candesartan cilexetil solid dispersions using everted rat intestinal sacs. Saudi Pharm J. 2014; 22(3):246–257. https://doi.org/10.1016/j.jsps.2013.03.006
37 Behrens I, Stenberg P, Artursson P, Kissel T. Transport of lipophilic drug molecules in a new mucus-secreting cell culture model based on HT29-MTX cells. Pharmaceutical research. 2001; 18(8):1138–1145. https://doi.org/10.1023/A:1010974909998
38 Volpe DA. Application of Method Suitability for Drug Permeability Classification. AAPS J. 2010; 12(4):670–678. https://doi.org/10.1208/s12248-010-9227-8
39 Back DJ, Rogers SM. Review: first‐pass metabolism by the gastrointestinal mucosa AP&T 1987; 1:5 https://doi.org/10.1111/j.1365-2036.1987.tb00634.x
40 Fagerholm U. Prediction of human pharmacokinetics--gut-wall metabolism. J Pharm Pharmacol. 2007 Oct;59(10):1335-43. https://doi.org/10.1211/jpp.59.10.0002
41 Darwich AS, Neuhoff S, Jamei M, Rostami-Hodjegan A. Interplay of metabolism and transport in determining oral drug absorption and gut wall metabolism: a simulation assessment using the "Advanced Dissolution, Absorption, Metabolism (ADAM)" model. Curr Drug Metab. 2010;11(9):716-29. https://doi.org/10.2174/138920010794328913
42 Antonioli L, Fornai M, Colucci R, Tuccori M, Blandizzi C. A holistic view of adenosine in the control of intestinal neuromuscular functions: the enteric ‘purinome’ concept. Br. J. Pharmacol. 2011, 164(6):1577–1579. https://doi.org/10.1111/j.1476-5381.2011.01529.x
43 Vieira C, Ferreirinha F, Silva I, Duarte-Araújo M, Correia-de-Sá P. Localization and function of adenosine receptor subtypes at the longitudinal muscle--myenteric plexus of the rat ileum. Neurochem Int. 2011; 59(7):1043-55. https://doi.org/1043-55. 10.1016/j.neuint.2011.08.016
44 Christofi FL. Purinergic receptors and gastrointestinal secretomotor function. Purinergic Signal. 2008; 4(3):213-236. https://doi.org/10.1007/s11302-008-9104-4