RESEARCH
Normoalbuminuric kidney impairment
in patients with T1DM: insights from annals
initiative
Olga Lamacchia
1*, Francesca Viazzi
2, Paola Fioretto
3, Antonio Mirijello
4, Carlo Giorda
5, Antonio Ceriello
6,7,
Giuseppina Russo
8, Pietro Guida
9, Roberto Pontremoli
2and Salvatore De Cosmo
4*Abstract
Background: We described, in a large sample of patients with type 1 diabetes mellitus (T1DM) and GFR ≤ 60 mL/
min/1.73 m2 (with or without albuminuria), the differences in the clinical features associated with the two different chronic kidney disease phenotypes and we investigated, in a subset of patients, the modulating role of albuminuria on kidney disease progression.
Methods: Clinical data of 1395 patients with T1DM were extracted from electronic medical records.
Results: Albuminuria was detected in 676 (48.5%) patients, with the remaining 719 (51.5%) patients having
nor-moalbuminuric renal impairment. Those with albuminuria showed an evident worse cardiovascular risk profile as compared to patients with normoalbuminuria. A subgroup of 582 patients was followed up over a 4-year period. One hundred and twenty five patients (21.5%) showed a loss of eGFR > 30%. The proportion of patients reaching the renal outcome was significantly higher among those with baseline albuminuria as compared to patients with normoal-buminuria (P < 0.0001). At the multivariate logistic analysis microalnormoal-buminuria, macroalnormoal-buminuria and proliferative retinopathy were the only parameters independently associated to eGFR reduction.
Conclusions: The proportion of T1DM patients with normoalbuminuria renal impairment is high (about 50%). These
patients have a slower eGFR decline as compared to that observed in patients with albuminuria renal impairment.
Keywords: Albuminuria, Chronic kidney disease, Type 1 diabetes mellitus, Cardiovascular disease
© The Author(s) 2018. This article is distributed under the terms of the Creative Commons Attribution 4.0 International License (http://creat iveco mmons .org/licen ses/by/4.0/), which permits unrestricted use, distribution, and reproduction in any medium, provided you give appropriate credit to the original author(s) and the source, provide a link to the Creative Commons license, and indicate if changes were made. The Creative Commons Public Domain Dedication waiver (http://creat iveco mmons .org/ publi cdoma in/zero/1.0/) applies to the data made available in this article, unless otherwise stated.
Background
Diabetic kidney disease (DKD), an important complica-tion of diabetes mellitus, is the leading cause of kidney failure in the western word and it is also associated with increased cardiovascular morbidity and mortality. Albu-minuria and reduced glomerular filtration rate (GFR) are the key features of DKD. Traditionally, the earliest clinical manifestation of DKD has been the detection of persistent microalbuminuria [1]. Early studies suggested that GFR starts to decrease only when albuminuria
reaches the macroalbuminuric range [2]. This conven-tional paradigm of kidney disease in people with diabe-tes has been recently challenged. Changes in albuminuria and GFR are being increasingly recognized as comple-mentary rather than obligatory manifestations of DKD. Furthermore, albuminuria and loss of GFR seem to be associated with distinct clusters of specific risk factors. Several studies investigating the prevalence of both nor-moalbuminuric and albuminuric chronic kidney disease (CKD) have been performed in type 2 diabetes mellitus (T2DM) [3–7]. Limited information is available concern-ing heterogeneity of renal features in patients with type 1 diabetes mellitus (T1DM) and this is largely result-ing from studies conducted in a few cohorts of patients with GFR ≤ 60 mL/min/1.73 m2 [8–10]. Recently, Penno
et al. [10] have recently assessed the prevalence and
Open Access
*Correspondence: [email protected]; [email protected]
1 Unit of Endocrinology and Metabolic Diseases, Department of Surgical
and Medical Sciences, University of Foggia, Foggia, Italy
4 Department of Medical Sciences, Scientific Institute “Casa Sollievo della
Sofferenza”, San Giovanni Rotondo, FG, Italy
correlates of different CKD phenotypes in a cohort of 777 patients with T1DM (of which 29 with eGFR < 60 mL/ min/1.73 m2). They found that normoalbuminuric CKD
phenotype is present in a significant proportion of the T1DM, a finding supporting two distinct pathways, with and without albuminuria, to advanced kidney disease.
We therefore analyzed a large sample of patients with T1DM and GFR ≤ 60 mL/min/1.73 m2 (with or without
albuminuria) attending diabetes clinics and representa-tive of current clinical practice for diabetes care in Italy to describe the differences in the clinical features asso-ciated with the two different CKD phenotypes (i.e. with and without albuminuria) and to investigate, in a subset of patients, the modulating role of albuminuria on kidney disease progression.
Methods
In this report, we show the results of an analysis per-formed using the data set of the electronic medical records collected on a large sample of patients with a diagnosis of T1DM (according to American Diabetes Association 2003 criteria), who attended 295 diabetes clinics in Italy between 1 January 2004, and 31 Decem-ber 2011. Approximately, one-third of all the Italian diabetes clinics were involved in this study, evenly dis-tributed throughout the country and therefore indicative of the clinical practice. For the purpose of the analysis, we considered only patients who were aged 18 years or older, with at least 1 outpatient measurement of serum creatinine and albuminuria and with a GFR ≤ 60 mL/ min/1.73 m2. A total of 1395 patients (654 males and 741
females) constituted the study population (Additional file 1: Fig. S1).
The database derives from the Italian Association of Clinical Diabetologists (Associazione Medici Diabe-tologi—AMD) initiative designed to monitor diabetes care and quality of care as previously reported [11–13]. All participating clinics used an electronic clinical record system, and a software specifically developed to extract information. Data from all participating clinics were col-lected anonymously and were centrally analyzed [11–13]. The results were internally approved by the AMD Annals scientific committee. The core data-set included meas-ures and monitoring of glycated hemoglobin (HbA1c), total cholesterol, low-density lipoprotein cholesterol (LDL-c) or high density lipoprotein cholesterol (HDL-c), and triglycerides. The use of specific classes of drugs was also evaluated. Kidney function was assessed by serum creatinine, measured by modified Jaffè method, and uri-nary albumin excretion measurements (UAE). Glomeru-lar filtration rate (GFR) was estimated for each patient by using the CKD epidemiology collaboration formula derived by serum creatinine values [14]. Increased UAE
was diagnosed as (1) microalbuminuria if urinary albu-min concentration was > 30 and ≤ 300 mg/L, or if UAE rate was > 20 and ≤ 200 μg/min, or if urinary albumin-to-creatinine ratio was > 2.5 mg/mmol in men and > 3.5 mg/ mmol in women and ≤ 30 mg/mmol in both gender and (2) macroalbuminuria if urinary albumin concentration was > 300 mg/L, or if UAE rate was > 200 μg/min, or if albumin-to-creatinine ratio was > 30 mg/mmol in both gender. Urine albumin excretion was evaluated by means of urine albumin concentration in the majority of study patients 1020 (i.e. 73%) and by albumin to creatinine ratio (spot morning samples) in a smaller number of patients 344 (25%). Timed urine collection (24 h) was used in a minority of patients 31 (2%).
Albuminuria indicates patients with either microal-buminuria or macroalmicroal-buminuria. DKD was defined as diabetes with albuminuria and/or low GFR (≤ 60 mL/ min/1.73 m2). Information on the presence of diabetic
retinopathy, background (BR), or proliferative (PR), was also available. At each participating center, all patients underwent physical examination and blood pressure (BP) measurements according to a standardized protocol. BP was measured with the patient in the sitting position after a 5-min rest, with a mercury sphygmomanometer.
For the cross-sectional analyses, we extracted data from the most recent patients’ visit complete of eGFR measurement and albuminuria evaluation. To obtain the 4-year evaluations, we selected for each patient the last 4-year period that included eGFR and albuminuria status at baseline and a re-evaluation of eGFR 4 years later. As a consequence of selection criteria, the baseline included a visit up to the year 2008 and the follow-up up to 2011 (range of visits 48 ± 6 months selecting that closest to 48 month). For patients without a re-evaluation at 4-year, the last visit up to the year 2008 was considered for the cross-sectional study (the same period of baseline visit for the longitudinal population).
Statistical analysis
Data are given as mean value ± standard deviation or median (interquartile range), and categorical variables are described as frequencies and percentages. Logis-tic regression analysis was used to evaluate variables associated to albuminuria. Predictors of eGFR reduc-tion > 30% [15] than baseline were evaluated with a logistic model adjusting for baseline eGFR. A multi-variate model was built selecting variables associated to the outcome with a P value < 0.05 adjusting for age and gender. Multivariate analysis was performed as complete-case analysis including patients with all data available. The odds ratios (ORs) were used to estimate the degree of association with outcome. Assuming linearity of eGFR reduction over time, its slope was
taken as a measure of disease progression rate. For each patients, we calculated the regression coefficient (slope) of linear regression between eGFR value and the exact time in years from the first evaluation includ-ing all measurements from baseline to the 4-year visit. The analyses were made using STATA software, Version 14 (StataCorp, College Station, TX). P values of < 0.05 were considered statistically significant.
Results
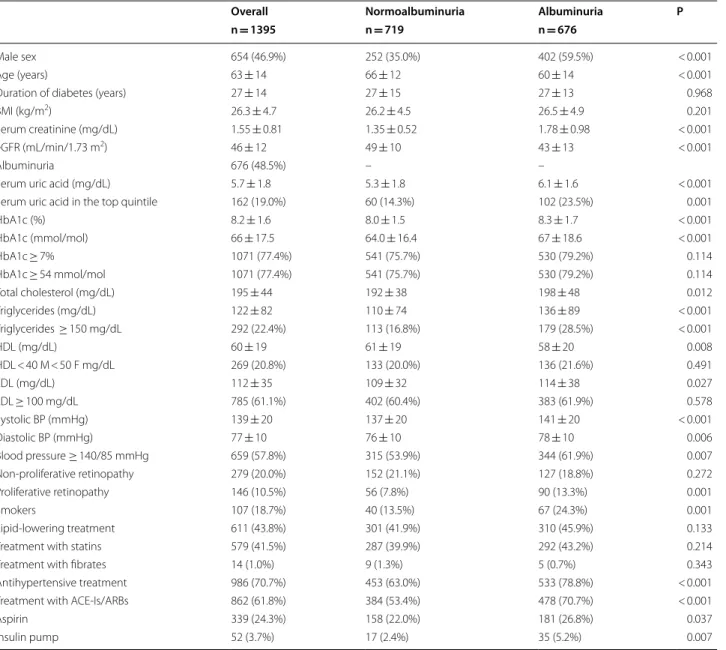
The main clinical features of the study population (n = 1395) at baseline, as a whole and grouped by the presence/absence of albuminuria, are summa-rized in Table 1. Overall, the mean age of patients was 63 ± 14 years, 46.9% were male and mean duration of diabetes was 27 ± 14 years. Taking into account the presence of CKD, glycemic and blood pressure controls were fairly good. A total of 986 (70.7%) and 611 (43.8%)
Table 1 Baseline clinical characteristics of 1395 T1DM patients with low eGFR as whole and after stratification by the presence of albuminuria
Mean ± SD or absolute frequency (percentage). Patients’ baseline missing data: duration of diabetes 72 (5.2%), BMI 212 (15.2%), serum uric acid 542 (38.9%), HbA1c 11 (0.8%), total cholesterol 73 (5.2%), triglycerides 92 (6.6%), HDL 99 (7.1%), LDL 110 (7.9%), blood pressure 255 (18.3%), smokers 823 (59.0%). Serum uric acid in the top gender-specific quintile: > 6.6 mg/dL in females and > 7.4 mg/dL in males
eGFR estimated glomerular filtration rate, BMI body mass index, HbA1c glycated haemoglobin, HDL high-density lipoprotein cholesterol, LDL low-density lipoprotein cholesterol, ACE-Is angiotensin converting enzyme-inhibitors, ARBs angiotensin II receptor antagonists
Overall Normoalbuminuria Albuminuria P
n = 1395 n = 719 n = 676
Male sex 654 (46.9%) 252 (35.0%) 402 (59.5%) < 0.001
Age (years) 63 ± 14 66 ± 12 60 ± 14 < 0.001
Duration of diabetes (years) 27 ± 14 27 ± 15 27 ± 13 0.968
BMI (kg/m2) 26.3 ± 4.7 26.2 ± 4.5 26.5 ± 4.9 0.201
Serum creatinine (mg/dL) 1.55 ± 0.81 1.35 ± 0.52 1.78 ± 0.98 < 0.001
eGFR (mL/min/1.73 m2) 46 ± 12 49 ± 10 43 ± 13 < 0.001
Albuminuria 676 (48.5%) – –
Serum uric acid (mg/dL) 5.7 ± 1.8 5.3 ± 1.8 6.1 ± 1.6 < 0.001
Serum uric acid in the top quintile 162 (19.0%) 60 (14.3%) 102 (23.5%) 0.001
HbA1c (%) 8.2 ± 1.6 8.0 ± 1.5 8.3 ± 1.7 < 0.001 HbA1c (mmol/mol) 66 ± 17.5 64.0 ± 16.4 67 ± 18.6 < 0.001 HbA1c ≥ 7% 1071 (77.4%) 541 (75.7%) 530 (79.2%) 0.114 HbA1c ≥ 54 mmol/mol 1071 (77.4%) 541 (75.7%) 530 (79.2%) 0.114 Total cholesterol (mg/dL) 195 ± 44 192 ± 38 198 ± 48 0.012 Triglycerides (mg/dL) 122 ± 82 110 ± 74 136 ± 89 < 0.001 Triglycerides ≥ 150 mg/dL 292 (22.4%) 113 (16.8%) 179 (28.5%) < 0.001 HDL (mg/dL) 60 ± 19 61 ± 19 58 ± 20 0.008 HDL < 40 M < 50 F mg/dL 269 (20.8%) 133 (20.0%) 136 (21.6%) 0.491 LDL (mg/dL) 112 ± 35 109 ± 32 114 ± 38 0.027 LDL ≥ 100 mg/dL 785 (61.1%) 402 (60.4%) 383 (61.9%) 0.578 Systolic BP (mmHg) 139 ± 20 137 ± 20 141 ± 20 < 0.001 Diastolic BP (mmHg) 77 ± 10 76 ± 10 78 ± 10 0.006 Blood pressure ≥ 140/85 mmHg 659 (57.8%) 315 (53.9%) 344 (61.9%) 0.007 Non-proliferative retinopathy 279 (20.0%) 152 (21.1%) 127 (18.8%) 0.272 Proliferative retinopathy 146 (10.5%) 56 (7.8%) 90 (13.3%) 0.001 Smokers 107 (18.7%) 40 (13.5%) 67 (24.3%) 0.001 Lipid-lowering treatment 611 (43.8%) 301 (41.9%) 310 (45.9%) 0.133
Treatment with statins 579 (41.5%) 287 (39.9%) 292 (43.2%) 0.214
Treatment with fibrates 14 (1.0%) 9 (1.3%) 5 (0.7%) 0.343
Antihypertensive treatment 986 (70.7%) 453 (63.0%) 533 (78.8%) < 0.001 Treatment with ACE-Is/ARBs 862 (61.8%) 384 (53.4%) 478 (70.7%) < 0.001
Aspirin 339 (24.3%) 158 (22.0%) 181 (26.8%) 0.037
patients were on antihypertensive and on lipid-lowering treatment, respectively. In our sample, albuminuria was detected in 676 (48.5%) patients, with the remaining 719 (51.5%) patients having normoalbuminuric renal impair-ment (Table 1). Those with albuminuria were more likely to be males and, on average, younger respect to patients without albuminuria. Duration of disease was compa-rable between patients with or without albuminuria. Albuminuria was also associated with a worse glycemic control and higher levels of serum uric acid. Furthermore, albuminuria was associated with a more atherogenic lipid profile (i.e. higher LDL cholesterol and triglycerides lev-els and lower HDL-c) and higher values of systolic BP (SBP) and diastolic BP (DBP) despite a greater prevalence of antidyslipidemic and antihypertensive treatment.
As expected, individuals with albuminuria were more frequently treated with angiotensin converting enzyme inhibitors (ACE-Is) or angiotensin II receptor antago-nists (ARBs) as compared to those without albuminuria. Moreover, they were more likely to be smokers and to show proliferative retinopathy.
We have also compared clinical features of patients with micro or macroalbuminuria. Those with macroal-buminuria showed an evident worse cardiovascular (CV) risk profile as compared to patients with microalbuminu-ria (Additional file 2: Table S1).
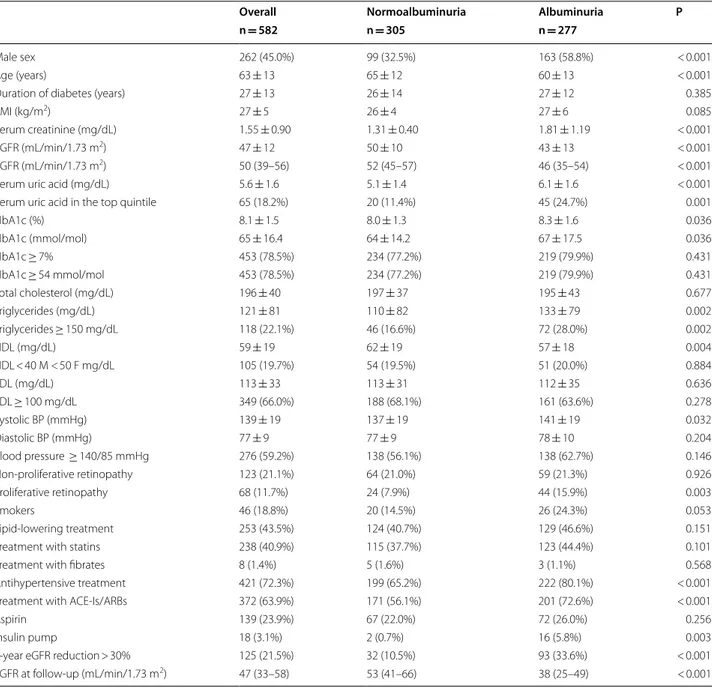
To investigate the differences in the kidney dysfunc-tion progression between patients with low eGFR and normoalbuminuria or albuminuria, a subgroup of 582 patients, whose clinical features are showed in Table 2
and Additional file 2: Table S2, was followed up over a 4-year period. One hundred and twenty five patients (21.5%) showed a loss of eGFR > 30%. The proportion of patients reaching the renal outcome was significantly higher among those with baseline albuminuria as com-pared to patients with normoalbuminuria (33.6% vs 10.5%, albuminuria vs normoalbuminuria, respectively P < 0.0001). The slope of GFR decline was of − 0.5 (− 2.2; 1.5) mL/min/1.73 m2/year for the whole sample. Patients
with normoalbuminuria showed a stable kidney func-tion along the follow-up period [i.e. + 0.4 (− 1.2; 3.2) mL/ min/1.73 m2/year] while those with albuminuria had a
significant progression of kidney disease [− 1.3 (− 3.2; 0.3) mL/min/1.73 m2/year]. The main baseline clinical
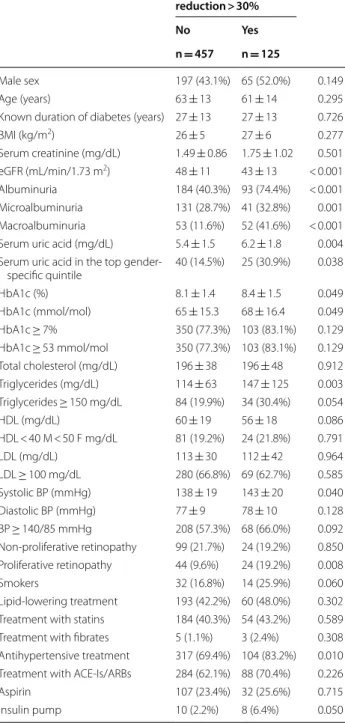
features of the above study population grouped by renal outcome at 4-year follow-up are summarized in Table 3. Patients who went on to develop renal outcome showed a poor glycemic control and higher levels of triglycerides and serum uric acid as compared to patients who did not. Furthermore, they had higher levels of SBP despite a greater prevalence of antihypertensive treatment.
As expected, they had also a lower eGFR at baseline (43 vs. 48 mL/ min/1.73 m2, P < 0.001).
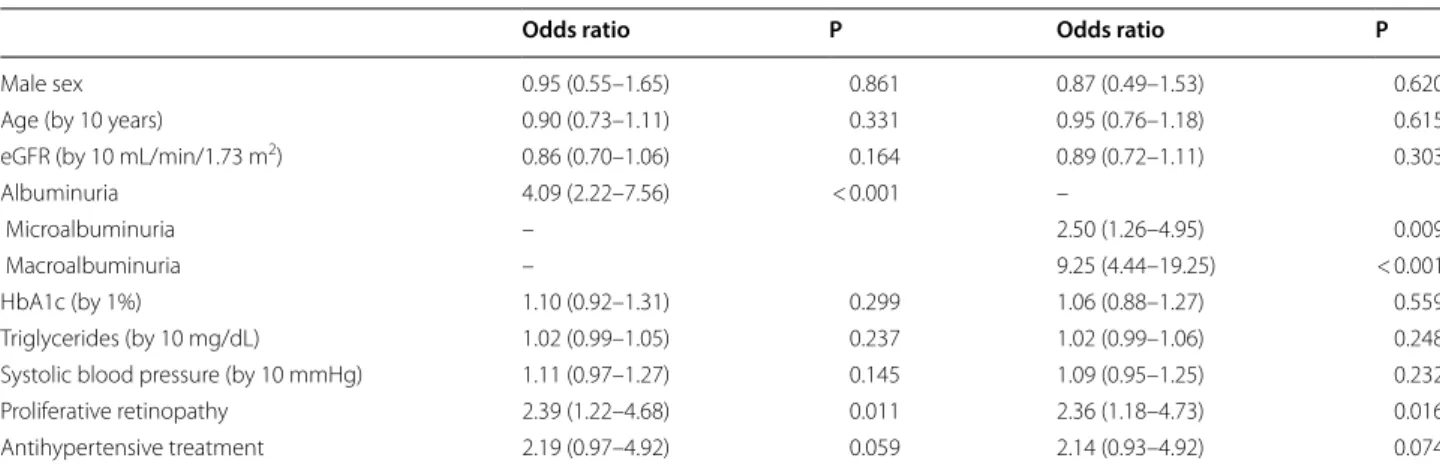
Almost 2/3 of patients who went on to develop eGFR reduction > 30% showed albuminuria at baseline and 19% showed proliferative retinopathy. At the multivariate logistic analysis microalbuminuria, macroalbuminuria and proliferative retinopathy were the only parameters independently associated to eGFR reduction (Table 4). Discussion
In a large cohort representative of real life clinical prac-tice in Italy, we found that up to 50% of patients with T1DM and CKD show a non albuminuric phenotype. In addition, we demonstrate that the loss of GFR is much greater in T1DM albuminuric CKD as compared with T1DM normoalbuminuric CKD patients.
The prevalence of normoalbuminuric CKD in our population was higher than that in the Finnish Dia-betic Nephropathy Study [16] where, of the 502 patients with CKD, 78 (16%) did not have albuminuria. This dif-ference could likely be accounted for by difdif-ferences in patients’ clinical features and in setting were the patients have been studied. A cross-sectional survey of the UK National Diabetes Audit [9] investigating a large cohort of T1DM patients has recently reported the presence of normoalbuminuria in 54.4% of individuals stage ≥ 3 CKD, a proportion similar to our finding. In a very recent retrospective study by Penno et al. [10], the authors found that, among 29 patients with eGFR < 60 mL/min/1.73 m2,
17 (58.6%) had normoalbuminuria. The authors couldn’t find any significant differences for most of clinical varia-bles investigated, very likely because of the small number of patients evaluated. Furthermore, the study conducted by Penno et al. was a cross-sectional, single-centre study while in our study the patients were recruited from more than 200 diabetes clinics in Italy distributed throughout the country and therefore indicative of the clinical prac-tice in the real life condition. The pathophysiology and clinical significance of low GFR levels in patients without albuminuria is to this day unclear. While in patients with T2DM the occurrence of non albuminuric renal impair-ment has been related to pathogenetic mechanisms such as premature kidney senescence, interstitial fibrosis, ischaemic vascular disease or cholesterol microemboli [3] which may differ from those involved in the develop-ment of traditional diabetic glomerulosclerosis, it is cur-rently uncertain whether a similar pathogenetic scenario also applies to T1DM patients with non albuminuric renal dysfunction. Glomerular structural changes typi-cal of diabetic nephropathy, have been reported in T1DM
Table 2 Baseline clinical characteristics of 582 type 1 diabetes mellitus patients with low eGFR and with 4 year follow-up, overall and on the basis of albuminuria
Mean ± SD, median (interquartile range) or absolute frequency (percentage). Patients’ baseline missing data: duration of diabetes 18 (3.1%), BMI 108 (18.6%), serum uric acid 225 (38.7%), HbA1c 5 (0.9%), total cholesterol 41 (7.0%), triglycerides 48 (8.2%), HDL 50 (8.6%), LDL 53 (9.1%), blood pressure 116 (19.9%), smokers 337 (57.9%)
eGFR estimated glomerular filtration rate, BMI body mass index, HbA1c glycated haemoglobin, HDL high-density lipoprotein cholesterol, LDL low-density lipoprotein cholesterol, ACE-Is angiotensin converting enzyme-inhibitors, ARBs angiotensin II receptor antagonists
Overall Normoalbuminuria Albuminuria P
n = 582 n = 305 n = 277
Male sex 262 (45.0%) 99 (32.5%) 163 (58.8%) < 0.001
Age (years) 63 ± 13 65 ± 12 60 ± 13 < 0.001
Duration of diabetes (years) 27 ± 13 26 ± 14 27 ± 12 0.385
BMI (kg/m2) 27 ± 5 26 ± 4 27 ± 6 0.085
Serum creatinine (mg/dL) 1.55 ± 0.90 1.31 ± 0.40 1.81 ± 1.19 < 0.001
eGFR (mL/min/1.73 m2) 47 ± 12 50 ± 10 43 ± 13 < 0.001
eGFR (mL/min/1.73 m2) 50 (39–56) 52 (45–57) 46 (35–54) < 0.001
Serum uric acid (mg/dL) 5.6 ± 1.6 5.1 ± 1.4 6.1 ± 1.6 < 0.001
Serum uric acid in the top quintile 65 (18.2%) 20 (11.4%) 45 (24.7%) 0.001
HbA1c (%) 8.1 ± 1.5 8.0 ± 1.3 8.3 ± 1.6 0.036 HbA1c (mmol/mol) 65 ± 16.4 64 ± 14.2 67 ± 17.5 0.036 HbA1c ≥ 7% 453 (78.5%) 234 (77.2%) 219 (79.9%) 0.431 HbA1c ≥ 54 mmol/mol 453 (78.5%) 234 (77.2%) 219 (79.9%) 0.431 Total cholesterol (mg/dL) 196 ± 40 197 ± 37 195 ± 43 0.677 Triglycerides (mg/dL) 121 ± 81 110 ± 82 133 ± 79 0.002 Triglycerides ≥ 150 mg/dL 118 (22.1%) 46 (16.6%) 72 (28.0%) 0.002 HDL (mg/dL) 59 ± 19 62 ± 19 57 ± 18 0.004 HDL < 40 M < 50 F mg/dL 105 (19.7%) 54 (19.5%) 51 (20.0%) 0.884 LDL (mg/dL) 113 ± 33 113 ± 31 112 ± 35 0.636 LDL ≥ 100 mg/dL 349 (66.0%) 188 (68.1%) 161 (63.6%) 0.278 Systolic BP (mmHg) 139 ± 19 137 ± 19 141 ± 19 0.032 Diastolic BP (mmHg) 77 ± 9 77 ± 9 78 ± 10 0.204 Blood pressure ≥ 140/85 mmHg 276 (59.2%) 138 (56.1%) 138 (62.7%) 0.146 Non-proliferative retinopathy 123 (21.1%) 64 (21.0%) 59 (21.3%) 0.926 Proliferative retinopathy 68 (11.7%) 24 (7.9%) 44 (15.9%) 0.003 Smokers 46 (18.8%) 20 (14.5%) 26 (24.3%) 0.053 Lipid-lowering treatment 253 (43.5%) 124 (40.7%) 129 (46.6%) 0.151
Treatment with statins 238 (40.9%) 115 (37.7%) 123 (44.4%) 0.101
Treatment with fibrates 8 (1.4%) 5 (1.6%) 3 (1.1%) 0.568
Antihypertensive treatment 421 (72.3%) 199 (65.2%) 222 (80.1%) < 0.001 Treatment with ACE-Is/ARBs 372 (63.9%) 171 (56.1%) 201 (72.6%) < 0.001
Aspirin 139 (23.9%) 67 (22.0%) 72 (26.0%) 0.256
Insulin pump 18 (3.1%) 2 (0.7%) 16 (5.8%) 0.003
4-year eGFR reduction > 30% 125 (21.5%) 32 (10.5%) 93 (33.6%) < 0.001 eGFR at follow-up (mL/min/1.73 m2) 47 (33–58) 53 (41–66) 38 (25–49) < 0.001
patients with normoalbuminuria and reduced GFR [17]. In these patients, a thickening of the glomerular basal membrane and a greater fractional volume of the glomer-ulus occupied by mesangium have been found as com-pared with those who had a normal GFR. Probably the expression of some proteins, such as nephrin, responsible of the integrity of the slit diaphragm, remains unchanged in patients with normoalbuminuric renal insufficiency [18].
When we focused on differences in the kidney dys-function progression we found that the loss of GFR was greater in albuminuric CKD patients as compared to normoalbuminuric CKD patients. Patients with nor-moalbuminuria showed a stable kidney function along the follow-up period while those with albuminuria had a significant progression of kidney disease. This finding is in line with the results of Holfiel et al. who described the accelerating effect of albuminuria in the loss of GFR in patients with T1DM and T2DM [19]. Normoalbu-minuric renal impairment is a widely described strong risk factor for cardiovascular mortality and morbidity in the general population and in patients with T2DM [20]. Data on this specific issue in patients with T1DM are lacking.
Our study has several limitations as well as strengths. First of all, laboratory variables were not centralized and this could have caused variability especially in the cre-atinine assay. However, most laboratories around the country currently use the modified Jaffè method, which has good reproducibility. In addition, we have classified our patients using only one measurement of albuminuria. This is in line with other studies [21, 22]. Pugliese et al. [21] have recently reported in a large cohort of subjects with T2DM participating in the renal insufficiency and cardiovascular events (RIACE) Italian Multicentre Study, that a single UAE value, thought to be encumbered with high intra-individual variability, is an accurate predic-tor of nephropathy stage for clinical and epidemiologi-cal purposes. On the other hand, the large number of patients studied and the consistent geographical distribu-tion of the recruiting centers are major strengths of the study, which gives missing information about this issue in Italy. Further limitations merit to be mentioned, i.e. lack of information on: (i) previous cardiovascular events, cancer, infection and hospitalization during the follow-up period, (ii) historical albuminuria data and (iii) dura-tion of smoking habit.
In conclusion, our study shows as the propor-tion of T1DM patients with normoalbuminuria renal impairment is high (about 50%). These patients have a slower eGFR decline as compared to that observed in patients with albuminuria renal impairment. Whether T1DM patients with albuminuric renal impairment
Table 3 Baseline clinical characteristics of 582 type 1 diabetes mellitus patients reaching the renal end-point (estimated Glomerular filtration rate reduction > 30%)
Mean ± SD or absolute frequency (percentage). Patients’ baseline missing data: duration of diabetes 18 (3.1%), BMI 108 (18.6%), serum uric acid 225 (38.7%), HbA1c 5 (0.9%), total cholesterol 41 (7.0%), triglycerides 48 (8.2%), HDL 50 (8.6%), LDL 53 (9.1%), blood pressure 116 (19.9%), smokers 337 (57.9%) eGFR estimated glomerular filtration rate, BMI body mass index, HbA1c glycated haemoglobin, HDL high-density lipoprotein cholesterol, LDL low-density lipoprotein cholesterol, ACE-Is angiotensin converting enzyme-inhibitors, ARBs angiotensin II receptor antagonists
The P value refers to the effect of each variable on 4-year eGFR reduction > 30% at logistic regression analysis adjusted for baseline eGFR
4-year eGFR reduction > 30% P No Yes n = 457 n = 125 Male sex 197 (43.1%) 65 (52.0%) 0.149 Age (years) 63 ± 13 61 ± 14 0.295
Known duration of diabetes (years) 27 ± 13 27 ± 13 0.726
BMI (kg/m2) 26 ± 5 27 ± 6 0.277 Serum creatinine (mg/dL) 1.49 ± 0.86 1.75 ± 1.02 0.501 eGFR (mL/min/1.73 m2) 48 ± 11 43 ± 13 < 0.001 Albuminuria 184 (40.3%) 93 (74.4%) < 0.001 Microalbuminuria 131 (28.7%) 41 (32.8%) 0.001 Macroalbuminuria 53 (11.6%) 52 (41.6%) < 0.001 Serum uric acid (mg/dL) 5.4 ± 1.5 6.2 ± 1.8 0.004 Serum uric acid in the top
gender-specific quintile 40 (14.5%) 25 (30.9%) 0.038 HbA1c (%) 8.1 ± 1.4 8.4 ± 1.5 0.049 HbA1c (mmol/mol) 65 ± 15.3 68 ± 16.4 0.049 HbA1c ≥ 7% 350 (77.3%) 103 (83.1%) 0.129 HbA1c ≥ 53 mmol/mol 350 (77.3%) 103 (83.1%) 0.129 Total cholesterol (mg/dL) 196 ± 38 196 ± 48 0.912 Triglycerides (mg/dL) 114 ± 63 147 ± 125 0.003 Triglycerides ≥ 150 mg/dL 84 (19.9%) 34 (30.4%) 0.054 HDL (mg/dL) 60 ± 19 56 ± 18 0.086 HDL < 40 M < 50 F mg/dL 81 (19.2%) 24 (21.8%) 0.791 LDL (mg/dL) 113 ± 30 112 ± 42 0.964 LDL ≥ 100 mg/dL 280 (66.8%) 69 (62.7%) 0.585 Systolic BP (mmHg) 138 ± 19 143 ± 20 0.040 Diastolic BP (mmHg) 77 ± 9 78 ± 10 0.128 BP ≥ 140/85 mmHg 208 (57.3%) 68 (66.0%) 0.092 Non-proliferative retinopathy 99 (21.7%) 24 (19.2%) 0.850 Proliferative retinopathy 44 (9.6%) 24 (19.2%) 0.008 Smokers 32 (16.8%) 14 (25.9%) 0.060 Lipid-lowering treatment 193 (42.2%) 60 (48.0%) 0.302 Treatment with statins 184 (40.3%) 54 (43.2%) 0.589 Treatment with fibrates 5 (1.1%) 3 (2.4%) 0.308 Antihypertensive treatment 317 (69.4%) 104 (83.2%) 0.010 Treatment with ACE-Is/ARBs 284 (62.1%) 88 (70.4%) 0.226 Aspirin 107 (23.4%) 32 (25.6%) 0.715 Insulin pump 10 (2.2%) 8 (6.4%) 0.050
as compared to patients with normoalbuminuric renal impairment need a more intensive renal protec-tion treatment will be clarified by further intervenprotec-tion studies.
Additional files
Additional file 1: Fig. S1. Flow-chart of population.
Additional file 2: Table S1. Baseline clinical characteristics of 676 patients with T1DM with low eGFR on the basis of micro- and macro-albuminuria.
Table S2. Baseline clinical characteristics of 277 patients with DMT1 with
low eGFR on the basis of micro- and macro-albuminuria.
Abbreviations
DKD: diabetic kidney disease; GFR: glomerular filtration rate; T2DM: type 2 diabetes mellitus; T1DM: type 1 diabetes mellitus; CKD: chronic kidney disease; HbA1c: glycated hemoglobin; LDL-c: low-density lipoprotein cholesterol; HDL-c: high density lipoprotein cholesterol; UAE: urinary albumin excretion measurements; BR: background retinopathy; PR: proliferative retinopathy; BP: blood pressure; ORs: odds ratios; ACE-Is: angiotensin converting enzyme inhibitors; ARBs: angiotensin II receptor antagonists; CV: cardiovascular; IDMS: isotope dilution mass spectrometry.
Authors’ contributions
OL, FV, RP, SDC designed research; OL, RP, SDC performed research; OL, PG, RP, SDC analyzed data; OL, RP, SDC wrote the paper; OL, FV. PF, AM, CG, AC, GR, PG, RP, SDC reviewed the manuscript. All authors read and approved the final manuscript.
Author details
1 Unit of Endocrinology and Metabolic Diseases, Department of
Surgi-cal and MediSurgi-cal Sciences, University of Foggia, Foggia, Italy. 2 Department
of Internal Medicine, University of Genoa and Policlinico San Martino, Genoa, Italy. 3 Department of Medicine, University of Padova, Padova, Italy. 4
Depart-ment of Medical Sciences, Scientific Institute “Casa Sollievo della Sofferenza”, San Giovanni Rotondo, FG, Italy. 5 Diabetes and Metabolism Unit ASL Turin 5,
Chieri, Italy. 6 Institut d’Investigacions Biomèdiques August Pii Sunyer (IDIBAPS)
and Centro de Investigación Biomédicaen Red de Diabetes y Enfermedades Metabólicas Asociadas (CIBERDEM), Barcelona, Spain. 7 U.O. Diabetologia e
Malattie Metaboliche, Multimedica IRCCS, Sesto San Giovanni, Milan, Italy.
8 Department of Clinical and Experimental Medicine, University of Messina,
Messina, Italy. 9 Associazione Medici Diabetologi, Rome, Italy.
Acknowledgements
We thank the AMD-Annals Study Group.
Competing interests
The authors declare that they have no competing interests.
Availability of data and materials
All data generated or analysed during this study are included in this published article and its additional files.
Consent for publication
Not applicable.
Ethics approval and consent to participate
The study was approved by AMD Annals scientific committee.
Funding
Not applicable.
Publisher’s Note
Springer Nature remains neutral with regard to jurisdictional claims in pub-lished maps and institutional affiliations.
Received: 17 February 2018 Accepted: 25 July 2018
References
1. American Diabetes Association. Standards of medical care in diabe-tes—2009. Diab Care. 2009;32(Suppl 1):S13–61.
2. Mogensen CE. Microalbuminuria, blood pressure and diabetic renal disease: origin and development of ideas. Diabetologia. 1999;42:263–85. 3. MacIsaac R, Tsalamandris C, Panagiotopoulos S, Smith TJ, McNeil KJ,
Jerums G. Nonalbuminuric renal insufficiency in type 2 diabetes. Diab Care. 2004;27:195–200.
4. Kramer HJ, Nguyen QD, Curhan G, Hsu CY. Renal insufficiency in the absence of albuminuria and retinopathy among adults with type 2 diabetes mellitus. JAMA. 2003;289:3273–7.
5. Thomas MC, Macisaac RJ, Jerums G, Weekes A, Moran J, Shaw JE, Atkins RC. Nonalbuminuric renal impairment in type 2 diabetic patients and in the general population (national evaluation of the frequency of renal
Table 4 Baseline predictors at multivariate analysis for 4-year eGFR reduction > 30%
Complete case analysis performed by using a logistic regression model including 427 patients (91 with eGFR reduction > 30%) for which all data were observed eGFR estimated glomerular filtration rate, HbA1c glycated haemoglobin
Odds ratio P Odds ratio P
Male sex 0.95 (0.55–1.65) 0.861 0.87 (0.49–1.53) 0.620
Age (by 10 years) 0.90 (0.73–1.11) 0.331 0.95 (0.76–1.18) 0.615
eGFR (by 10 mL/min/1.73 m2) 0.86 (0.70–1.06) 0.164 0.89 (0.72–1.11) 0.303
Albuminuria 4.09 (2.22–7.56) < 0.001 –
Microalbuminuria – 2.50 (1.26–4.95) 0.009
Macroalbuminuria – 9.25 (4.44–19.25) < 0.001
HbA1c (by 1%) 1.10 (0.92–1.31) 0.299 1.06 (0.88–1.27) 0.559
Triglycerides (by 10 mg/dL) 1.02 (0.99–1.05) 0.237 1.02 (0.99–1.06) 0.248 Systolic blood pressure (by 10 mmHg) 1.11 (0.97–1.27) 0.145 1.09 (0.95–1.25) 0.232
Proliferative retinopathy 2.39 (1.22–4.68) 0.011 2.36 (1.18–4.73) 0.016
•fast, convenient online submission
•
thorough peer review by experienced researchers in your field
• rapid publication on acceptance
• support for research data, including large and complex data types
•
gold Open Access which fosters wider collaboration and increased citations maximum visibility for your research: over 100M website views per year
•
At BMC, research is always in progress. Learn more biomedcentral.com/submissions
Ready to submit your research? Choose BMC and benefit from:
impairment co-existing with NIDDM [NEFRON] 11). Diabetes Care. 2009;32:1497–502.
6. Ninomiya T, Perkovic V, de Galan BE, Zoungas S, Pillai A, Jardine M, Patel A, Cass A, Neal B, Poulter N, Mogensen CE, Cooper M, Marre M, Williams B, Hamet P, Mancia G, Woodward M, Macmahon S, Chalmers J, ADVANCE Collaborative Group. Albuminuria and kidney function independently predict cardiovascular and renal outcomes in diabetes. J Am Soc Nephrol. 2009;20:1813–21.
7. Penno G, Solini A, Bonora E, Fondelli C, Orsi E, Zerbini G, Trevisan R, Vedo-vato M, Gruden G, Cavalot F, Cignarelli M, Laviola L, Morano S, Nicolucci A, Pugliese G, Renal Insufficiency And Cardiovascular Events (RIACE) Study Group. Clinical significance of nonalbuminuric renal impairment in type 2 diabetes. J Hypertens. 2011;29:1802–9.
8. Molitch ME, Steffes M, Sun W, Rutledge B, Cleary P, de Boer IH, Zinman B, Lachin J, Epidemiology of Diabetes Interventions and Complications Study Group. Development and progression of renal insufficiency with and without albuminuria in adults with type 1 diabetes in the diabetes control and complications trial and the epidemiology of diabetes inter-ventions and complications study. Diab Care. 2010;33:1536–43. 9. Hill CJ, Cardwell CR, Patterson CC, Maxwell AP, Magee GM, Young RJ,
Matthews B, O’Donoghue DJ, Fogarty DG. Chronic kidney disease and diabetes in the national health service: a cross-sectional survey of the UK national diabetes audit. Diabet Med. 2014;31:448–54.
10. Penno G, Russo E, Garofolo M, Daniele G, Lucchesi D, Giusti L, Sancho Bornez V, Bianchi C, Dardano A, Miccoli R, Del Prato S. Evidence for two distinct phenotypes of chronic kidney disease in individuals with type 1 diabetes mellitus. Diabetologia. 2017;60(6):1102–13.
11. Nicolucci A, Rossi MC, Arcangeli A, de Cimino A, Bigontina G, Fava D, Giorda C, Gentile S, Meloncelli I, Pellegrini F, Valentini U, Vespasiani G, AMD-Annals Study Group. Four year impact of a continuous quality improvement effort implemented by a network of diabetes outpatient clinics: the AMD Annals initiative. Diabet Med. 2010;27:1041–8. 12. De Cosmo S, Viazzi F, Pacilli A, Giorda C, Ceriello A, Gentile S, Russo G,
Rossi MC, Nicolucci A, Guida P, Feig D, Johnson RJ, Pontremoli R, AMD-Annals Study Group. Serum uric acid and risk of CKD in type 2 diabetes. Clin J Am Soc Nephrol. 2015;10:1921–9.
13. Pacilli A, Viazzi F, Fioretto P, Giorda C, Ceriello A, Genovese S, Russo G, Guida P, Pontremoli R, De Cosmo S, AMD-Annals Study Group. Epidemiol-ogy of diabetic kidney disease in adult patients with type 1 diabetes in Italy: the AMD-Annals initiative. Diab Metab Res Rev. 2017;33(4):e2873.
14. Levey AS, Stevens LA, Schmid CH, Zhang YL, Castro AF 3rd, Feldman HI, Kusek JW, Eggers P, Van Lente F, Greene T, Coresh J, CKD-EPI (Chronic Kidney Disease Epidemiology Collaboration). A new equation to estimate glomerular filtration rate. Ann Intern Med. 2009;150:604–12.
15. Coresh J, Turin TC, Matsushita K, Sang Y, Ballew SH, Appel LJ, Arima H, Chadban SJ, Cirillo M, Djurdjev O, Green JA, Heine GH, Inker LA, Irie F, Ishani A, Ix JH, Kovesdy CP, Marks A, Ohkubo T, Shalev V, Shankar A, Wen CP, de Jong PE, Iseki K, Stengel B, Gansevoort RT, Levey AS. Decline in estimated glomerular filtration rate and subsequent risk of end-stage renal disease and mortality. JAMA. 2014;311(24):2518–31.
16. Thorn LM, Gordin D, Harjutsalo V, Hägg S, Masar R, Saraheimo M, Tolonen N, Wadén J, Groop PH, Forsblom CM, FinnDiane Study Group. The pres-ence and consequpres-ence of nonalbuminuric chronic kidney disease in patients with type 1 diabetes. Diabetes Care. 2015;38:2128–33. 17. Caramori ML, Fioretto P, Mauer M. Low glomerular filtration rate in
nor-moalbuminuric type 1 diabetic patients: an indicator of more advanced glomerular lesions. Diabetes. 2003;52:1036–40.
18. Cooper ME, Mundel P, Boner G. Role of nephrin in renal disease including diabetic nephropathy. Semin Nephrol. 2002;22:393–8.
19. Hoefield RA, Kalra PA, Baker PG, Sousa I, Diggle PJ, Gibson MJ, O’Donoghue DJ, Middleton RJ, New JP. The use of eGFR and ACR to predict decline in renal function in people with diabetes. Nephrol Dial Transplant. 2011;26:887–92.
20. Fox CS, Matsushita K, Woodward M, Bilo HJ, Chalmers J, Heerspink HJ, Lee BJ, Perkins RM, Rossing P, Sairenchi T, Tonelli M, Vassalotti JA, Yamagishi K, de Coresh J, Jong PE, Wen CP, Nelson RG, Chronic Kidney Disease Progno-sis Consortium. Associations of kidney disease measures with mortality and end-stage renal disease in individuals with and without diabetes: a meta-analysis. Lancet. 2012;380:1662–73.
21. Wu HY, Peng YS, Chiang CK, Huang JW, Hung KY, Wu KD, Tu YK, Chien KL. Diagnostic performance of random urine samples using albumin concentration vs ratio of albumin to creatinine for microalbuminuria screening in patients with diabetes mellitus: a systematic review and meta-analysis. JAMA Intern Med. 2014;174:1108–15.
22. Pugliese G, Solini A, Fondelli C, Trevisan R, Vedovato M, Nicolucci A, Penno G, Renal Insufficiency And Cardiovascular Events (RIACE) Study Group. Reproducibility of albuminuria in type 2 diabetic subjects. Findings from the renal insufficiency and cardiovascular events (RIACE) study. Nephrol Dial Transplant. 2011;26:3950–4.