Original Paper
tional License (CC BY-NC-ND) (http://www.karger.com/Services/OpenAccessLicense). Usage and distribution for commercial purposes as well as any distribution of modified material requires written permission.
Apparent Treatment Resistant
Hypertension, Blood Pressure Control and
the Progression of Chronic Kidney Disease
in Patients with Type 2 Diabetes
Francesca Viazzia Eulalia Grecob Antonio Cerielloc,d Paola Fiorettoe Carlo Giordaf Pietro Guidag,h Giuseppina Russoi Salvatore De Cosmob Roberto Pontremolia AMD-Annals Study Groupj
aUniversità degli Studi and IRCCS Azienda Ospedaliera Universitaria San Martino-IST, Genova, bDepartment of Medical Sciences, Scientific Institute “Casa Sollievo della Sofferenza”, San Giovanni
Rotondo (FG), Italy, cInstitut d’Investigacions Biomèdiques August Pii Sunyer (IDIBAPS) and Centro
de Investigación Biomédicaen Red de Diabetes y Enfermedades Metabólicas Asociadas (CIBERDEM), Barcelona, Spain, dDepartment of Cardiovascular and Metabolic Diseases, IRCCS Gruppo Multimedica,
Sesto San Giovanni, Milano, Italy, eDepartment of Medicine, University of Padua, fDiabetes and
Metabolism Unit ASL Turin 5 Chieri (TO), gAssociazione Medici Diabetologi, Rome, hScientific Clinical
Institutes Maugeri, IRCCS, Institute of Cassano delle Murge, Bari, iDepartment of Clinical and
Experimental Medicine, University of Messina, Messina, jAssociazione Medici Diabetologi(AMD), Rome,
Italy
Key Words
Diabetes • Chronic kidney disease • Hypertension • Albuminuria • EGFR
Abstract
Background/Aims: Apparent treatment resistant hypertension (aTRH) is highly prevalent in
patients with type 2 diabetes (T2D) and chronic kidney disease (CKD). The impact of aTRH and achievement of recommended blood pressure (BP) values on the rate of glomerular filtration rate (eGFR) loss in CKD patients is poorly known. To assess the role of aTRH and time-updated BP control (BPC) on the progression of CKD in patients with T2D and hypertension (HT) in real life clinical practice. Methods: Clinical records from a total of 2,778 diabetic patients with HT and stage 3 CKD (i.e. baseline eGFR values between 30 and 60 ml/min) and regular visits during a four-year follow-up were analyzed. The association between BPC (i.e. 75% of visits with BP <140/90 mmHg) and eGFR loss (i.e. a >30% reduction from baseline) or worsening of albuminuria status over time was assessed. Results: At baseline 33% of patients had aTRH. Over the 4-year follow-up, 20% had a >30% eGFR reduction. Patients with aTRH had an increased
Roberto Pontremoli Università degli Studi and IRCCS Policlinico San Martino-IST Viale Benedetoo XV, 6 16132 Genova (Italy)
risk of eGFR loss >30% (OR 1.31; P<0.007). In patients with aTRH, BPC was associated with a 79% (P=0.029) greater risk of eGFR reduction despite a 58% (P=0.001) lower risk of albuminuria status worsening. In non-aTRH, no association was found between BPC and renal outcome.
Conclusion: In patients with stage 3 CKD the presence of aTRH entails a faster loss of eGFR.
More effective prevention of aTRH should be implemented as this condition is associated with a burden of risk not modifiable by tight BP reduction.
Introduction
Resistant hypertension (RH), defined as a blood pressure (BP) above recommended levels despite optimal combination of at least three different drugs including a diuretic [1-3], is a relatively frequent finding in patients at cardiovascular risk (CVR), especially in the presence of diabetes and chronic kidney disease (CKD) [4-6]. The prevalence of RH has been reported to vary considerably, from 10 to 40% [3, 7], depending on the clinical setting and confounding factors such as poor adherence to treatment. Thus, it has been suggested that the term apparent treatment resistant hypertension (aTRH) should be used when adherence to medications or out-of-office BP cannot be verified [8].
ATRH has been associated to worse cardiovascular (CV) morbidity and mortality [9-10] and accelerated loss of renal function in CKD patients [6, 11]. In a recent retrospective study conducted on a large general population cohort, the presence of RH was associated with a 23% greater risk of developing a cardiovascular event as well as a 25% greater risk of reaching end-stage renal disease (ESRD). These data further strengthen the association between severity of hypertension and unfavorable vascular outcome and underscore the importance of early identification and possibly prevention of RH [12].
Moreover, and somewhat surprisingly, preliminary studies seem to indicate that pharmacologic reduction of BP does not provide much cardiovascular and renal protection in RH [9, 13-14] and may even be associated with harm [3]. As a matter of fact, in a recent retrospective study on a large cohort of treated hypertensive patients in the US, very low on-treatment BP values (i.e. SBP<120 and/or DBP<70 mmHg) were associated with greater cardiovascular risk as compared to more relaxed BP control independently of the presence of aTRH [15]. Likewise, in a post-hoc analysis of Ontarget /Transcend studies, mean achieved SBP below120 mmHg was associated with an increase in CV and all cause death [16].
Taken together, these data support the possibility of a paradoxical increase in cardiovascular and renal risk when BP is reduced to very low values. This so called J-curve phenomenon has especially been reported in highly comorbid patients such as those with aTRH.
No study so far has evaluated long term renal outcome, under real life clinical conditions, in patients with aTRH, type 2 diabetes (T2D) and CKD. We therefore set out to investigate the relationship between the presence of aTRH, achievement and maintenance of recommended BP values and changes in eGFR and albuminuria over a 4-year period in a large cohort of patients with T2D, hypertension and CKD in Italy.
Materials and Methods
Study participants
As already reported [17-19], in Italy, diabetes care is mostly provided by a public network of about 700 diabetes clinics in which a team of specialists provides diagnostic confirmation, prevention and treatment for diabetes and its complications through close patients follow-up and regular checkups [17-19]. In the present study we selected a large cohort of patients with T2D followed up at 90 diabetes centers in Italy among those participating in the Italian Association of Clinical Diabetologists (Associazione Medici Diabetologi, AMD) initiative. The analysis was performed using the data set of electronic medical records
© 2018 The Author(s) Published by S. Karger AG, Basel
collected between 1 January 2004 and 30 June 2011. For the purpose of the analysis, we considered only patients at least 18 years old and with a follow-up evaluation within 6 months complete for data about BP values, estimated glomerular filtration rate (eGFR), albuminuria and information on treatment.
Of 36, 302 patients identified, after exclusion of 33, 524 patients with a confirmed eGFR value above 60 ml/min, or below 30 ml/min or missing information about medication, or lack of a diagnosis of hypertension (SBP <140 mm Hg and DBP <90mm Hg and not taking antihypertensive medications at baseline), a total of 2, 778 patients from 84 clinics constitute the study population (Fig. 1). The centers involved in the study were homogeneously distributed throughout the country.
Study design
The analysis of the database is an attempt by the Italian Association of Clinical Diabetologists (Associazione Medici Diabetologi, AMD) initiative to identify a set of indicators that can be used in the context of continuous quality improvement. Participating centers adopted the same software systems for everyday management of outpatients, whereas a specially developed software package allowed us to extract the information we intended to analyze from all the clinical databases (AMD Data File). Moreover, data from all participating centers were collected and centrally analyzed anonymously [17-19]. All patients gave their informed consent and internal approval was obtained by the AMD annals Scientific Committee. The current initiative includes measuring and monitoring glycated hemoglobin (HbA1c), BP, LDL cholesterol (LDL-c), total and HDL cholesterol (HDL-c) and triglycerides. The use of specific classes of drugs was also evaluated. As normal ranges for HbA1c varied among centers, the percentage change with respect to the upper normal value (measured value/upper normal limit) was estimated and multiplied by 6.0 to allow comparisons among the centers. Kidney function was assessed by serum creatinine and urinary albumin excretion measurements. GFR was estimated for each patient using a standardized serum creatinine assay and the Chronic Kidney Disease Epidemiology Collaboration formula [20]. Increased urinary albumin excretion was diagnosed as: i. microalbuminuria if urinary albumin concentration was >30 and ≤300 mg/L, or if urinary albumin excretion rate was >20 and ≤200 μg/min, or if urinary albumin-to-creatinine ratio (ACR) was >2.5 mg/mmol in men and >3.5 mg/mmol in women and ≤30 mg/mmol in both gender; ii. macroalbuminuria if urinary albumin concentration was >300 mg/L, or if urinary albumin excretion rate was >200 μg/min, or if ACR was >30 mg/mmol in both gender. Albuminuria indicates patients with either micro or macroalbuminuria. At each participating center, all patients underwent physical examination and BP measurements according to a standardized protocol. BP was measured with the patient in the sitting position after a 5-min rest, with a mercury sphygmomanometer. SBP and DBP were read to the nearest 2mmHg. Disappearance of Korotkoff sounds (phase V) was the criterion for DBP. Three measurements were taken at 2-min intervals, and the average value was used to define clinical SBP and DBP.
The main analysis was aimed at evaluating the association between aTRH, BP control and renal outcome during the study. For each outcome, visits after the event occurrence were excluded from the BPC evaluation. The outcomes were: i) an eGFR reduction >30% from baseline and ii) worsening of albuminuria status
Definition of ATRH and BPC
We defined ATRH as SBP or DBP ≥ the BP goal while taking ≥3 antihypertensive medications including a diuretic or taking ≥4 antihypertensive medications including a diuretic regardless of BP values at baseline visit. The BP goal of <140/90 mm Hg used for this analysis is consistent with the recommended BP goal for patients with diabetes in recent guidelines [21-22].
Time-updated BP control (BPC) was defined as > 75% of visits with SBP and DBP <140/90 mmHg, while in secondary analyses time-updated mean SBP was analyzed as the average of all available SBP values before the occurrence of the endpoint if any. Patients not meeting the criteria for BPC were defined as uncontrolled.
Statistics
Data are given as mean values ± standard deviation (SD); categorical variables are described as frequencies and percentages. Data were analyzed by mixed models with diabetes clinics fitted as random effect considering patients as clusters of observations to take into account possible differences across
centres. Continuous variables were analyzed with a linear mixed regression model and categorical variables by using a mixed logistic regression model. Odds ratios (ORs) for each renal outcome were reported with their 95% confidence interval (95% CI). A multivariate model was fitted with a complete-case analysis performed including patients for which all data were observed. Assuming linearity of GFR reduction over-time, its slope was taken as a measure of disease progression rate. For each patients, we calculated the regression coefficient (slope) of linear regression between eGFR value and the exact time in years from the first evaluation including all measurements from baseline to the 4-year visit. Cumulative incidence curves were created with the Kaplan-Meier method. A Cox proportional hazard model was used to derive hazard ratios (HRs) with 95% confidence intervals (CIs). The analyses were carried out using STATA software, Version 14 (StataCorp, College Station, Texas). P values of <0.05 were considered statistically significant.
Results
Among the 36, 302 patients evaluated annually over 4 years for arterial BP, eGFR and albuminuria, a confirmed prior eGFR value between 60 and 30 ml/min independently by albuminuria status, complete information about medications, and a diagnosis of hypertension, 2, 778 patients have been selected for the present analyses (Fig. 1).
Overall, the mean age was 73±7 years, 50% of patients were men and the mean duration of diabetes was 15±10 years. The glycometabolic status of participants was fairly good, being the mean values of HbA1c and LDL-c of 7.3±1.3%, 107±33 mg/dl, respectively. The average BP was 144±19/79±9 mmHg, with 68% of patients showing either SBP or DBP values above 140/85 mmHg at the baseline visit. Ninety-one percent of patients were receiving antihypertensive treatment (with a mean of 2.4±1.4 drugs per patient), and 79% were taking an ACE-I or an ARB. Mean eGFR was 48±8 ml/min per 1.73m2 with 34% of patient with eGFR <45 ml/min and 36% of patients had increased albuminuria (Table 1).
The association between clinical and demographic factors and aTRH is shown in Table 2. Higher BMI, lower eGFR and a more complex therapeutic strategy with aspirin and with antidiabetic drugs associated to insulin were independently associated with significantly higher odds of having aTRH. In addition, every 10 mL/min per 1.73 m2 decrease in GFR was associated with a 17% higher odds of ATRH (adjusted OR 1.17, CI 1.03-1.32; P=0.014)
The prevalence of aTRH was 32.7% (n=911). The baseline characteristics of patients with and without aTRH are also detailed in Table 1. Those with aTRH were more likely to be females, to have higher BMI, higher BP and lower low-density lipoprotein cholesterol levels than those without aTRH. Moreover, the former group had lower eGFR, with an increased prevalence of CKD3b and albuminuria, and higher serum uric acid levels. As expected, patients with aTRH were more likely to be prescribed antihypertensive treatment (especially with diuretics and RAAS-inhibiting agents) and lipid-lowering treatment.
Fig. 1. Flow diagram for selection of study patients. eGFR, estimated glomerular filtration rate.
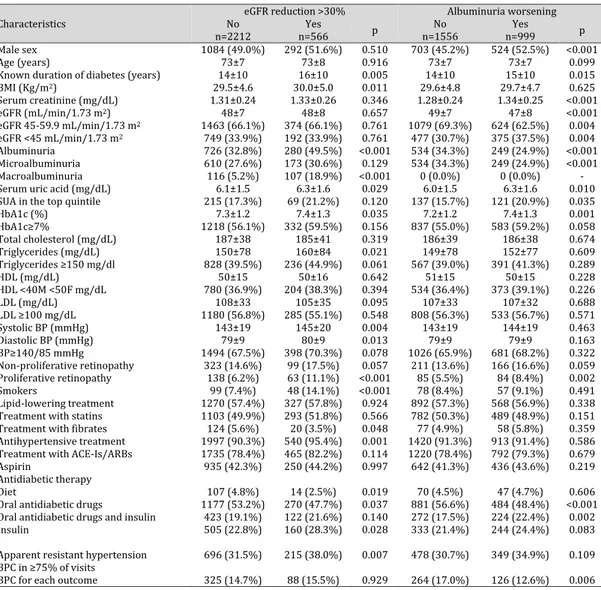
Table 1. Baseline characteristics of study patients and renal outcomes during the 4-year follow-up stratified by apparent resistant hypertension. Mean±SD or absolute frequency (percentage). ATRH, apparent resistant hypertension; BMI, body mass index; HbA1c, glycated haemoglobin; HDL-c, high-density lipoprotein cholesterol; LDL-c, low-density lipoprotein cholesterol; eGFR, estimated glomerular filtration rate; SBP, systolic blood pressure; DBP, diastolic blood pressure; ACE-Is, angiotensin converting enzyme-inhibitors; ARBs, angiotensin II receptor antagonists. Patients’ baseline missing data: known duration of diabetes in 52 (1.9%), BMI in 173 (6.2%), serum uric acid in 1208 (43.5%), HbA1c in 50 (1.8%), total cholesterol in 116 (4.2%), triglycerides in 158 (5.7%), HDL in 134 (4.8%), LDL in 184 (6.6%), and smoking status in 1107 (39.8%). Worsening of albuminuria excluding patients with baseline macroalbuminuria. Serum uric acid gender-specific quintile: >7.2 mg/dL in females and >7.6 mg/dL in males
1
Characteristics n=2778 All No ATRH N=1867 N=911 ATRH p
Male sex 1376 (49.5%) 947 (50.7%) 429 (47.1%) 0.044
Age (years) 73±7 73±7 73±7 0.538
Known duration of diabetes (years) 15±10 14±10 15±10 0.225
BMI (Kg/m2) 29.6±4.7 29.2±4.5 30.5±5.0 <0.001 Serum creatinine (mg/dL) 1.32±0.25 1.31±0.24 1.33±0.26 0.115 eGFR (mL/min/1.73 m2) 48±8 48±7 47±8 0.001 eGFR 45-59.9 mL/min/1.73 m2 1837 (66.1%) 1266 (67.8%) 571 (62.7%) 0.019 eGFR <45 mL/min/1.73 m2 941 (33.9%) 601 (32.2%) 340 (37.3%) 0.019 Albuminuria 1006 (36.2%) 646 (34.6%) 360 (39.5%) 0.015 Microalbuminuria 783 (28.2%) 507 (27.2%) 276 (30.3%) 0.110 Macroalbuminuria 223 (8.0%) 139 (7.4%) 84 (9.2%) 0.114
Serum uric acid (mg/dL) 6.2±1.5 6.0±1.5 6.4±1.5 <0.001
Serum uric acid in the top gender-specific quintile 284 (18.1%) 162 (15.4%) 122 (23.4%) 0.001
HbA1c (%) 7.3±1.2 7.3±1.2 7.3±1.2 0.496 HbA1c≥7% 1550 (56.8%) 1032 (56.4%) 518 (57.7%) 0.738 Total cholesterol (mg/dL) 186±39 187±39 185±38 0.105 Triglycerides (mg/dL) 152±79 151±78 155±82 0.209 Triglycerides ≥150 mg/dl 1064 (40.6%) 704 (39.8%) 360 (42.2%) 0.253 HDL (mg/dL) 50±15 50±15 50±16 0.696 HDL <40M <50F mg/dL 984 (37.2%) 655 (36.7%) 329 (38.2%) 0.515 LDL (mg/dL) 107±33 108±33 105±33 0.031 LDL ≥100 mg/dL 1465 (56.5%) 1011 (57.6%) 454 (54.0%) 0.155 Systolic BP (mmHg) 144±19 142±19 148±19 <0.001 Diastolic BP (mmHg) 79±9 79±9 80±9 0.008 BP≥140/85 mmHg 1892 (68.1%) 1161 (62.2%) 731 (80.2%) <0.001
Standard Deviation Systolic BP (mmHg) 13.5±6.5 13.2±6.4 14.0±6.7 0.005
Standard Deviation Diastolic BP (mmHg) 6.6±3.6 6.6±3.6 6.5±3.5 0.508
Non-proliferative retinopathy 422 (15.2%) 274 (14.7%) 148 (16.2%) 0.273
Proliferative retinopathy 201 (7.2%) 130 (7.0%) 71 (7.8%) 0.387
Smokers 147 (8.8%) 107 (9.5%) 40 (7.4%) 0.234
Lipid-lowering treatment 1597 (57.5%) 1021 (54.7%) 576 (63.2%) 0.001
Treatment with statins 1396 (50.3%) 879 (47.1%) 517 (56.8%) <0.001
Treatment with fibrates 144 (5.2%) 105 (5.6%) 39 (4.3%) 0.096
Antihypertensive treatment 2537 (91.3%) 1626 (87.1%) 911 (100.0%) -
Treatment with ACE-Is/ARBs 2200 (79.2%) 1339 (71.7%) 861 (94.5%) -
Aspirin 1185 (42.7%) 751 (40.2%) 434 (47.6%) 0.001
Antidiabetic therapy
Diet 121 (4.4%) 85 (4.6%) 36 (4.0%) 0.412
Oral antidiabetic drugs 1447 (52.1%) 1002 (53.7%) 445 (48.8%) 0.020
Oral antidiabetic drugs and insulin 545 (19.6%) 343 (18.4%) 202 (22.2%) 0.014
Insulin 665 (23.9%) 437 (23.4%) 228 (25.0%) 0.404
4-year outcome
GFR reduction >30% 566 (20.4%) 351 (18.8%) 215 (23.6%) 0.007
Worsening of albuminuria 999 (39.1%) 650 (37.6%) 349 (42.2%) 0.086
Worsening of albuminuria to micro 642 (25.1%) 418 (24.2%) 224 (27.1%) 0.195
Worsening of albuminuria to macro 357 (14.0%) 232 (13.4%) 125 (15.1%) 0.449
Blood pressure control in at least 75% of visits
BPC for eGFR red >30% 413 (14.9%) 312 (16.7%) 101 (11.1%) <0.001
Over the 4-year study follow-up, 20% of study patients (n=566) developed an eGFR reduction >30% from baseline and 39% (n=999) a worsening in albuminuria status. Patients with aTRH showed a higher cumulative incidence for eGFR loss (HR 1.42, CI 1.19-1.69; P<0.001), as compared with those without aTRH (Fig. 2 A and Fig. 3 A).
Baseline clinical features of patients grouped on the basis of achieved renal outcome within the study period are reported in Table 3. On average, patients who went on to develop an eGFR reduction >30% from baseline showed a worse clinical and metabolic profile. They had a longer duration of diabetes, higher BMI, triglycerides, and were more likely to be smokers, to be treated for hypertension and with insulin and to show macroalbuminuria and proliferative retinopathy. Moreover, they had higher HbA1c levels and BP values with a greater prevalence of aTRH and similar BPC despite a greater prevalence of antihypertensive and insulin treatment. On the other hand, those who went on to significantly increase albuminuria were more likely to be female and to show proliferative retinopathy, they had a longer duration of diabetes, lower
Table 2. Multivariate analysis for apparent resistant hypertension. Factors Associated with Apparent Treatment Resistant Hypertension. Odds Ratio for single renal outcome with 95% confidence interval. eGFR, estimated glomerular filtration rate; BMI, body mass index; HbA1c, glycated haemoglobin; HDL-c, high-density lipoprotein cholesterol; LDL-c, low-density lipoprotein cholesterol; SBP, systolic blood pressure; DBP, diastolic blood pressure. Complete-case analysis including 2312 patients for which all data were observed
2
Characteristics OR (95% CI) p
Male sex 0.89 (0.74-1.08) 0.232
Age (by 10 years) 1.03 (0.90-1.18) 0.688
Duration of diabetes (by 1ß years) 0.97 (0.88-1.08) 0.609
BMI (by 5 kg/m²) 1.34 (1.22-1.49) <0.001
eGFR (by 10mL/min/1.73m² reduction 1.17 (1.03-1.32) 0.014
Microalbuminuria 1.07 (0.87-1.33) 0.506 Macroalbuminuria 1.21 (0.86-1.70) 0.270 HbA1c≥7% 0.89 (0.73-1.09) 0.258 Triglycerides ≥150 mg/dl 1.08 (0.88-1.31) 0.463 HDL <40M <50F mg/dL 0.88 (0.72-1.07) 0.210 LDL ≥100 mg/dL 0.88 (0.73-1.07) 0.200 Non-proliferative retinopathy 1.00 (0.77-1.29) 0.987 Proliferative retinopathy 1.03 (0.72-1.47) 0.873 Lipid-lowering treatment 1.20 (0.99-1.46) 0.068 Aspirin 1.24 (1.02-1.49) 0.029 Antidiabetic therapy Diet 1.08 (0.68-1.71) 0.755
Oral antidiabetic drugs 1.00
Oral antidiabetic drugs and insulin 1.37 (1.06-1.76) 0.014
Insulin 1.08 (0.84-1.39) 0.536
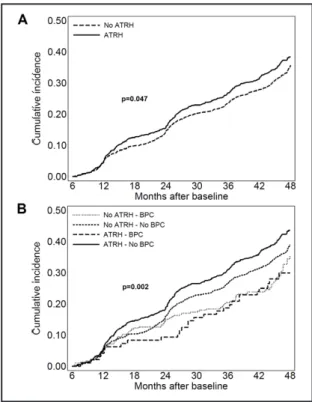
Fig. 2. Cumulative incidence curves by Kaplan-Meier of eGFR reduction >30% from baseline on the basis of aTRH (A) and aTRH and BPC status (B) in patients with T2D. ATRH, apparent treatment resistant hypertension; eGFR, estimated glomerular filtration rate. Blood pressure control (BPC) refers to the proportion of visits with systolic and diastolic blood pressure <140/90 mm Hg.
eGFR, higher uric acid and HbA1c levels and a lower prevalence of albuminuria at baseline as compared to those without albuminuria worsening. Moreover, they had similar BP levels and prevalence of aTRH and were less likely to show BPC. Blood pressure visit-to-visit variability was higher in the subgroup of patients who reached any renal endpoint within the study period (Table 1).
Additional analyses explored
the relationship between different hypertension categories on the basis of aTRH and time updated BPC and renal outcomes. Individuals with uncontrolled aTRH showed a higher BMI and had higher BP values, HbA1c, and total, low-density and high -low-density lipoprotein cholesterol levels than those with good BPC, with or without aTRH. On average, patients without time updated BPC showed lower eGFR values and were more likely to show albuminuria and in particular macroalbuminuria. Patients with uncontrolled hypertension were less likely to be prescribed antihypertensive treatment (number of drugs 1.6±1.0 vs 2.0±0.8 for no aTRH, p<0.001 and 3.8±0.9 vs 4.2±0.7 for aTRH, p<0.001), aspirin and lipid-lowering treatment as compared to those with BPC (Table 4).
When we performed a multivariate analysis, only the presence of micro or macroalbuminuria and the prescription of antihypertensive treatment were significantly and independently associated to a loss of eGFR >30% from baseline as indicated in Table 5. At variance, male gender, age, low HDL, eGFR reduction and the presence of microalbuminuria and of retinopathy were significantly and independently associated to albuminuria worsening along the 4-year follow-up. Patients with aTRH and no BPC showed an increased risk of albuminuria progression as compared to those with no-aTRH and BPC (fully adjusted OR 1.53; CI 1.08- 2.18, P=0.017) (Table 5).
Moreover, patients with aTRH and BPC showed an increased risk of developing eGFR reduction as compared to those with no aTRH independently of the presence of BPC (fully adjusted HR 1.73; CI 1.1- 2.73 P=0.019 vs no aTRH and BPC and HR 1.88; CI 1.27- 2.78, P=0.002 vs no aTRH and no BPC, respectively) (Fig. 2 B). As for albuminuria worsening, patients with aTRH showed a higher risk (HR 1.15, CI 1.00-1.31; P=0.047), as compared withthose without aTRH (Fig. 3 A). Patients with aTRH and no BPC showed a greater risk of albuminuria worsening as compared to those with aTRH and BPC (fully adjusted HR 1.6; CI 1.09- 2.39, P=0.018) as well as those with no aTRH independently of the presence of BPC (HR 1.47; CI 1.16- 1.86, P=0.001 and HR 1.19; CI 1.04-1.38, P= 0.015 for BPC and no BPC respectively) (Fig. 3 B).
We investigated changes in eGFR along the four year follow up on the basis of aTRH and BPC using adjusted mean values of eGFR slope. The yearly mean eGFR slope was significantly higher in patients with aTRH as compared to those without aTRH (0.99 ±3.10 vs 0.55 ±3.20,
Fig. 3. Cumulative incidence curves by Kaplan-Meier of albuminuria worsening on the basis of aTRH (A) and aTRH and BPC status (B) in patients with T2D. ATRH, apparent treatment resistant hypertension; Blood pressure control (BPC) refers to the proportion of visits with systolic and diastolic blood pressure <140/90 mm Hg.
P=0.010). At variance, patients with and without BPC showed a very similar yearly mean eGFR slope (0.67 ±3.24 vs 0.70 ±3.17, P=0.698)
When our data were evaluated on the basis of time-updated mean SBP it emerged that aTRH patients showed a greater risk of developing low eGFR as compared to non aTRH patients over the entire range of BP (Fig. 4). Furthermore, while the risk for albuminuria worsening decreases along with BP reduction without reaching a nadir, the achievement of SBP values below 125 mmHg entails a paradoxical increase in the incidence of GFR reduction, thereby confirming the existence of a J curve relationship between SBP and renal function (Fig. 4 and 5).
Table 3. Baseline characteristics of study patients by renal outcome within 4-year. Mean±SD or absolute frequency (percentage). eGFR, estimated glomerular filtration rate; BMI, body mass index; HbA1c, glycated haemoglobin; HDL-c, high-density lipoprotein cholesterol; LDL-c, low-density lipoprotein cholesterol; SBP, systolic blood pressure; DBP, diastolic blood pressure; ACE-Is, angiotensin converting enzyme-inhibitors; ARBs, angiotensin II receptor antagonists
3
Characteristics No eGFR reduction >30% Albuminuria worsening
n=2212 n=566 Yes p n=1556 No n=999 Yes p
Male sex 1084 (49.0%) 292 (51.6%) 0.510 703 (45.2%) 524 (52.5%) <0.001
Age (years) 73±7 73±8 0.916 73±7 73±7 0.099
Known duration of diabetes (years) 14±10 16±10 0.005 14±10 15±10 0.015
BMI (Kg/m2) 29.5±4.6 30.0±5.0 0.011 29.6±4.8 29.7±4.7 0.625 Serum creatinine (mg/dL) 1.31±0.24 1.33±0.26 0.346 1.28±0.24 1.34±0.25 <0.001 eGFR (mL/min/1.73 m2) 48±7 48±8 0.657 49±7 47±8 <0.001 eGFR 45-59.9 mL/min/1.73 m2 1463 (66.1%) 374 (66.1%) 0.761 1079 (69.3%) 624 (62.5%) 0.004 eGFR <45 mL/min/1.73 m2 749 (33.9%) 192 (33.9%) 0.761 477 (30.7%) 375 (37.5%) 0.004 Albuminuria 726 (32.8%) 280 (49.5%) <0.001 534 (34.3%) 249 (24.9%) <0.001 Microalbuminuria 610 (27.6%) 173 (30.6%) 0.129 534 (34.3%) 249 (24.9%) <0.001 Macroalbuminuria 116 (5.2%) 107 (18.9%) <0.001 0 (0.0%) 0 (0.0%) -
Serum uric acid (mg/dL) 6.1±1.5 6.3±1.6 0.029 6.0±1.5 6.3±1.6 0.010
SUA in the top quintile 215 (17.3%) 69 (21.2%) 0.120 137 (15.7%) 121 (20.9%) 0.035
HbA1c (%) 7.3±1.2 7.4±1.3 0.035 7.2±1.2 7.4±1.3 0.001 HbA1c≥7% 1218 (56.1%) 332 (59.5%) 0.156 837 (55.0%) 583 (59.2%) 0.058 Total cholesterol (mg/dL) 187±38 185±41 0.319 186±39 186±38 0.674 Triglycerides (mg/dL) 150±78 160±84 0.021 149±78 152±77 0.609 Triglycerides ≥150 mg/dl 828 (39.5%) 236 (44.9%) 0.061 567 (39.0%) 391 (41.3%) 0.289 HDL (mg/dL) 50±15 50±16 0.642 51±15 50±15 0.228 HDL <40M <50F mg/dL 780 (36.9%) 204 (38.3%) 0.394 534 (36.4%) 373 (39.1%) 0.226 LDL (mg/dL) 108±33 105±35 0.095 107±33 107±32 0.688 LDL ≥100 mg/dL 1180 (56.8%) 285 (55.1%) 0.548 808 (56.3%) 533 (56.7%) 0.571 Systolic BP (mmHg) 143±19 145±20 0.004 143±19 144±19 0.463 Diastolic BP (mmHg) 79±9 80±9 0.013 79±9 79±9 0.163 BP≥140/85 mmHg 1494 (67.5%) 398 (70.3%) 0.078 1026 (65.9%) 681 (68.2%) 0.322 Non-proliferative retinopathy 323 (14.6%) 99 (17.5%) 0.057 211 (13.6%) 166 (16.6%) 0.059 Proliferative retinopathy 138 (6.2%) 63 (11.1%) <0.001 85 (5.5%) 84 (8.4%) 0.002 Smokers 99 (7.4%) 48 (14.1%) <0.001 78 (8.4%) 57 (9.1%) 0.491 Lipid-lowering treatment 1270 (57.4%) 327 (57.8%) 0.924 892 (57.3%) 568 (56.9%) 0.338
Treatment with statins 1103 (49.9%) 293 (51.8%) 0.566 782 (50.3%) 489 (48.9%) 0.151
Treatment with fibrates 124 (5.6%) 20 (3.5%) 0.048 77 (4.9%) 58 (5.8%) 0.359
Antihypertensive treatment 1997 (90.3%) 540 (95.4%) 0.001 1420 (91.3%) 913 (91.4%) 0.586
Treatment with ACE-Is/ARBs 1735 (78.4%) 465 (82.2%) 0.114 1220 (78.4%) 792 (79.3%) 0.679
Aspirin 935 (42.3%) 250 (44.2%) 0.997 642 (41.3%) 436 (43.6%) 0.219
Antidiabetic therapy
Diet 107 (4.8%) 14 (2.5%) 0.019 70 (4.5%) 47 (4.7%) 0.606
Oral antidiabetic drugs 1177 (53.2%) 270 (47.7%) 0.037 881 (56.6%) 484 (48.4%) <0.001
Oral antidiabetic drugs and insulin 423 (19.1%) 122 (21.6%) 0.140 272 (17.5%) 224 (22.4%) 0.002
Insulin 505 (22.8%) 160 (28.3%) 0.028 333 (21.4%) 244 (24.4%) 0.083
Apparent resistant hypertension 696 (31.5%) 215 (38.0%) 0.007 478 (30.7%) 349 (34.9%) 0.109 BPC in ≥75% of visits
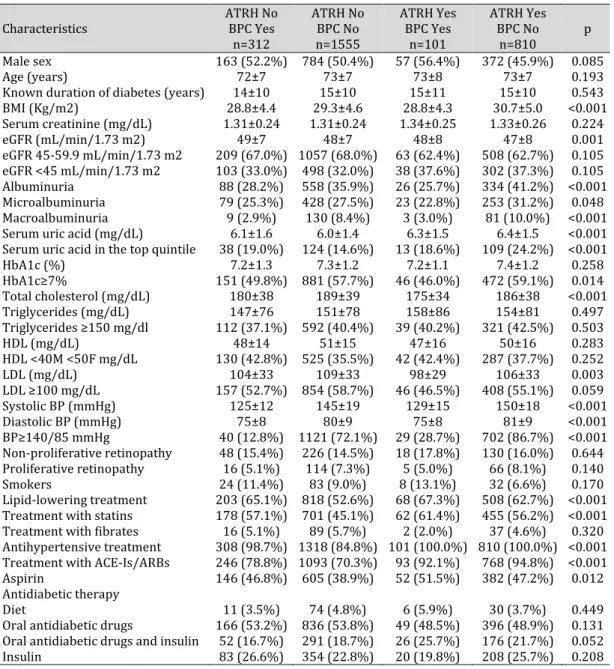
Table 4. Baseline characteristics by apparent resistant hypertension and blood pressure control. Mean±SD or absolute frequency (percentage). ATRH, apparent resistant hypertension; BPC, > 75% of visits with SBP and DBP <140/90 mmHg. BMI, body mass index; eGFR, estimated glomerular filtration rate; HbA1c, glycated haemoglobin; HDL-c, high-density lipoprotein cholesterol; LDL-c, low-density lipoprotein cholesterol; SBP, systolic blood pressure; DBP, diastolic blood pressure; ACE-Is, angiotensin converting enzyme-inhibitors; ARBs, angiotensin II receptor antagonists. The p values refer to the overall significance of logistic mixed regression model for categorical data or linear for continuous variables with blood pressure group as dependent variable
4
Characteristics ATRH No BPC Yes
n=312 ATRH No BPC No n=1555 ATRH Yes BPC Yes n=101 ATRH Yes BPC No n=810 p Male sex 163 (52.2%) 784 (50.4%) 57 (56.4%) 372 (45.9%) 0.085 Age (years) 72±7 73±7 73±8 73±7 0.193
Known duration of diabetes (years) 14±10 15±10 15±11 15±10 0.543
BMI (Kg/m2) 28.8±4.4 29.3±4.6 28.8±4.3 30.7±5.0 <0.001 Serum creatinine (mg/dL) 1.31±0.24 1.31±0.24 1.34±0.25 1.33±0.26 0.224 eGFR (mL/min/1.73 m2) 49±7 48±7 48±8 47±8 0.001 eGFR 45-59.9 mL/min/1.73 m2 209 (67.0%) 1057 (68.0%) 63 (62.4%) 508 (62.7%) 0.105 eGFR <45 mL/min/1.73 m2 103 (33.0%) 498 (32.0%) 38 (37.6%) 302 (37.3%) 0.105 Albuminuria 88 (28.2%) 558 (35.9%) 26 (25.7%) 334 (41.2%) <0.001 Microalbuminuria 79 (25.3%) 428 (27.5%) 23 (22.8%) 253 (31.2%) 0.048 Macroalbuminuria 9 (2.9%) 130 (8.4%) 3 (3.0%) 81 (10.0%) <0.001
Serum uric acid (mg/dL) 6.1±1.6 6.0±1.4 6.3±1.5 6.4±1.5 <0.001
Serum uric acid in the top quintile 38 (19.0%) 124 (14.6%) 13 (18.6%) 109 (24.2%) <0.001
HbA1c (%) 7.2±1.3 7.3±1.2 7.2±1.1 7.4±1.2 0.258 HbA1c≥7% 151 (49.8%) 881 (57.7%) 46 (46.0%) 472 (59.1%) 0.014 Total cholesterol (mg/dL) 180±38 189±39 175±34 186±38 <0.001 Triglycerides (mg/dL) 147±76 151±78 158±86 154±81 0.497 Triglycerides ≥150 mg/dl 112 (37.1%) 592 (40.4%) 39 (40.2%) 321 (42.5%) 0.503 HDL (mg/dL) 48±14 51±15 47±16 50±16 0.283 HDL <40M <50F mg/dL 130 (42.8%) 525 (35.5%) 42 (42.4%) 287 (37.7%) 0.252 LDL (mg/dL) 104±33 109±33 98±29 106±33 0.003 LDL ≥100 mg/dL 157 (52.7%) 854 (58.7%) 46 (46.5%) 408 (55.1%) 0.059 Systolic BP (mmHg) 125±12 145±19 129±15 150±18 <0.001 Diastolic BP (mmHg) 75±8 80±9 75±8 81±9 <0.001 BP≥140/85 mmHg 40 (12.8%) 1121 (72.1%) 29 (28.7%) 702 (86.7%) <0.001 Non-proliferative retinopathy 48 (15.4%) 226 (14.5%) 18 (17.8%) 130 (16.0%) 0.644 Proliferative retinopathy 16 (5.1%) 114 (7.3%) 5 (5.0%) 66 (8.1%) 0.140 Smokers 24 (11.4%) 83 (9.0%) 8 (13.1%) 32 (6.6%) 0.170 Lipid-lowering treatment 203 (65.1%) 818 (52.6%) 68 (67.3%) 508 (62.7%) <0.001 Treatment with statins 178 (57.1%) 701 (45.1%) 62 (61.4%) 455 (56.2%) <0.001
Treatment with fibrates 16 (5.1%) 89 (5.7%) 2 (2.0%) 37 (4.6%) 0.320
Antihypertensive treatment 308 (98.7%) 1318 (84.8%) 101 (100.0%) 810 (100.0%) <0.001 Treatment with ACE-Is/ARBs 246 (78.8%) 1093 (70.3%) 93 (92.1%) 768 (94.8%) <0.001
Aspirin 146 (46.8%) 605 (38.9%) 52 (51.5%) 382 (47.2%) 0.012
Antidiabetic therapy
Diet 11 (3.5%) 74 (4.8%) 6 (5.9%) 30 (3.7%) 0.449
Oral antidiabetic drugs 166 (53.2%) 836 (53.8%) 49 (48.5%) 396 (48.9%) 0.131 Oral antidiabetic drugs and insulin 52 (16.7%) 291 (18.7%) 26 (25.7%) 176 (21.7%) 0.052
Table 5. Multivariate analysis for the occurrence of 4-year renal outcome. Odds Ratio for single renal outcome with 95% confidence interval. eGFR, estimated glomerular filtration rate; BMI, body mass index; HbA1c, glycated haemoglobin; HDL-c, high-density lipoprotein cholesterol; LDL-c, low-density lipoprotein cholesterol; SBP, systolic blood pressure; DBP, diastolic blood pressure; ACE-Is, angiotensin converting enzyme-inhibitors; ARBs, angiotensin II receptor antagonists; ATRH, apparent resistant hypertension; BPC, > 75% of visits with SBP and DBP <140/90 mmHg. Complete-case analysis including 2312 patients for which all data were observed (2126 for albuminuria worsening excluding patients with baseline macroalbuminuria)
5
Characteristics OR (95% CI) eGFR reduction >30% p OR (95% CI) Albuminuria worsening p
Male sex 0.95 (0.75-1.19) 0.645 1.75 (1.43-2.14) <0.001
Age (by 10 years) 1.04 (0.89-1.23) 0.613 1.18 (1.02-1.37) 0.025
Duration of diabetes (by 10 years) 1.07 (0.95-1.21) 0.279 1.04 (0.94-1.16) 0.441
BMI (by 5 Kg/m2) 1.11 (0.98-1.25) 0.091 1.05 (0.95-1.17) 0.329
eGFR (by 10 mL/min/1.73 m2) 1.08 (0.93-1.25) 0.328 0.81 (0.71-0.92) 0.001
Microalbuminuria 1.75 (1.35-2.26) <0.001 0.46 (0.37-0.58) <0.001 Macroalbuminuria 5.64 (3.93-8.11) <0.001 HbA1c≥7% 0.98 (0.77-1.26) 0.902 1.06 (0.86-1.31) 0.588 Triglycerides ≥150 mg/dl 1.23 (0.97-1.56) 0.090 1.13 (0.92-1.40) 0.237 HDL <40M <50F mg/dL 1.09 (0.86-1.39) 0.474 1.28 (1.04-1.58) 0.021 LDL ≥100 mg/dL 0.93 (0.74-1.17) 0.557 1.19 (0.98-1.46) 0.085 Non-proliferative retinopathy 1.17 (0.86-1.58) 0.325 1.42 (1.08-1.87) 0.011 Proliferative retinopathy 1.56 (1.05-2.31) 0.027 1.90 (1.30-2.79) 0.001 Lipid-lowering treatment 0.84 (0.66-1.06) 0.139 0.94 (0.77-1.16) 0.565 Antihypertensive treatment 2.18 (1.18-4.02) 0.013 1.10 (0.69-1.74) 0.689
Treatment with ACE-Is/ARBs 0.93 (0.66-1.31) 0.675 1.05 (0.77-1.41) 0.774
Standard Deviation Systolic BP (mmHg) 1.00 (0.99-1.02) 0.630 1.01 (0.99-1.02) 0.468
Standard Deviation Diastolic BP (mmHg) 1.03 (1.00-1.07) 0.078 1.02 (0.99-1.05) 0.300
Aspirin 0.94 (0.74-1.18) 0.585 1.01 (0.82-1.24) 0.923
Antidiabetic therapy
Diet 0.84 (0.45-1.57) 0.590 1.28 (0.78-2.11) 0.329
Oral antidiabetic drugs 1.00 1.00
Oral antidiabetic drugs and insulin 1.02 (0.75-1.38) 0.908 1.36 (1.04-1.78) 0.025
Insulin 0.95 (0.71-1.28) 0.748 1.21 (0.93-1.58) 0.151
Group ATRH and BPC
No ATRH and BPC 1.00 1.00
No ATRH and No BPC 0.85 (0.59-1.23) 0.387 1.30 (0.94-1.81) 0.111
ATRH and BPC 1.60 (0.90-2.85) 0.109 0.66 (0.37-1.18) 0.158
ATRH and No BPC 0.86 (0.58-1.29) 0.469 1.53 (1.08-2.18) 0.017
Fig. 4. Odds Ratios with 95% confidence interval of reaching eGFR reduction >30% from baseline on the basis of time-updated mean SBP in patients with and without aTRH. Patients were grouped into 10 mmHg subsets (i.e. those between 136 and 144 in the group labelled 140 and so on). The subset of patients with No-aTRH and 140 mmHg SBP was taken as the reference group. ATRH, apparent treatment resistant hypertension.
Discussion
This is, to our knowledge, the largest cohort study conducted so far to investigate the role of aTRH on renal disease progression in T2D patients with CKD.
The prevalence of aTRH we report here is higher than that recently recorded in the same Registry (33% vs 17%) in diabetic hypertensive patients with normal renal function. As expected, lower eGFR and higher BMI values are independently associated with aTRH. Our data are in keeping with those from the REGARDS study [23] and more recently from the CRIC study, showing that in CKD patients with T2D, the degree of GFR reduction is a major correlate/determinant of the presence of aTRH. In the present study, there was a 17% greater occurrence of aTRH for every 10 mL/min per 1.73 m2 reduction in eGFR. Moreover, in line with the hypothesis that aTRH is a typical feature of a high risk condition, patients with aTRH were more likely to be prescribed a greater and more articulated treatment including ASA and insulin.
One of the main findings of our study is that the presence of ATRH was independently related to a significantly greater risk of a eGFR loss >30% over the study period.
Recently, two large multicenter, prospective studies reported on the prognostic significance of resistant hypertension in CKD populations [24-25]. In the Masterplan study, de Beus et al. [24] evaluated 788 CKD patients (24% with diabetes) with a mean eGFR of 38±15 mL/min per 1.73 m2. The prevalence of RH was 34% and nearly 27% of patients with RH reached end-stage renal disease showing during 5.3 years of follow-up. RH was associated with a 2.3-fold higher risk of end-stage renal disease and 1.5-fold higher risk for composite renal endpoint including death, initiation of dialysis or kidney transplantation.
Similarly, in the CRIC (Chronic Renal Insufficiency Cohort) Study the prevalence of aTRH was 40% among the 3367 CKD patients (52% with diabetes) with an eGFR of 20 to 70 mL/ min per 1.73 m2 [25]. Subjects with resistant hypertension had a poorer prognosis, and a 28% higher risk of experiencing a renal complication (defined as 50% decrease in eGFR or renal transplantation or start of long-term renal dialysis) after 5 years of follow-up.
Despite some differences in the definition of RH, the above reported studies together with the present one consistently show that aTRH is a very frequent concomitant of CKD and entails an unfavorable renal outcome as compared to non aTRH.
A further, more innovative result of our study deals with the analysis of outcomes on the basis of different time-updated blood pressure levels.
Fig. 5. Odds Ratios with 95% confidence interval of reaching the endpoint albuminuria worsening on the basis of time-updated mean SBP in patients with and without aTRH. Patients were grouped into 10 mmHg subsets (i.e. those between 136 and 144 in the group labelled 140 and so on). The subset of patients with No-aTRH and 140 mmHg SBP was taken as the reference group. ATRH, apparent treatment resistant hypertension.
Egan and coll. reported that in a large cohort of more than 100 000 hypertensive adults followed for a mean period of 3.9 years [15] those patients with aTRH who achieved tight BP control (as compared to usual one) showed an unfavourable CV outcome. These data were only partially confirmed by a more recent publication from the SMART study, conducted in hypertensive patients with clinically manifest vascular disease, wherein the Authors reported an increase in cardiovascular and all-cause mortality in association with aRH independently of BP control [26].
The present study is, to our knowledge, the first one to assess in a real world setting, the relationship between specific time-updated BP levels and renal progression in the presence or absence of aTRH. Our data show that while in patients without aTRH, achieving and maintaining recommended BP values over time does not impact on renal outcome, in the presence of RH a very tight time-updated blood pressure control is associated with a significantly worse renal prognosis.
Several RCTs have previously investigated the effect of different degrees of BP reduction on renal outcome in non-diabetic CKD patients with [27, 28] or without proteinuria [29]. More recently, the SPRINT trial, evaluated the effects of achieving a very tight SBP target (i.e. <120) or a standard one (i.e. <140 mmHg) on cardiovascular and renal outcomes over a 3-year follow-up period in a cohort of non-diabetic high risk individuals, including a large subgroup of CKD patients with minimal proteinuria. All these trials failed to show that achieving lower BP targets may provide reduction in eGFR decline or ESRD events, except for a post hoc analysis conducted in the subgroup of those with overt proteinuria.
As for patients with diabetes, the ACCORD BP trial included only a small number of individuals with CKD, therefore its results may have limited applicability to patients with renal impairment [30].
Thus, our data may provide new insights to understand the inconsistency of the paradoxical relationship between BP reduction and renal morbidity, the so called J curve phenomenon, which has been reported in some although not all previously published studies.
Our results support the hypothesis of a decreased tolerance to lower BP in subgroups at high vascular risk. This may be the result of pathologic changes in vascular structure such as arteriolar endothelial dysfunction, hyaline arteriosclerosis and myointimal hyperplasia [31– 32], which lead to compromised vascular autoregulation and thus a limited ability to adapt to BP fluctuations [33]. As a matter of fact, a paradoxical increased in target organ morbidity at very low blood pressure levels is mostly observed in elderly patients and in individuals with comorbidities such as CKD, diabetes or atherosclerosis [34], clinical conditions well known for being associated with aTRH [15, 24]. (Figures 4A and B). Our data support the view that the lowest BP possible is not necessarily the optimal target for CKD patients although it is not possible to rule out some effect of reverse causality and suggest that de prescribingcould be considered at least in a subset of patients.
Only a minority (i.e. about fifteen percent of the whole study group) of our patients could be defined as controlled according to our time-updated criteria, a rather disappointing figure which is in line with previous literature [35] and confirms the well-known notion that the reduction of renal function goes along with more severe hypertension. From a clinical perspective these data call attention to the opportunity of intensifying BP lowering treatment, possibly with a greater use of diuretics to improve cardiovascular and renal outcome in this high-risk patients population as suggested by International Guidelines [20-21]. However, under an intensified therapeutic regimen most of these patients would automatically be reclassified as having aTRH, a condition which paradoxically entails a worse outcome. Both subgroups with/without aTRH show an increased renal risk at comparably high BP levels. While for many non aTRH patients with poorly controlled hypertension, up-titration of treatment would translate into being re-classified as aTRH, at the same time it might bring about further reduction in BP (i.e. better therapeutic control and therefore betteroutcome). Thus, aTRH seems to represent a high risk condition, only partly modifiable by antihypertensive treatment.
With regards to renal outcome, it is interesting to note that our study cohort, which was exclusively composed of diabetic patients with different degrees of proteinuria, showed a much faster rate of renal function deterioration than that recorded in non-diabetic mostly non proteinuric ckd patients participating in the SPRINT trial [36]. In fact, the yearly loss of mean eGFR recorded in our aTRH patients under real life clinical condition was (-0.99 ml/ min per 1.73 m2), a figure almost double than that observed in non aTRH patients (-0.55 ml/min per 1.73 m2) and three times greater than what recorded in SPRINT in patients randomized to standard treatment (-0.32 ml/min per 1.73 m2). These findings once again emphasize that one should be cautious when extending (applying) results obtained from RCTs to different clinical phenotypes under “real-world” clinical settings.
A further important finding of the present study relates to the relationship between aTRH and changes in BP and albuminuria over time. We observed a trend toward greater albuminuria reduction in patients reaching the lowest BP values. These results are in line with those of previous studies [36, 37]. In fact, the group treated more intensively in the SPRINT study [36] had significantly lower urinary ACR levels throughout the follow-up period, a finding consistent with results from the AASK trial [37], in which proteinuria decreased by 17% in the lower BP group and increased by 7% in the standard BP group.
We also recorded an association between reduction in albuminuria and lack of improvement or even faster deterioration in kidney function in patients with very tight BP control, a finding that casts some doubts on the usefulness of looking at changes in albuminuria as intermediate end point in renal outcome trials. While similar results have previously been reported in several intervention trials [38-40] our data should be taken with caution in this context as the observational nature of our study prevents us from establishing a cause-effect relationship. Nonetheless, we believe our results contribute to clarify the complex pathogenetic mechanisms underlying the renal function blood pressure relationship and point toward the need of defining individualized BP target at least in frail, comorbid patients, for whom the lower does not always means the better when it comes to BP levels. Furthermore, the modality (RAAS-inhibition, diuretics, anti-aldosteron, etc.) and the target of intervention to lower BP in patients with ATRH with the aim to improve cardiovascular and renal outcomes should be further investigated in future prospective studies.
Strength and Limitations
Our study has some limitations as well as several strengths that should be mentioned. Among the first ones, we must acknowledge that laboratory parameters, including serum creatinine, were not measured in a single, centralized laboratory and this may have led to some variability in GFR estimation. We did not gather information on specific dosage of antihypertensive medications prescribed to each patient to confirm diagnosis of aTRH. However, BP control significantly improved, on average, over the 4-year study period suggesting an attempt toward a therapeutic strategy of up-titration to maximum tolerated dose. We could not perform Ambulatory Blood Pressure Monitoring in our study patients and therefore we lack data about individual haemodynamic load and circadian BP behaviour. Furthermore, our data may not be applicable to the population with T2D, HT and CKD at large as the vast majority of participants were of white origin and ethnicity has previously been shown to bear some impact on the risk of developing renal complications [41]. Finally, we did not have information on extra-renal complications such as myocardial infarction and stroke, which may affect BP or renal function changes overtime. On the other hand, the large size and homogeneous clinical characteristics of study cohort as well as the representative geographical distribution of the recruiting centers and the relatively long follow-up period, do contribute to make our results a reliable representation of real-life clinical condition. Moreover, at variance with several previous studies on the impact of RH on CV and renal outcomes (10-15), we used a very accurate definition of RH, which included the use of diuretics. Another strength of our work is the use of time-updated BP values as indicator of achievement and maintenance of blood pressure control over time.
Conclusion
In patients with stage 3 CKD the presence of aTRH entails a faster loss of eGFR over a four-year follow-up period. In patients with aTRH, achievement and maintenance of recommended BP values is associated with a worse renal prognosis despite greater albuminuria reduction. Thus, aTRH seems to be associated with a burden of risk modifiable only in part by BP reduction. Further studies are clearly needed to investigate the pathophysiological mechanism underlying the effect of BP reduction per se as well as different pharmacologic strategies on renal outcome in high risk hypertensive patients such as those with diabetes and CKD.
Disclosure Statement
Results presented in this paper have not been published previously in whole or part, except in abstract format.
The authors declare they have no conflicts of interest regarding the publication of this article.
Acknowledgements
The authors acknowledge the Associazione Medici Diabetologi that has provided financial support for this research.
Each author contributed important intellectual content during manuscript drafting or revision and approved the final version to be published, have met the criteria for authorship as established by the International Committee of Medical Journals Editors, believe that the paper represents honest work, and are able to verify the validity of the results reported. In detail each author contributed to the manuscript as follows: research idea and study design: FV, SDC, RP, GR; PF; EG; data analysis/interpretation: FV, SDS, RP; statistical analysis: PG.
References
1 Sarafidis PA, Bakris GL: Resistant hypertension: an overview of evaluation and treatment. J Am Coll Cardiol.
2008;52:1749-1757.
2 Calhoun DA, Jones D, Textor S, Goff DC, Murphy TP, Toto RD, White A, Cushman WC, White W, Sica
D, Ferdinand K, Giles TD, Falkner B, Carey RM: American Heart Association Professional Education Committee: Resistant hypertension: Diagnosis, evaluation, and treatment: A scientific statement from the American Heart Association Professional Education Committee of the Council for High Blood Pressure Research. Circulation 2008;117:e510-e526,
3 Braam B, Taler SJ, Rahman M, Fillaus JA, Greco BA, Forman JP, Reisin E, Cohen DL, Saklayen MG, Hedayati SS:
Recognition and Management of Resistant Hypertension. Clin J Am Soc Nephrol 2017;12:524-535.
4 De Nicola L, Gabbai FB, Agarwal R, Chiodini P, Borrelli S, Bellizzi V, Nappi F, Conte G, Minutolo R: Prevalence
and prognostic role of resistant hypertension in chronic kidney disease patients. J Am Coll Cardiol 2013;61:2461-2467.
5 Wolley MJ, Stowasser M. Resistant Hypertension and Chronic Kidney Disease: a Dangerous Liaison: Curr
6 Rossignol P, Massy ZA, Azizi M, Bakris G, Ritz E, Covic A, Goldsmith D, Heine GH, Jager KJ, Kanbay M, Mallamaci F, Ortiz A, Vanholder R, Wiecek A, Zoccali C, London GM, Stengel B, Fouque D; ERA-EDTA EURECA-m working group; Red de Investigación Renal (REDINREN) network, et al.: The double challenge of resistant hypertension and chronic kidney disease. Lancet 2015;386:1588-1598.
7 Padwal RS, Rabkin S, Khan N: Assessment and management of resistant hypertension. CMAJ
2014;186:E689-697.
8 Irvin MR, Shimbo D, Mann DM, Reynolds K, Krousel-Wood M, Limdi NA, Lackland DT, Calhoun DA, Oparil
S, Muntner P: Prevalence and correlates of low medication adherence in apparent treatment-resistant hypertension. J Clin Hypertens (Greenwich) 2012;14:694-700.
9 Bangalore S, Fayyad R, Laskey R, Demicco DA, Deedwania P, Kostis JB, Messerli FH; Treating to New Targets
Steering Committee and Investigators: Prevalence, predictors, and outcomes in treatment-resistant hypertension in patients with coronary disease. Am J Med 2014;127:71-81.
10 Irvin MR, Booth JN III, Shimbo D, Lackland DT, Oparil S, Howard G, Safford MM, Muntner P, Calhoun DA: Apparent treatment-resistant hypertension and risk for stroke, coronary heart disease, and all-cause mortality. J Am Soc Hypertens 2014;8:405-413.
11 Daugherty SL, Powers JD, Magid DJ, Tavel HM, Masoudi FA, Margolis KL, O’Connor PJ, Selby JV, Ho PM: Incidence and prognosis of resistant hypertension in hypertensive patients. Circulation 2012;125:1635-1642.
12 Sim JJ, Bhandari SK, Shi J, Reynolds K, Calhoun DA, Kalantar-Zadeh K, Jacobsen SJ: Comparative risk of renal, cardiovascular, and mortality outcomes in controlled, uncontrolled resistant, and nonresistant hypertension. Kidney Int 2015;88:622-632.
13 Smith SM, Gong Y, Handberg E, Messerli FH, Bakris GL, Ahmed A, Bavry AA, Pepine CJ, Cooper-Dehoff RM: Predictors and outcomes of resistant hypertension among patients with coronary artery disease and hypertension. J Hypertens 2014;32:635-643.
14 Egan BM, Kai B, Wagner CS, Henderson JH, Chandler AH, Sinopoli A: Blood Pressure Control Provides Less Cardiovascular Protection in Adults With Than Without Apparent Treatment-Resistant Hypertension. J Clin Hypertens (Greenwich) 2016;18:817-824.
15 Egan BM, Kai B, Wagner CS, Fleming DO, Henderson JH, Chandler AH, Sinopoli A: Low Blood Pressure Is Associated With Greater Risk for Cardiovascular Events in Treated Adults With and Without Apparent Treatment-Resistant Hypertension. J Clin Hypertens (Greenwich) 2017;19:241-249.
16 Böhm M, Schumacher H, Teo KK, Lonn EM, Mahfoud F, Mann JF, Mancia G, Redon J, Schmieder RE, Sliwa K, Weber MA, Williams B, Yusuf S: Achieved blood pressure and cardiovascular outcomes in high-risk patients: results from ONTARGET and TRANSCEND trials. Lancet 2017;389:2226-2237.
17 Nicolucci A, Rossi MC, Arcangeli A, Cimino A, de Bigontina G, Fava D, Gentile S, Giorda C, Meloncelli I, Pellegrini F, Valentini U, Vespasiani G, AMD-Annals Study Group: Four-year impact of a continuous quality improvement effort implemented by a network of diabetes outpatient clinics: the AMD-Annals initiative. Diabet Med 2010;27:1041-1048.
18 De Cosmo S, Rossi MC, Pellegrini F, Lucisano G, Bacci S, Gentile S, Ceriello A, Russo G, Nicolucci A, Giorda C, Viazzi F, Pontremoli R; AMD-Annals Study Group: Kidney dysfunction and related cardiovascular risk factors among patients with type 2 diabetes. Nephrol Dial Transplant 2014;29:657-662.
19 De Cosmo S, Viazzi F, Pacilli A, Giorda C, Ceriello A, Gentile S, Russo G, Rossi MC, Nicolucci A, Guida P, Feig D, Johnson RJ, Pontremoli R; AMD-Annals Study Group: Serum uric acid and risk of CKD in type 2 diabetes. Clin J Am Soc Nephrol 2015;10:1921-1929.
20 Levey AS, Stevens LA, Schmid CH, Zhang YL, Castro AF 3rd, Feldman HI, Kusek JW, Eggers P, Van Lente F, Greene T, Coresh J; CKD-EPI (Chronic Kidney Disease Epidemiology Collaboration): A new equation to estimate glomerular filtration rate: Ann Intern Med 2009;150:604-612.
21 James PA, Oparil S, Carter BL, Cushman WC, Dennison-Himmelfarb C, Handler J, Lackland DT, LeFevre ML, MacKenzie TD, Ogedegbe O, Smith SC Jr, Svetkey LP, Taler SJ, Townsend RR, Wright JT Jr, Narva AS, Ortiz E: 2014 evidence-based guideline for the management of high blood pressure in adults: report from the panel members appointed to the Eighth Joint National Committee (JNC 8): JAMA 2014;311:507-520.
22 Weber MA, Schiffrin EL, White WB, Mann S, Lindholm LH, Kenerson JG, Flack JM, Carter BL, Materson BJ, Ram CV, Cohen DL, Cadet JC, Jean-Charles RR, Taler S, Kountz D, Townsend R, Chalmers J, Ramirez AJ, Bakris GL, Wang J, et al.: Clinical practice guidelines for the management of hypertension in the community a statement by the American Society of Hypertension and the International Society of Hypertension. J Hypertens 2014;32:3-15.
23 Tanner RM, Calhoun DA, Bell EK, Bowling CB, Gutiérrez OM, Irvin MR, Lackland DT, Oparil S, McClellan W, Warnock DG, Muntner P: Incident ESRD and treatment-resistant hypertension: the reasons for geographic and racial differences in stroke (REGARDS) study. Am J Kidney Dis 2014;63:781-788.
24 de Beus E, Bots ML, van Zuilen AD, Wetzels JF, Blankestijn PJ, MASTERPLAN Study Group: Prevalence of Apparent Therapy-Resistant Hypertension and Its Effect on Outcome in Patients With Chronic Kidney Disease. Hypertension 2015;66:998-1005.
25 Thomas G, Xie D, Chen HY, Anderson AH, Appel LJ, Bodana S, Brecklin CS, Drawz P, Flack JM, Miller ER 3rd, Steigerwalt SP, Townsend RR, Weir MR, Wright JT Jr, Rahman M, CRIC Study Investigators: Prevalence and Prognostic Significance of Apparent Treatment Resistant Hypertension in Chronic Kidney Disease: Report From the Chronic Renal Insufficiency Cohort Study. Hypertension 2016;67:387-396.
26 van der Sande NGC, de Beus E, Bots ML, Voskuil M, Blankestijn PJ, Visseren F, Spiering W, SMART study group: Apparent resistant hypertension and the risk of vascular events and mortality in patients with manifest vascular disease. J Hypertens 2018;36:143-150
27 Sarnak MJ, Greene T,Wang X, Beck G, Kusek JW, Collins AJ, Levey AS: The effect of a lower target blood pressure on the progression of kidney disease: long-term follow-up of the modification of diet in renal disease study. Ann Intern Med 2005;142:342-351.
28 Ruggenenti P, Perna A, Loriga G, Ganeva M, Ene-Iordache B, Turturro M, Lesti M, Perticucci E, Chakarski IN, Leonardis D, Garini G, Sessa A, Basile C, Alpa M, Scanziani R, Sorba G, Zoccali C, Remuzzi G, REIN-2 Study Group: Blood-pressure control for renoprotection in patients with non-diabetic chronic renal disease (REIN-2): multicentre, randomised controlled trial. Lancet 2005;365:939-946.
29 Appel LJ, Wright JT Jr, Greene T, Agodoa LY, Astor BC, Bakris GL, Cleveland WH, Charleston J, Contreras G, Faulkner ML, Gabbai FB, Gassman JJ, Hebert LA, Jamerson KA, Kopple JD, Kusek JW, Lash JP, Lea JP, Lewis JB, Lipkowitz MS, et al.: Intensive blood-pressure control in hypertensive chronic kidney disease. N Engl J Med 2010;363:918-929.
30 ACCORD Study Group, Cushman WC, Evans GW, Byington RP, Goff Jr DC, Grimm Jr RH, Cutler JA, Simons-Morton DG, Basile JN, Corson MA, Probstfield JL, Katz L, Peterson KA, Friedewald WT, Buse JB, Bigger JT, Gerstein HC, Ismail-Beigi F: Effects of intensive blood-pressure control in type 2 diabetes mellitus. N Engl J Med 2010;362:1575-1585.
31 Bidani AK, Griffin KA, Williamson G, Wang X, Loutzenhiser R: Protective importance of the myogenic response in the renal circulation. Hypertension 2009;54:393-398.
32 Hayashi K, Epstein M, Saruta T: Altered myogenic responsiveness of the renal microvasculature in experimental hypertension. J Hypertens 1996;14:1387-1401.
33 Palmer BF: Impaired renal autoregulation: implications for the genesis of hypertension and hypertension-induced renal injury. Am J Med Sci 2001;321:388-400.
34 Abuelo JG: Normotensive ischemic acute renal failure. N Engl J Med 2007;357:797-805.
35 Plantinga LC, Miller ER 3rd, Stevens LA, Saran R, Messer K, Flowers N, Geiss L, Powe NR; Centers for Disease Control and Prevention Chronic Kidney Disease Surveillance Team: Blood pressure control among persons without and with chronic kidney disease: US trends and risk factors 1999-2006. Hypertension 2009;54:47-56.
36 Cheung AK, Rahman M, Reboussin DM, Craven TE, Greene T, Kimmel PL, Cushman WC, Hawfield AT, Johnson KC, Lewis CE, Oparil S, Rocco MV, Sink KM, Whelton PK, Wright JT Jr, Basile J, Beddhu S, Bhatt U, Chang TI, Chertow GM, et al.: SPRINT Research Group. Effects of Intensive BP Control in CKD. J Am Soc Nephrol 2017;28:2812-2823.
37 Wright JT Jr, Bakris G, Greene T, Agodoa LY, Appel LJ, Charleston J, Cheek D, Douglas-Baltimore JG, Gassman J, Glassock R, Hebert L, Jamerson K, Lewis J, Phillips RA, Toto RD, Middleton JP, Rostand SG, African American Study of Kidney Disease and Hypertension Study Group: Effect of blood pressure lowering and antihypertensive drug class on progression of hypertensive kidney disease: results from the AASK trial. JAMA 2002;288:2421-2431.
38 Mann JF, Schmieder RE, McQueen M, Dyal L, Schumacher H, Pogue J, Wang X, Maggioni A, Budaj A, Chaithiraphan S, Dickstein K, Keltai M, Metsarinne K, Oto A, Parkhomenko A, Piegas LS, Svendsen TL, Teo KK, Yusuf S: Renal outcomes with telmisartan, ramipril, or both, in people at high vascular risk (the ONTARGET study): a multicentre, randomised, double-blind, controlled trial. Lancet 2008;372:547-553. 39 Parving HH, Brenner BM, McMurray JJ, de Zeeuw D, Haffner SM, Solomon SD, Chaturvedi N, Persson F, Desai
AS, Nicolaides M, Richard A, Xiang Z, Brunel P, Pfeffer MA: Cardiorenal end points in a trial of aliskiren for type 2 diabetes. N Engl J Med 2012;367:2204-2213.
40 Fried LF, Emanuele N, Zhang JH, Brophy M, Conner TA, Duckworth W, Leehey DJ, McCullough PA, O’Connor T, Palevsky PM, Reilly RF, Seliger SL, Warren SR, Watnick S, Peduzzi P, Guarino P: Combined angiotensin inhibition for the treatment of diabetic nephropathy. N Engl J Med 2013;369:1892-1903.
41 Bhalla V, Zhao B, Azar KM, Wang EJ, Choi S, Wong EC, Fortmann SP, Palaniappan LP: Racial/ethnic differences in the prevalence proteinuric and nonproteinuric diabetic kidney disease. Diabetes Care 2013;36:1215-1221.