UNIVERSITÀ DEGLI STUDI DELLA TUSCIA DI VITERBO
Department of Agriculture, Forests, Nature and Energy (DAFNE)
PhD Course
Sciences and Technologies for Forest and Environmental Management - XXV Cycle
Reconstruction of vegetation history in central Italy through a
palynological approach. A case of study from Lago Lungo
(Rieti basin)
s.s.d. AGR/05
PhD candidate:
Irene Tunno
Signature ……….
PhD Course Coordinator Tutors
Prof.ssa Rosanna Bellarosa
Prof. Gianluca Piovesan
Signature ………
Signature………
Prof. Scott A. Mensing
Signature………
“…Dandomi ancora la gioia infinita di entrare in porti sconosciuti prima…”
(F.Guccini)
Abstract
Lake sediments record climatic and ecological changes taking place at the time of their deposition. These changes are recorded as stratigraphic variations of physical and chemical properties and changes in species composition of plant and animal remains. Palynological studies provide consistent information of changes that occurred in a particular area especially where many historical documents are available. High-resolution reconstruction of vegetation history can be used to investigate the nature of the past environmental changes, disentangling the effects of climate and human activity on the landscape. A palynological study was carried out in the Rieti basin (Lazio, central Italy). This region has been colonized for millennia, from the pre-Roman period, and strong modifications, both of natural and anthropogenic origin, have occurred through time. Three sediment cores collected from Lake Lungo (371 m. a.s.l.) have been analyzed for a total length of 15 m.
Five zones, related to different phases in the evolution of the landscape, have been identified along the cores: an early period (zone 1; 2700-2040 yr BP; 680-30 BCE) characterized by woodlands, showing a natural system with a variety of natural tree species (e.g. Quercus, Fagus, Tilia, Acer) and few indicators of human activity; a second phase (zone 2; 2040-1150 yr BP; 30 BCE-870 CE) in which the human impact becomes more evident, as underlined by the increase of indicators of disturbance like herbs, Poaceae, ferns and charcoal; a third period (zone 3; 1150-600 yr BP; 870-1410 CE) showing the maximum rate of human impacts for the entire core: forest cover decreases abruptly while indicators of disturbance increase rapidly, indicating a high level of erosion linked to intensive deforestation; a forested phase (zone 4 600-210 yr BP; 1410-1800 CE) testifies the rapid forest recovery after a very intensive period of utilization (zone 3) facilitated by the decreased anthropogenic pressure and more favorable climatic conditions (cold and wet); a final phase (zone 5; 210-20 yr BP; 1800-2000 CE) representing the modern period, is characterized by a continuous but less dense forest cover together with high percentage of Poaceae, herbs and cultivated trees.
Climatic and anthropogenic signals have been identified throughout the responses of the vegetation under different pressures. Deforestation occurred during warm phases while woodland regeneration occurred during cold phases. At the same time the re-expansion of forest has been favored during wet periods when attempts to drain the Rieti basin have not been effective, reducing the human impact on the landscape. Historical documents have been used to support the palynological data indicating how particularly useful written records can be used in supporting paleoecologic research. The results of this study, different from other research, have provided a high-resolution reconstruction of the vegetation history for the last 2700 years.
Key words: pollen analysis; palaeoenvironmental reconstruction; landscape history; climatic changes; forest history Riassunto
I sedimenti lacustri registrano i cambiamenti climatici ed ecologici che avvengono al momento della loro deposizione. Tali cambiamenti sono registrati come variazioni stratigrafiche delle proprietà fisiche e chimiche e delle variazioni nella composizione specifica di resti di piante ed animali. Gli studi palinologici forniscono importanti informazioni sulle trasformazioni verificatesi in una data area, in particolar modo laddove siano disponibili documenti storici. Ricostruzioni ad alta definizione della storia della vegetazione possono essere usate per studiare la natura dei passati cambiamenti ambientali, discriminando gli effetti del clima e dell’attività antropica sul paesaggio. Uno studio palinologico è stato condotto nel bacino di Rieti (Lazio, Italia centrale). Questa regione è stata colonizzata per millenni, fin dal periodo pre-Romano e importanti modicazioni, sia di origine naturale che antropica, si sono verificate nel tempo. Tre carote di sedimenti campionate a Lago Lungo (371 m s.l.m.) sono state analizzate per una lunghezza totale di 15 m. Cinque zone, corrispondeti a diverse fasi dell’evoluzione del paesaggio, sono state identificate lungo le carote: il primo periodo (zona 1; 2700-2040 anni fa; 680-30 a.C.) è caratterizzato dalla foresta, con la presenza di varie specie arboree naturali (es. Quercus, Fagus, Tilia, Acer) e pochi indicatori di attività umana; una seconda fase (zona 2; 2040-1150 anni fa; 30 a.C.-870 d.C.)in cui l’impatto umano diviene più evidente, come sottolineato dall’aumento degli indicatori di disturbo come le Poaceae, felci e carbone; un terzo periodo (zona 3; 1150-600 anni fa; 870-1410 d.C.) che mostra il massimo livello di antropizzazione dell’intera carota: la copertura forestale diminuisce rapidamente mentre gli indicatori di disturbo aumentano repentinamente, indicando un alto tasso di erosione legato all’intensa deforestazione; una fase di riforestazione (zona 4; 600-210 anni fa, 1410-1800 d.C.) testimonia il rapido recupero della foresta dopo il periodo di intenso sfruttamento (zona 3), favorito dalla dimuita pressione antropica e da condizioni climatiche più favorevoli (freddo e umido); la fase finale (zona 5; 210-20 anni fa, 1800-2000 d.C.) rappresenta il periodo moderno, caratterizzato da una continua ma meno densa copertura forestale, insieme ad una maggiore frequenza di Poaceae, specie erbacee e alberi coltivati.
I segnali climatici ed antropici sono stati individuati attraverso la risposta della vegetazione a diversi livelli di pressione. La deforestazione è avvenuta durante le fasi calde, mentre la rigenerazione del bosco durante quelle fredde. Allo stesso tempo la ripresa della foresta è stata favorita durante i periodi umidi, che rendevano vani o meno efficaci i tentativi di drenaggio del bacino di Rieti, riducendo l’impatto antropico sul paesaggio. Documenti storici sono stati utilizzati per supportare le informazioni evidenziate dai dati palinologici, rivelandosi particolamente utili in questo tipo di ricerche. I risultati di questo studio, diversamente da altre ricerche, hanno fornito una ricostruzione ad alta definizione della storia della vegetazione degli ultimi 2700 anni.
Parole chiave: analisi pollinica; ricostruzione paleoambientale; storia del paesaggio; cambiamenti climatici; storia forestale
INDEX
INTRODUCTION ……… 5
Aim of the study ……… 7
MATERIALS AND METHODS ……… 9
Study area ……… 9
Vegetation ……… 9
Sediment coring ……… 10
Rock magnetism - Paleomagnetic Secular Variation and Susceptibility ………….. 11
PSV sampling ……… 12
Correlation of cores ……… 13
Radiocarbon dating ……… 13
Pollen analysis ……… 14
Percent Total Organic Matter ……… 15
Statistical analysis ……… 15 RESULTS ……… 16 Chronology ……… 16 Age model ……… 16 Sediments ……… 17 Pollen ……… 17 DISCUSSION ……… 21 CONCLUSION ……… 29 REFERENCES ……… 30 FIGURES ……… 38 AKNOWLEDGEMENTS
INTRODUCTION
Many natural systems are dependent on climate and where evidence of such systems in the past still exists, they can be used to derive paleoclimatic information (Bradley, 1999). Human interaction with the environment is also recorded in natural systems. In this sense, lake sediments represent a historical archive where climatic and anthropogenic events are preserved. Lake sediments contain a record of climatic and ecological changes taking place at the time of their deposition. These changes are recorded as stratigraphic variations of physical and chemical properties and changes in species composition of plant and animal remains. Throughout the years animal and vegetal remains, grains from different materials, dust, and pollen settle to the bottom of the lake where they are preserved in anaerobic conditions together with all the materials carried by streams flowing into the lake. In addition strong event such as floods, earthquakes, or landslides may affect the system (Filippi and Festi, 2005). Most changes are associated with natural processes, such as environmental variations in the lake or climatic changes; however, these natural processes may be interrupted by human-induced changes, in particular, overloading of the system by biogenic substances (Buzkco et al., 2009). High-resolution reconstruction of vegetation history can be used to investigate the nature of the past environmental changes to understand the causes of the changes of both natural or/and anthropogenic origin.
Many different scenarios have been predicted for the future, from a global drought to another glaciation (IPCC, 2007); understanding how vegetation and human societies have responded to changes that occurred in the past, could provide us with precious clues on how modern societies as well as vegetation could be affected by different potential scenarios of climatic change in the future. In particular it is of particular importance to know what measures communities may have taken to increase their resilience to environmental changes. Palynological studies have been used to show vegetation and human response in different environments throughout the world; in France, for example, a complete glacial-interglacial cycle has been reconstructed (Woillard, 1978); in Japan an almost 250 m core was palynologically examined covering the last 430,000 years of the mid-Upper Pleistocene and Holocene (Mioyoshi et al., 1999).Infrequent phenomena can also be recorded into lake sediments: the history of a forest over a period of 8,000 years has been studied to reconstruct the impact of hurricanes and the forest regeneration after these catastrophic events in Nicaragua (Urquhart, 2009).
The interactions between human and environment have been mutually correlated throughout the human history. Humans have modified the environment directly (e.g. agriculture, grazing, use of fire) (e.g. Allen in Woodward, 2009) and indirectly (air pollution, global warming) (IPCC, 2001), but at the same time the climatic and environmental conditions have influenced communities. Climatic variability and natural environmental changes can impact human affair as has been demonstrated in paleoenvironmental studies that have shown correlations between climate change and cultural collapse (Diamond, 2005).
Archeologists, anthropologists, and historians underline the important contribution of political events, social changes, and economic development to environmental change (e.g., Cifani, 2002; Aimers, 2011). In the last 2000 years Italy has experienced significant climatic changes that have influenced the socio-economical system (Tinner, 2009; Cifani, 2002). During this period the Italian territory has been controlled through a number of different structures, passing from a strong centralized government under the Romans to the municipalities in the Medieval time together with the remarkable importance of monasteries in the management of the landscape. Due to the diligence of monasteries and municipalities Italy offers an incredible amount of written documents and other forms of well-preserved records that have been maintained through time.
Palaeoenvironmental records can be used to reconstruct the original natural vegetation cover, providing valuable insights for nature conservation and protection (Tinner et al., 2009). Integrating data from sedimentary records with historical and archeological perspectives may provide insight into the resilience and sustainability of communities in the past that may still be relevant within the modern system (Dearing et al., 2007). Because of its extension, geographical position and climate, the Mediterranean region was the scenario for the development of some of the earliest civilizations. Humans began to alter the Mediterranean ecosystem beginning about 10,000 years ago in the eastern part, while in the western part human impacts started about 7,500 to 7,000 years ago (Jalut et al., 2009).
The complex history of cultural-environmental interactions in the Mediterranean basin makes it challenging to separate environmental changes related to climate from human-induced transformations (Roberts et al., 2004).The landscape in this region has been deeply modified throughout this time by human activities. In this context, while the intense utilization of Mediterranean woodlands by the earliest civilizations is well established, the long-term impact of human activities in still debated. Fire and grazing, for example, can be considered disturbances in Mediterranean environments but they have been integral in Mediterranean communities since 10,000 years ago when grazing activities started (Allen, in
Woodward 2009). At the same time extensive cutting, use of fire and grazing animals have been considered by some to be causes of permanently degraded woodlands (McNeil, 1992). Pollen records have identified vegetation disturbances extending back to the emergence of the first organized societies (Roberts et al., 2004) and deforestation has been generally linked directly to population increase (Kaplan et al., 2009) with human activity generally reported as the main trigger for vegetation change (Allen et al., 2002).
Many sites have been investigated in Italy, most of which are located in northern Italy (Magri 2007). Almost all the studies in central Italy have been conducted on volcanic lakes (e.g. Bolsena Lake, Magri 1999; Vico Lake, Magri 1999; Nemi and Albano Lakes, Guilizzoni 2002; Stracciacappa, Giardini 2007), from terrestrial cores collected close to the lake shores. These study report long palynological records during the Holocene but they do not present data for last 2000 years. The present study provides a high resolution reconstruction of vegetation history during the last 2700 years, describing very detailed phases of human-environment interaction. From this point of view the Rieti basin represents a remarkable site for palynological study.
Aim of the study
The history of human interaction with the environment in the Rieti basin is documented by numerous historical and archeological sources (Leggio et al., 1989). As mentioned in Calderoni et al. (1994) the signal of human activities is very strong through time in the Rieti basin. Since Roman time the outcome of human activities has been deeply linked to the conditions and the events of the Marmore threshold that regulates the water regime of the plain. The natural process that influences the growth or decay of the travertine threshold depends on climatic conditions. During humid and warm periods travertine is deposited, while during drier and cooler phases the circulation of hard-water is reduced, causing erosion of the travertine barrier. Since Roman time, human intervention of the barrier has superimposed the effects of natural processes (Carrara et al., 2004 IGC).
In early prehistoric time the small lakes presently found in the basin (Lago Lungo, Ripasottile, Ventina and Piediluco) were part of a unique wider lake named Lacus Velinus that filled the plain creating an extensive wetland. According to existing literature this lake was drained by the Romans in 272 CE by making a cut through the Marmore travertine barrier (Coccia, 1992). During the centuries the wetlands were gradually drained, in particular after the increasing demand of agricultural lands by the local population.
The very well-documented human history of the Rieti basin (e.g. Lorenzetti, 1989) can be compared with a well-developed record of climatic history. Tree-ring records from central Europe have been combined to develop a reconstruction of temperature and precipitation for the last 2400 years (Buntgen et al. 2011). Between ~400 and 1 BCE, climate was considerably wetter than modern with average to above average temperatures. Following a period of generally stable climate, a warm dry period occurred between 200 and 300 CE, followed by a cool, wet phase from about 300 to 450 CE, transitioning to a cold dry climate between 500 and 600 CE. During Medieval time, commonly referred to as the Medieval Warm Period (MWP) from 1000 to ~1350 CE, there were warmer than average temperatures and a generally dry climate in the region (Mann et al., 2009). This was followed by a cold period, The Little Ice Age (LIA), with cold temperatures and generally increased precipitation (Bungten et al., 2011). Periods of colder than modern climate continued until the late 19th century.
The aim of this study is to reconstruct the history of landscape of the Rieti basin through lake sediments using a palynological approach. Vegetation dynamics have been investigated to reconstruct the evolution of the landscape through time. The study focuses on climatic and anthropogenic signals as well. Indicators of natural and anthropogenic systems have been identified with the purpose of identifying periods of vegetation change that can be attributed to either known climatic or human activities, or some combination of the two. The evolution of vegetation after the periods of population decline has also been investigated to better understand the dynamics of vegetation response during the process of renaturalization. Special attention was focused on reconstructing a high-resolution vegetation history for the last three millennia, in order to disentangle the interactions and the effects of socio-economical transformations and climatic and environmental changes over the natural landscape.
MATERIALS AND METHODS
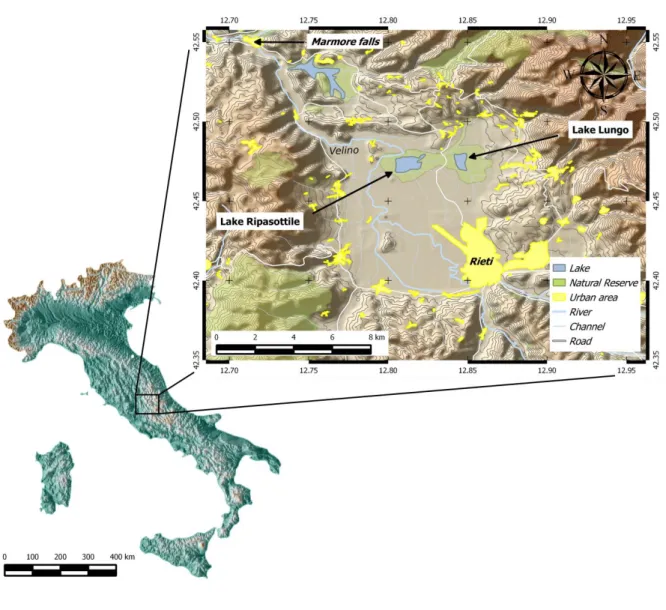
Study area
Lago Lungo (371 m a.s.l., fig. 1) is one of several small lakes in the Rieti Basin drained by the Velino River which plummets over the Marmore falls. The Rieti basin (250 km2) was formed by extensional tectonics during the Late Pliocene (Calderoni et al, 1998). The basin is an intermontane depression in the Apennine Mountains in which the level water is controlled by a travertine sill at the Marmore site (Calderoni, 1994). Lago Lungo is a remnant of an ancient bigger lake named Lacus Velinus. Since Roman time there were many attempts to drain the basin (Coccia et al., 1992) which was, in the lowest part, filled by shallow and wide wetland. Lago Lungo and Lago di Ripasottile represent the deepest part of that ancient lake. Today, these lakes are included in a natural reserve (Riserva naturale Laghi Lungo e Ripasottile). Velino, Salto and Turano are the main rivers flowing through the basin, but water is also contributed from several large perennial springs (Coccia et al., 1992), such as Sorgente di Santa Susanna near the town of Dutri.
Lago Lungo has a surface of 78 ha (Coccia et al, 1992), with an average water depth of 4-5 m, surface temperature of 28°C, 8.2 pH, 295 ppm salinity, 450 ms conductivity, ≥ 240 ppm alkalinity and ≥ 425 ppm hardness (Noble P., personal communication).
Vegetation
The aquatic plants that currently grow on the shore of Lago Lungo are represented by: Lemna trisulca (L.) (star duckweed), Nuphar luteum (L.) (yellow pond lilly), Utricularia vulgaris (L.) (common bladderwort), Lemna minor (L.) (common duckweed), Najas Marina (L.) (spiny naiad), Nymphaea alba (L.) (white waterlily) and Phragmites communis (Cav.) (common reed) (Casella et al., 2009). Salix spp. grow in the humid zones next to the lake. The lake is surrounded by crop fields (Casella, 2009), mainly cultivated with maize, wheat and cereals although they are partially left uncultivated where the recurring floods do not allow agricultural activities. Uncultivated fields are used for grazing (Riccardi, 2006). The hills located to the north of the lake are cultivated with olive trees (Riccardi, 2006).
Temperate deciduous forests characterize the hills and mountains of the basin. These forests are mainly represented by Carpinus betulus (L.) (common hornbeam), Fraxinus spp. (ash), Ulmus campestris (Auct.) (common elm), Quercus pubescens (Willd.) (downy oak), Quercus cerris (L.) (Turkey oak), Carpinus orientalis (Miller) (oriental hornbeam) and Ostrya carpinifolia (Scop.) (hop hornbeam). Mediterranean shrubs and trees like Quercus ilex
(L.) (holly oak), Phyllirea variabilis (L.) (narrow-leaved mock privet), Pinus halepenis (Miller) (Aleppo pine) grow in the foothills. The mountain belt (above 800-900 m) is characterized by Fagus sylvatica (L.) (common beech). Pinus nigra (Arnold) (Austrian pine) is widespread on the mountain areas of this part of Italy mostly because of intensive plantations created at the beginning of the 20th century. This species was first planted in 1912 AD by the forestry department of Rieti with major period for plantations dating to 1920 AD (Federici, 1999).
The origin and evolution of the Rieti basin is related to the post-collisional extensional tectonics that have strongly affected this sector of the Apenninic orogenic belt since the Pliocene (Carrara et al., 2004).The Rieti Basin is filled by continental Plio-Quaternary sediments composed of conglomerates, sands, silts and travertine deposits that reach a thickness of 400-500 m (Manfredini, 1972). During the Last Glacial Maximum (LGM) the Marmore travertine barrier has been cut and deep valleys and canyons formed upstream in the Rieti basin. The climate during the Holocene caused the growth of the Marmore travertine barrier and the present Rieti alluvial plain (Carrara et al., 2004).
Geologically the basin is characterized by three different areas: to the east above 600 m. is mainly composed of limestone; the central area is represented by Pliocene conglomerate while all the western part of the basin surrounding the lake is characterized by alluvial soils (Riccardi, 2006).
Sediment coring
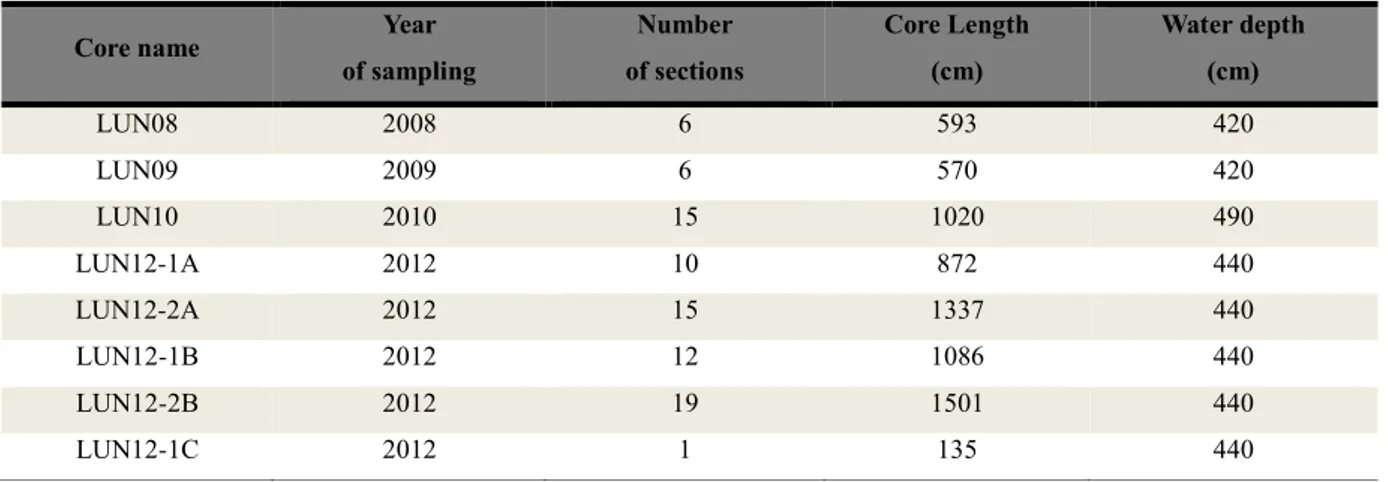
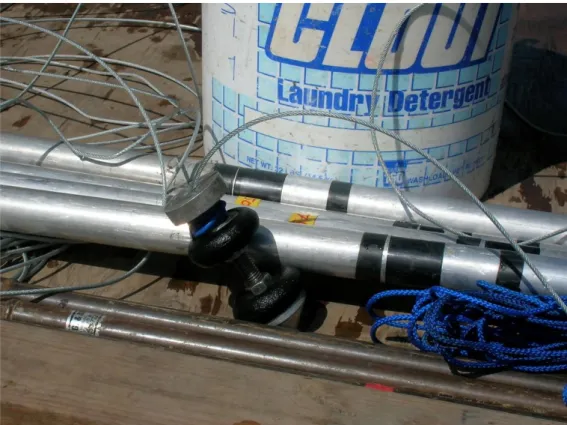
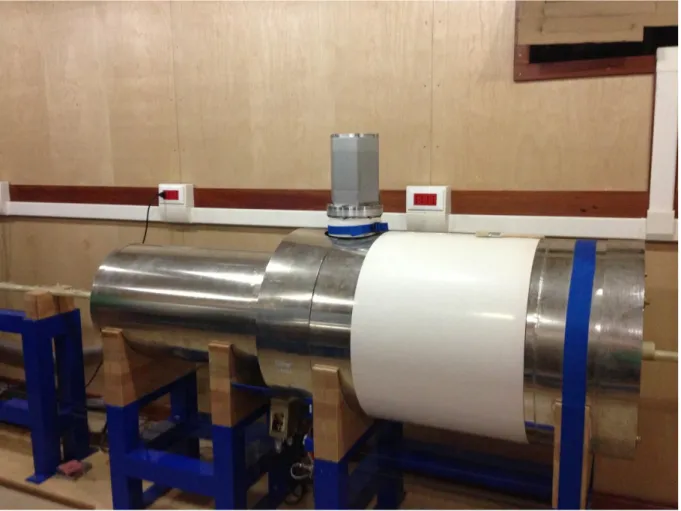
A total of eight sediment cores have been recovered from Lago Lungo since 2008: a 5.93 m core in 2008 (LUN08), a 5.7 m core in 2009 (LUN09), a 10.2 m core in 2010 (LUN10), four long cores in 2012 ranging from 8.72 m to 15.01 m (LUN12-1A, 1B, 2A and 2B) and a 1.35 m long surface core in 2012 that recovered the modern sediment water interface (LUN12-1C) (Table 1). Three cores were used for palynological analysis: LUN09, LUN12-2B and LUN12-1C (570, 1501 and 135 cm long respectively). The cores were sampled in one-meter long sections with a modified square rod Livingstone hand operated corer (fig. 2) from a floating platform (fig. 3a,b) anchored at or near the deepest part of the lake in order to obtain undisturbed sediments. The cores were extruded into PVC cut tubes, labeled, sealed and stored in a refrigerator at 5°C. The surface core (LUN12-1C) was sampled using a clear plastic tube core barrel with a piston. Unconsolidated surface sediments were stabilized in the field by adding Zorbitrol to ~10 cm of water in the barrel.
Core LUN09 was opened, split lengthwise and described for color and gross sedimentary changes in the laboratory at University of Tuscia, Viterbo. Cores LUN12-2A and 2B were opened at the United States National Lacustrine Core Facility (LacCore) in Minneapolis, MN. At LacCore, initial core description included whole core scanning for density, high resolution imagery using an image scanner, and magnetic susceptibility measurement at 0.5 cm increments. Core images were then inspected and used to correlate between cores. Cores LUN12-1A and 1B were taken to the Istituto Nazionale di Geofisica e Vulcanologia (INGV) in Rome for paleomagnetic analysis.
Table 1 – Cores recovered from Lago Lungo over time.
Core name Year
of sampling Number of sections Core Length (cm) Water depth (cm) LUN08 2008 6 593 420 LUN09 2009 6 570 420 LUN10 2010 15 1020 490 LUN12-1A 2012 10 872 440 LUN12-2A 2012 15 1337 440 LUN12-1B 2012 12 1086 440 LUN12-2B 2012 19 1501 440 LUN12-1C 2012 1 135 440
Rock magnetism - Paleomagnetic Secular Variation and Susceptibility
We used magnetic susceptibility to correlate the different cores recovered from Lago Lungo and Paleomagnetic Secular Variation (PSV) to create a chronology for all of the cores. Rock magnetic susceptibility, is a measure of the magnetic signal in sediments typically associated with terrigenous inputs containing magnetite, such as volcanic ash from eruptions, or sand lenses from erosion. Peaks in magnetic susceptibility can be used to establish a local magnetic stratigraphy and to create the base for an absolute chronology especially when multiple cores are available from the same lake (Donadini et al, 2010).
PSV dating methods are based on variations of the Earth's magnetic field. Secular variation describes continuous drift in the intensity and direction of the Earth’s magnetic field (Twyman, 2007). Geologic material like rocks and sediments can record the direction of Earth's magnetic field (Verosub, 2000). The Earth's magnetic field is driven by two principal components: a primary and rather stable dipole field, and a smaller residual non-dipole field, less stable and geographically more variable. The non-dipole field causes minor variations occurring on Earth's magnetic field. Because of the nature of the field and how it is generated, any change in its characteristics will affect the entire terrestrial globe (Bradly, 1999). The
components of the geomagnetic field are declination, inclination and intensity. At least two of them are necessary for reconstructing the geomagnetic field in the past (Donadini et al, 2010). One of the sources of secular variation data is the paleomagnetic record from rapidly deposited sediments, such as those found in lakes, caves and the nearshore marine environment. (Verosub, 1988). The magnetic minerals present in the lake sediments align with the ambient magnetic field originating a net magnetization (Nagata, 1961 in Donadini et al, 2010). The compaction of sediments during the deposition process immobilizes the magnetization and forms a paleomagnetic record (Donadini et al, 2010). After the water content in sediments decreases below the critical level the magnetic particles are unable to rotate and the magnetization is registered into the sediments (Verosub, 1977 in Bradly, 1999). In lake sediments where 14C radiocarbon dating can be used to create an accurate chronology, the paleomagnetic secular variation (PSV) record can then be dated. Since the Earth’s magnetic field can be measured all around the world, PSV records from undated lake sediments can then be correlated with regional PSV records from well-dated sites and the records of such reversals found in sediments can be used as valid time markers or chronostratigraphic horizons (Bradly, 1999). Researchers at INGV measured the remanent magnetization of cores LUN-12-1A, 1B and 2B and correlated the smoothed paleomagnetic trends with available European PSV reference curves and models (Gallet et al., 2005; Pavon-Carrasco et al., 2009) to create the age model for this study.
PSV Sampling
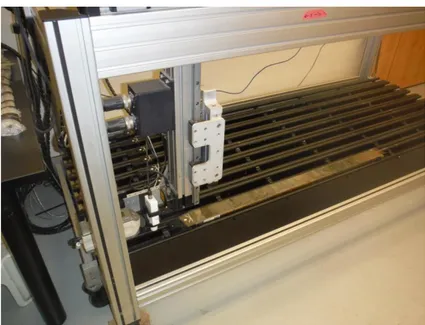
The sediments for the paleomagnetic analysis were collected, using U-channels, from the center of cores LUN12-1A, LUN12-1B and LUN12-2B (fig.4). For LUN09 the measurements were taken manually with a hand held Bartington magnetometer. Paleomagnetic analyses on LUN12-1A and LUN12-1B were performed at the laboratory of paleomagnetism of the Istituto Nazionale di Geofisica e Vulcanologia (INGV) of Rome using a DC SQUID 2G cryogenic magnetometer with in-line a Bartington MS2C susceptibility loop sensor of 45 mm internal diameter and a set of three orthogonal alternating field (AF) demagnetizing coils with orthogonal anhysteretic remanent magnetization (ARM) capabilities. For each U- channel sample the low-field magnetic susceptibility (k) and the natural remanent magnetization (NRM) were measured at 1-cm interval. The NRM was then AF demagnetized up to 100 mT in 18 steps. After demagnetization of the NRM, an ARM was produced for each U-channel in a peak 100 mT AF and 0.1 mT bias field and then AF demagnetized in 9 steps up to 80 mT. A characteristic remanent magnetization (ChRM) was
derived from the analysis of the stepwise demagnetization data of the NRM (Sagnotti et al., 2005) (fig.5). The magnetic susceptibility of LUN12-2B was measured at the United States National Lacustrine Core Facility (LacCore) in Minneapolis, Minnesota. Continuous measurements were performed using an automated core logger using a point sensor (fig.6).
Correlation of cores
For pollen counting three cores were used: LUN09-1, LUN12-2B and LUN12-1C (see Pollen analysis). Cores were correlated using magnetic susceptibility measures, lithologic descriptions, and depth measurements. Distinct patterns of magnetic peaks and depressions were correlated throughout the cores. The age model was developed using cores LUN12-1B and 2B and then utilized for all cores after a common run-depth was established following correlation using magnetic susceptibility.
Surface pollen samples were analyzed from LUN-12-1C. Pollen was analyzed from LUN09-1 from 44 to 605 cm common depth. Pollen from LUN12-2B was analyzed from 461 to 1438 cm common depth, producing an overlap of about 145 cm. In this overlap section, eight common strata were counted for pollen from each of the two cores and compared to concatenate the cores. Results were very similar, and since the counts from LUN12-2B had been done at a later date, the pollen results from that core were used for the depths from 461 cm to the base of the core.
Radiocarbon dating
Radiocarbon dating is typically used in paleoecologic studies to develop a sedimentary chronology and twenty-one samples were submitted for Accelerator Mass Spectrometry (AMS) dating in order to develop an alternative independent age model. AMS measurements were performed on macrofossils (bark, seeds and plant remains) collected throughout the cores by sieving the sediments. AMS measurements were additionally performed directly on pollen grains separated by sieving and chemically pretreating the sediments, then sorting the pollen using a flow cytometer. The final concentrate produced a nearly sample of 95% pollen. In our samples such pollen was represented mainly by Quercus spp., Carpinus spp. and grass pollen grains. Finally, dates were also obtained on organic sediments to determine if there were hard-water effects impacting the radiocarbon age dates.
The high number of samples analyzed is due to the difficulties related to radiocarbon dating in hard water like the ones in Lago Lungo as reported by Calderini (1994). AMS measurements were also performed on modern vegetation samples of phragmites (Phragmites communis)
growing in the lake to see if plants sequestered carbon. All but one of the AMS samples were analyzed at the Center for Accelerator Mass Spectrometry at Lawrence Livermore National Laboratory (LLNL, Livermore, CA).
Pollen analysis
A total of 96 samples, 36 samples from LUN09 core, 58 samples from LUN12-2B and 2 from LUN12-1C were analyzed for pollen. Sediment samples (0.625 cc) were collected about every 10 cm for the LUN09 and LUN12-1C and 20 cm for LUN12. These samples were processed for pollen analysis following the standard protocol developed by Faegri and Iverson (1985). This procedure uses a series of chemicals to remove organic and inorganic material present in the sediment.
Below are listed the main chemicals used during pollen extraction procedure: Hydrochloric acid (HCl 10%) for removing carbonates; Potassium hydroxide (KOH 10%) used as deflocculant; Hydrofluoric acid (49-51%) in hot bath for dissolving silicates; Acetolysis 10%, performed by mixing Acetic anhydride and Sulfuric acid; these chemicals digest cellulose present in the sediments. At the end of this process the residual material is composed basically of pollen grains, spores, plant remains, fungal remains and spores, charcoal and others materials that cannot be removed by chemicals. A known quantity of Lycopodium spores were added during the process as a control for calculating pollen concentration. Each sample was permanently mounted on microscope slides. A minimum of 400 pollen grains were counted per layer expect in strata with very low pollen concentration. In these cases, a minimum of 200 grains were counted.
For the taxonomic identification of pollen grains, reference samples processed from fresh plants and herbarium samples preserved at the Dendrology Lab of the University of Tuscia were used. Published dichotomous keys for pollen identification were used as well (Beug, 2004; Chester and Raine, 2001, Blackmore et al., 2003; Punt et al., 1991; Punt and Malotaux, 1984). Four main groups were considered for vascular plants: trees, shrubs, herbs and aquatic plants. Ferns were distinguished as Trilete or Monolete. The herbs group included wild grasses and field crops. For the Poaceae family, cereals were distinguished from the wild grasses according to the grain and annulus sizes. In particular, grains bigger than 40 µm with an annulus of 10 µm were considered cereals. Within the genus Quercus three types were identified: Quercus robur-pubescens type, Quercus cerris type and Quercus ilex type, according to pollen keys (Beug, 2004; Chester and Raine, 2001). Taxodiaceae, Cupressaceae and Taxaceae were considered in the same group (TCT).
Non Pollen Palynomorphs (NPP), charcoal and algae were determined and counted as well in LUN12-2B and LUN12-1C. For the identification of NPP and algae published keys and scientific articles were used (Gelorini et al., 2011; van Geel et al., 2011; Cook et al., 2011). Charcoal was counted in two different size groups: 50-125 µm and >125µm (Sadori and Giardini, 2007).
Pollen grains, spores, algae, NPP and charcoal were counted along transects of the microscope slide (22 X 22 mm) for each strata at 400x magnification with an optical microscope, until the desired terrestrial pollen count was reached. Lycopodium, NPP, and aquatic pollen were not included in the 400 count sum.
Percent Total Organic Matter
Percentage of Total Organic Matter (%TOM) was determined through loss on ignition (percentage of Total Organic Matter) (Dean, 1974). A total of 180 samples were collected every 10 cm along the core LUN12-2B, dried at 100°C for 24h, reweighed and recombusted at 550°C in a furnace at the United States National Lacustrine Core Facility (LacCore) in Minneapolis, Minnesota. The weight after combustion at 550°C was divided by the dry sediment weight to calculate total percent of organic matter. After this process the same samples were recombusted at 1000°C and reweighed. The difference between the weighs at 550°C and 1000°C was used to calculate the Total Inorganic Carbon (%TIC).
Statistical analysis
Terrestrial pollen percentages were calculated from the total of all terrestrial pollen types counted for each strata. Total pollen concentration was calculated by dividing the pollen sum by the number of controls (Lycopodium spores) counted for each strata in relation to the total number of Lycopodium spores added to the sample. Aquatic pollen, algae and non-pollen palynomorphs (NPP) are presented by accumulation rate, not percentage, because they often do not overlap in time, and total amount provides more useful information than relative abundance. Pollen diagrams were created using a software program designed for paleoecological statistical analysis (C2 software) and the R software environment (R Core Team 2013). The zonation was made with PolPal software using a single link constrained cluster analysis (CONISS).
RESULTS
Chronology
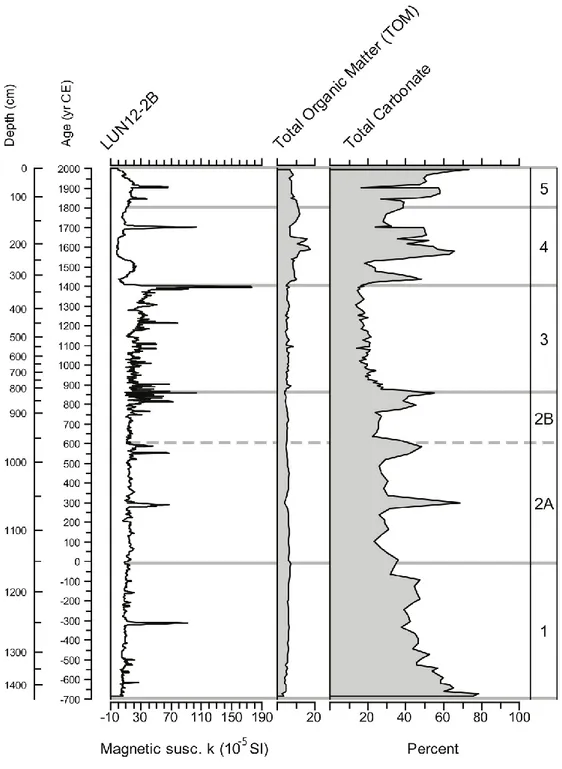
Magnetic susceptibility measurements were used to correlate the correlate the cores. Figure 7 shows the magnetic susceptibility measured on the four cores: LUN09-1, LUN12-1A, LUN12-1B and LUN12-2B. The correlation between the cores is very consistent; the most significant variations are evident in all the cores. At 71 cm (1900 CE) we can the first peak that is evident in the three of the four cores, LUN09-1 excluded; there are two peaks around 1850 CE and 1800 CE that have been detected at the same point in LUN12-1A, LUN12-1B and LUN12-2B; the highest peak in the cores has been shown in all of them at 337 cm (610 yr BP; 1400 CE); the next peak evident in the cores appears at 458.5 cm (810 yr BP; 1200 CE); between 903.5 and 777 cm a numerous peaks have been detected in LUN12-1A, LUN12-1B and LUN12-2B.
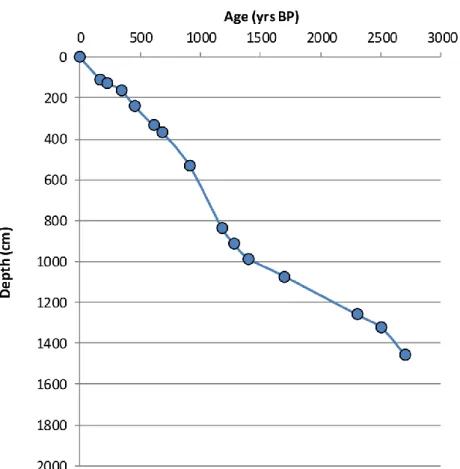
Age model
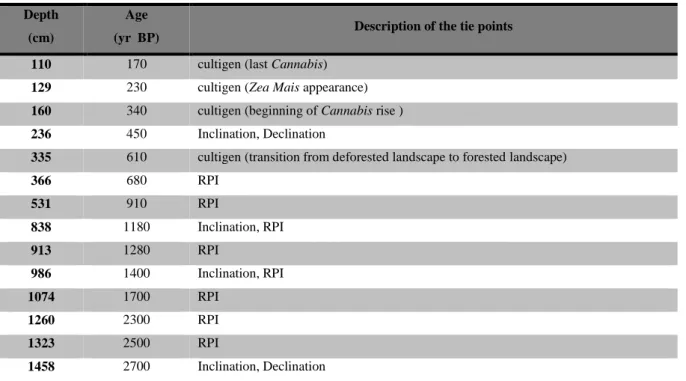
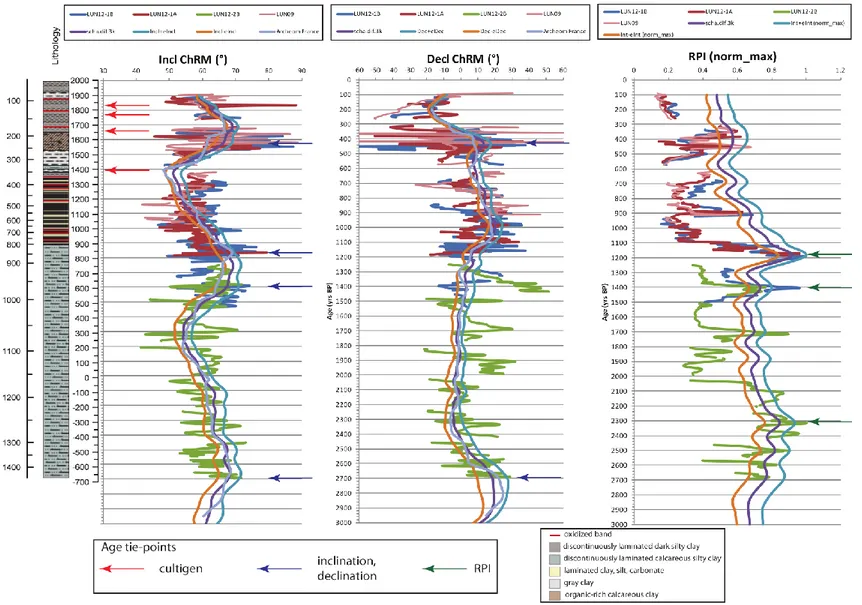
The age model (fig.8) was based on a high-resolution rock magnetic and paleomagnetic analysis. PSV measurements (fig.9) from LUN12-1B and for the lower 4 m from LUN12-2B were used specifically to build the age model. PSV measurements of the cores have been correlated with the available European models. Table 2 shows the tie-points that have been considered for the age model.
Table 2 – Tie points used for the age model Depth
(cm)
Age
(yr BP) Description of the tie points 110 170 cultigen (last Cannabis)
129 230 cultigen (Zea Mais appearance) 160 340 cultigen (beginning of Cannabis rise ) 236 450 Inclination, Declination
335 610 cultigen (transition from deforested landscape to forested landscape)
366 680 RPI 531 910 RPI 838 1180 Inclination, RPI 913 1280 RPI 986 1400 Inclination, RPI 1074 1700 RPI 1260 2300 RPI 1323 2500 RPI 1458 2700 Inclination, Declination
The sedimentation rates oscillate from 1.5 yr per cm to 3.5 yr per cm. The lowest sedimentation rate has been found in zone 1 while the fastest in zone 3 with circa 0.8 yr per cm.
Sediments
The percentage of organic matter calculated through the loss on ignition (LOI) method (see Materials and Methods) in the zone 1 increases from the bottom to the top (fig.10) increasing from 3% (1438 cm) to 7% (1161 cm). The total inorganic carbon (TIC) increases as well with a value of 21% (1438 cm) to 60% at the top of the zone (1161 cm). Zone 2 is characterized by an opposite trend for the percentage of organic matter, from 1154 cm to 818.5 cm it presents a declining trend from 7% to 4%. TIC in this zone follows an alternate trend with peaks around 70% but it never shows percentage less than 41% except 1055 cm where it reaches 28%. During the third phase (zone 3) the trend of TOM is more variable compared with the other zones (1 and 2) included between 4% and 6% except for a peak of 7% at 783 cm and a peak of 9% at 541.5 cm. TIC in this zone (zone 3) shows an increasing trend from the bottom (54% at 812 cm) to top (75% at 329 cm). Zone 4 is characterized by an increasing trend of organic matter that, alternately, increases from 6% at 324 cm to 12% at 224 cm while TIC shows a declining trend from 71% to 22% at the same depths. During the last phase (zone 5) organic matter declines again until reaching 7% at 4 cm with an alternate trend during the entire zone. At the same time, after an increasing trend until 108 cm, TIC starts to decrease as well reaching a percentage of 17% at the top of the core (4 cm).
Pollen
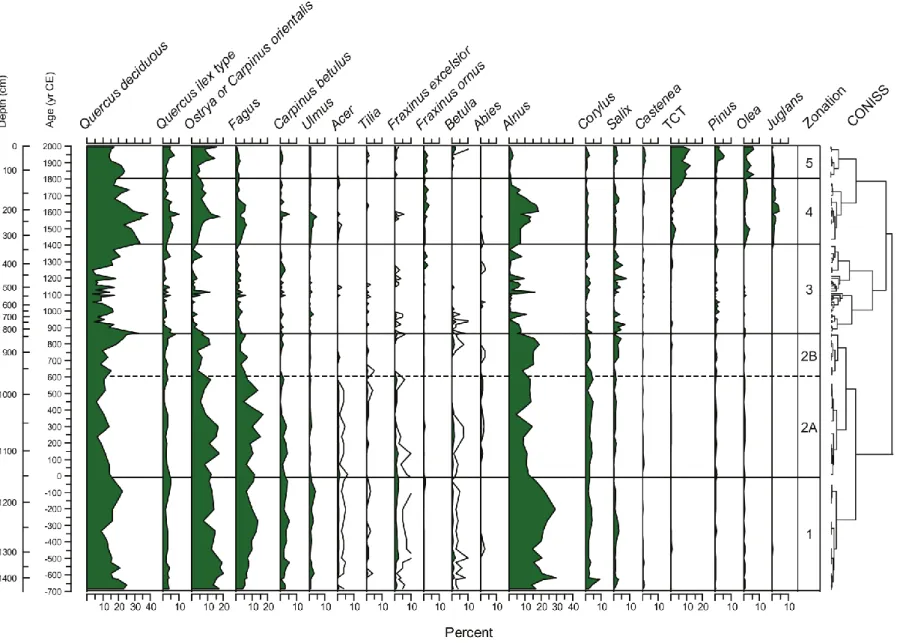
Five zones were distinguished from the cluster analysis (fig. 11): zone 1 (1437-1161 cm), zone 2 (1161-818.5 cm) divided in two zones: zone a (1148-958.5) and sub-zone b (958.5-818.5 cm), sub-zone 3 (818.5-329 cm), sub-zone 4 (329-124 cm), sub-zone 5 (124-10 cm) to cover a period of 2700 years.
Zone 1 (1437-1161 cm) represents the Roman and pre-Roman period (2700-2040 yr BP; 680-30 BCE) and it is characterized by woodland (fig. 11). In this period the percentage of arboreal pollen is high with a maximum of 60% and never less than 45%. Forest cover is represented by mixed deciduous species in different percentages but highest than all the others zones. In this section we find Quercus (deciduous and evergreen), Fagus, Ostrya, Carpinus, Ulmus, Tilia, Castenea, Fraxinus ornus and F. excelsior, Olea, Betula and Acer in addition to the presence of Abies and Pinus (fig.11).
Arboreal pollen is mainly constituted by Quercus genus, represented by three different types: Quercus robur-pubescens type, Quercus cerris type and Quercus ilex type. Quercus genus is presented as two different groups: deciduous Quercus (Q. cerris type plus Q. robur-pubescens type) and evergreen Quercus (fig.11). The deciduous Quercus present a maximum peak of 25% at 1421 cm (2670 yr BP; 660 BCE) and a minimum of 9% at 1258 cm (2360 yr BP; 330 BCE). For the evergreen the maximum is 4% at 1355 cm (2570 yr BP; 560 BCE) while its minimum is 1% at 1216 cm (2220 yr BP; 200 BCE). Other significant arboreal presence in this zone is Fagus with a maximum percentage of 13% at 1238cm (2280 yr BP; 270 BCE) and a minimum of 4% at the very bottom of the core (1437 cm; 2700 yr BP; 680 BCE). The highest percentage of Fagus in this zone is present between 1216-1293.5 cm that represents a period between 2220-2450 yr BP (200-440 BCE). The trend of the beech is opposite to that of Ostrya carpinifolia/Carpinus orientalis type; this one shows its maximum percentage of 20% at a depth of 1375 cm (2600 yr BP; 590 BCE) and gradually tends to decrease toward the initial part of the zone. Alnus is presents along the entire section with constantly high percentages (fig.11), remarkable higher compared to all the other zones. This species shows two maxima of 30% at 1216 cm and at 1395 cm of depth that corresponds at 2220 yr BP and 2630 yr BP (200 BCE and 620 BCE). Corylus is constantly present in this part of the core with a maximum peak of 9% at 1401 cm of depth (2640 yr BP; 630 BCE). Salix, Phillyrea, Ericaceae, Rosaceae and Hedera are represented as shrubs group with a percentage less than 10% (fig.12). Cultivated trees have a low percentage in this zone, they remain less than 10% except for a peak at 1401 cm (2640 yr BP; 630 BCE) where they reach 11% whereas the forest trees show a lower percentage (46%). Along all this section the Poaceae percentage is constantly low, less than 10%. The herbs (herbaceous flowering plants that are not Poaceae) percentage is even less than grass and follows the same trend (fig.13). Trilete spores are present with a percentage constantly less than 10% with a peak of 3% at 1333.5 cm (2540 yr BP; 530 BCE). Typha is significantly present just in this zone compared to the others (fig.14). Percentage of Calcium carbonate (CaCO3) is extremely high with a decreasing trend from the bottom of the core (1437 cm) to the beginning of the zone 1 (1181 cm) While the organic matter remains constantly below the 10% threshold through the entire section.
Zone 2 (1161-818.5 cm) represents the late-Roman and Migration periods (2040-1150 yr BP; 30 BCE-870 CE). The forest trees present several oscillations between 18% and 53% (average ) (fig.11). These peaks are particular evident on Fagus, Quercus and Alnus trends that show minimum percentages around 1015 cm (1560 yr BP; 450 BCE). Fagus reaches the absolute maximum percentage of 17% in this zone at 1035 cm (1640 yr BP; 370 CE) (fig.11).
Except for Quercus and Alnus, that show alternate trends, all the others arboreal species decrease constantly from the bottom to the top of section. Poaceae and herbs are still relatively high with percentages around 20% and 10% respectively. Presence of cereals has been detected in this zone as well. Indeterminate grains increase gradually and continuously with the minimum of 3% at the end of zone (1148 cm, 2000 yr BP; 10 CE). Trilete and monolete spores tend to increase rapidly and along the zone.
Zone 3 (818.5-329 cm) Medieval time (1150-600 yr BP; 870-1410 CE). This zone presents a strong shift in the landscape. The percentage of forest trees abruptly decreases and increases from the bottom to the top of the zone with highly variable peaks (fig.11). Poaceae reach the absolute maximum with 33% 445.5 cm (790 yr BP; 1220 CE). Herbs show the maximum percentage at 531.5 cm (910 yr BP; 1100 CE). At 521.5 cm of depth (900 BP; 1110 CE) Alnus presents the highest peak with 16%. Except for this short and sudden peak, Alnus has a dramatically decreasing trend compare to the previous zone. Ostrya carpinifolia /Carpinus orientalis decreases rapidly from the bottom to the top of the zone with an isolated short peak of 12% at 521.5 cm (900 yr BP; 1110 CE). Cereals percentage remains consistent during the entire section (fig.13). Monolete spores are continuously present with 2 high peaks: 13% at 590.5 cm (960 yr BP; 1050 CE) and 12% at 511.5 cm (880 yr BP; 1130 CE) (fig.13). Zone 3 is also characterized by an abrupt increase of trilete spores (ferns) that culminate with a percentage of 37% at 600.5 cm (970 yr BP; 1040 CE), the highest value longwise the entire core (fig.13). The indeterminate grains percentage alternates several peaks along the zone 3 oscillating between 10% and 25% (fig.12).
Zone 4 (329-124 cm) represents the Little Ice Age (LIA) (600-210 yr BP; 1410-1800 CE). This zone is characterized by woodland. The arboreal pollen percentage is constantly high with a maximum of 74% at 218 cm (420 yr BP; 1590 CE) (fig.11); this is the highest percentage of arboreal pollen of the entire core. All the species that compose the mixed deciduous forests in this climate present relatively high percentages: deciduous Quercus 39%, evergreen Quercus 10%, Ostrya 18%, Fagus 7%, Ulmus 6%, Carpinus betulus 5%, Fraxinus excelsior 1%, Tilia, Acer, and Abies have been observed (fig.11). In correspondence of this high peak of forest trees is evident a drastic decrease of the Poaceae, herbs and cultivated trees. During this period Alnus shows a rapidly increase, a maximum percentage (18%) at 208 cm (410 yr BP; 1600 CE) and a likewise rapidly decreasing forward the top of the zone (1760 yr BP; 250 CE) with a low peak where the forest shows its maximum spread. Zea mays pollen is present only in the first level of this zone at 134 cm (250 yr BP; 1760 CE) while cereals are been detected sporadically alongside the zone 2 (fig.13). Cannabaceae start to increase rapidly
between 330 and 300 yr BP (1680-1720 CE). A marked decrease characterizes the trend of indeterminate grains starting from 248 cm (470 yr BP; 1540 CE) (fig.12).
Zone 5 (124-10 cm) represent the modern period from 210 yr BP to the present (1800-2000 CE). This zone is characterized by a relative high percentage of forest trees. This group shows an alternate trend with the highest percentage at the present (fig.11). It is mainly represented by deciduous and evergreen Quercus. All the others deciduous species show very low percentages, less than 10% except for TCT (Taxaceae, Cupressaceae, Taxodiaceae) with a maximum of 12% and Ostrya (fig.11). Ostrya carpinifolia/ Carpinus orientalis is present with percentages less than 20% along the entire section. Pinus starts to increase from the bottom of the zone 1 with 1% to the top, with a peak of 5% at 44 cm (70 yr BP; 1940 CE). The presence of Alnus is consistently low during the entire period with a maximum of 2% (fig. 11). Cultivated trees (commonly native taxa that are also planted) decrease toward the present with a highest percentage of 24% at 84 cm (130 yr BP; 1880 CE). This group has the maximum expansion along the zone 1 compare to all the other zones (fig.11). Poaceae are very high with a maximum percentage of 27% at 64 cm of depth (100 yr BP; 1910 CE) and a minimum at 124 cm (210 yr BP; 1830 CE) showing a drastically increasing trend from the bottom to the top of zone 1. Herbs are present along the zone with percentages below of 10%. The presence of Zea mays has been observed in five strata of this zone (fig.13). Cereals have been detected in three different strata of the zone: 10, 20 cm (contemporaneity) and 114 cm that represent 180 yr BP (1830 CE). Cannabaceae reach a peak of 31% at 124 cm (210 yr BP; 1800 CE) and start to decrease significantly at 114 cm (about 180 yr BP; 1830 CE). Urtica attains the maximum percentage of 5% at 124 cm (210 yr BP; 1800 CE) as well (fig.13). Trilete spores are almost completely absent along the whole zone 1.
DISCUSSION
In the 2700 years of vegetation history reconstructed in this study using pollen data, the forest cover shows several changes due to both climatic conditions and human impacts. The human activities in the Rieti basin are reported in detail in several historical documents including Roman archives, monastic documents and municipal records.
In the summary diagram (fig.15) is shown a grouping referred to as forest trees. The forest tree group includes Quercus deciduous, Quercus ilex, Fagus, Ostrya carpinifolia, Carpinus betulus, Ulmus, Fraxinus excelsior, Fraxinus ornus, Betula, Tilia and Acer. Quercus robur type and Quercus cerris type have been plotted together as Quercus deciduous group. Quercus ilex type represents the evergreen oaks. Castanea, TCT, Pinus, Oleaceae, Juglans, Corylus are plotted separately in the summary diagram from forest trees because although they occur naturally, they are also often cultivated .
During the early period the landscape appears dominated by woodland. The presence of many deciduous species suggests that the hills surrounding the lake were covered by natural mixed deciduous forests while the low and constant percentage of cultivated trees and cereals suggest that the human activities did not have a strong impact on the landscape (fig.15). The period from 2700 to 2220 years BP (700-200 BCE) is characterized by the absence of indicators of anthropogenic activities both in pollen and NPP (fig.17). In the very early period of our records (2700 – 2500 yr BP; 700-500 BCE) the absence of certain types of NPP (e.g. Glomus) and the very low concentration of others (e.g. Sporormiella) is likely to be related to the increased water level; the Lacus Velinus reached its historical peak (374-376 m asl) around 900 BCE (Brunamonte et al., 2003). Archeological studies report that during this phase (2700-2500 yr BP; 700-500 BCE) an interruption of permanent human settlements lasted for more than eight centuries (900-1 BCE) (Brunamonte et al., 2003). Tracheids (fig.17) show the maximum percentage in zone 1. This evidence agrees with the concurrent finding of abundant pollen of trees species, that testifies the existence a wide forest cover and consequently higher rates of living and dead biomass. The Non Pollen Palynomorphs (NPP) support the information obtained from pollen data. In this case, the presence of Asterosporium confirms the presence and the abundance of Fagus. This fungus belongs to a group of parasite commonly associated to many woody substrates (Cugny et al 2010) and in particular Asterosporium asterospermum is a specific endophyte of beech (Danti et al, 2002). Cirrenalia (fig.17) has been detected in this period as well. This fungal spore is one of the seven terrestrial species known, and mostly occurs on bark and wood and often in wet habitats
(Gelorini et al., 2011), compatible with the woody land scenario suggested by all the other data. The occurrence of a wet period in zone 1 is corroborated also by the high and constant percentage of Cyperaceae and Alnus (figs.14-15). Palynological, geological and archaeological evidences suggest that an abrupt climate change occurred around 2700 BP in the Northern Hemisphere (including Europe), where climate shifted to colder and wetter conditions (Van Geel et al. 1998). Similar evidence for climatic cooling in the northern hemisphere around 850 BCE was found by Van Geel et al. (1996), from studying peat deposits. The sharp climatic cooling in this period was also inferred from the examination of parameters of ring growth (e.g. according to Becker and Kromer, 1993 ring growth anomalies in oaks occurred in Germany during this period). These climatic conditions together with the interruption of permanent settlements in the Rieti basin reported by archaeological studies (Brunamonte et al., 2003) could support the expansion of the forest.
Historical documents report that in 272 BCE the first drainage canal (Cava Curiana) was opened by the Romans on the travertine threshold of Marmore creating new agricultural lands (Duprè, 1939; Leggio and Serva, 1991). The decline of Alnus and Salix from 2200 yr BP (200 BCE) could indicate the effects of the Cava Curiana on the vegetation. The dynamic activity of the Romans in the Rieti area is documented by several historical records. Spanning the period from 2100 to 1890 yr BP (90 BCE – 130 CE) the presence of Roman rural Villae at a low elevation in the basin (380 m a.s.l.) (Berker and Mattingly, 1989) has been reported, testifying to the decrease of the water level in the basin. In particular a senatorial Villa belonging to the senator Quinto Assio was located at south of Lago Lungo in the area that had been drained (Coccia et al, 1992). The highest elevation of the agricultural fields during the Republican Roman age was 480 m a.s.l. (Coccia et al., 1992) according to the archeological surveys of Carancini et al. (1986). Pliny the elder describes the Rieti valley as surrounded by high mountains covered by thick forests; he describes also the carbonate enriched water in the basin that could have deposited travertine in sections of the Cava Curiana preventing the flow of the water and causing the increase of the swamps in the plain (Naturalis historia, 77).
The presence of Poaceae and herbs concurrently with high percentage of forest trees pollen suggest a more complex exploitation of the territory by the Romans. Mazzarino (1998) and Leggio (1998) report that since 53 BCE special efforts were spent to preserve the existing forests on the mountains surrounding the basin to avoid hydrogeological risk that had occurred in other areas of the Apennines because of the intense deforestation practiced by the Romans. Between 300 and 200 BCE the intensive clear cutting on the mountain regions of the Apennines caused floods due to the esondation of the Tiber river. These events led up to a
better understanding of the consequences of an over-exploitation of the forest resources (Mazzarino, 1998 and Leggio, 1998). Low-density grazing forest was probably more widespread than intensively exploited agricultural lands (Cifani personal communication). This kind of forest management can explain the simultaneous presence of forest trees and grass and herb pollen during the same period and the presence of Glomus and Sporormiella. (fig.17) Glomus is an arbuscular mycorrhiza on a variety of host plants associated with high soil erosion when recorded in lake deposits (van Geel et al., 2011; Gelorini et al., 2011). Increased Glomus together with the consistent presence of Cyperaceae and Typha angustifolia indicate lowered lake level and increased sediment infill at the lakes' edges (Cook et al., 2012). Sporormiella is a fungal spore (ascomycete) found exclusively on the dung of herbivores, common on the dung of domestic herbivores (Ahmed and Cain, 1972). As reported by Davis and Shafer (2006), Sporormiella spores are abundant in historic sites where the livestock were corralled or otherwise concentrated. The low but constant presence of Sporormiella is compatible with the management of forests as low-density grazing forests.
The base of the core corresponds to the most calcareous part of the core. There is a decreasing trend in percent carbonate from the base of the core through the top of zone 1. The percent CaCO3 serves as a proxy for the endogenic carbonate component in the lake system; that is the non-detrital carbonate that was either precipitated inorganically from the lake water or biologically precipitated by algae. Inspection of the sediment in smear slides shows that this carbonate component is fine-grained marl composed of varying amounts of calcareous algae and rhombic, inorganically precipitated calcite. Changes in the relative amount of endogenic carbonate deposition can be attributed to various factors, including the percent of dissolved inorganic carbon (DIC) entering the system from hydrologic sources, from changes in biologic productivity, and from lake temperature. Percentage of endogenic carbonate is also controlled by relative changes in the non-clastic mineral component, composed largely of siliciclastic materials (i.e. clay, quartz, feldspar, oxides) derived from stream runoff, soil erosion, and windblown dust. The decrease showed in the zone 1 is more likely related to a decrease in carbonate production, rather than an increase in detrital input. It is not clear if this represents a decrease in lake productivity, or a change in lake chemistry that may be related to changes in hydrologic inflow or temperature. Overall, the gradual trend in carbonate seen in zone 1 may be a gradual change in the natural climate system, prior to any large scale manipulations to the natural system (Noble personal communication).
The first change in the landscape evident in the pollen data occurs around 2000 yr BP (1 CE) when the forest trees show an alternate trend concurrently with an abrupt increase of
ferns, grasses and herbs, indicating a more intensive use of the landscape. Cereals become more common, confirming an exploitation of lands for agricultural purposes, however arboreal pollen did not decrease substantially indicating a parkland landscape. The increase of NPP indicators of livestock (Sporormiella) argue for low-density grazing within a mosaic of open forest with grassland rather than massive clearing for agricultural lands. Ulmus spp., Carpinus betulus, Acer spp. and other pollen of native trees decline until almost disappearing consolidating a loss of natural system. This hypothesis is corroborated by the indicators of erosion such as Glomus (Cook et al., 2012) and indeterminate pollen grains that increase abruptly suggesting a more intensive management of the landscape. The simultaneous presence of these palynomorphs is indicative of soil erosion in the catchment of the lake (Gauthier et al., 2010). Pseudoschizea appears in this period confirming the higher level of erosion in the basin. This NPP is a zygospore of a green algae growing in shallow water or along the littoral zone of the lakes (Steveson et al., 2001); its presence in the lake sediment is associated to the soil erosion (Lopez-Merinos et al., 2010). The decline of forest together with increase values of Pseudoschizea and Glomus suggest an establishment of agricultural activities (Lopez-Merinos et al., 2010). The increase of charcoal and trilete spores (ferns) indicate also the use of fire correlated to the human activities (fig.17).
The sub-zone 2b is characterized by an increase of Alnus (1370-1150 yr BP; 640-870 CE) (fig.11) until 858.5 cm (1180 yr BP; 830 CE) where it starts to decrease abruptly toward the top of the zone 2. Forest tree pollen follow an opposite trend: after a decline between 640-760 CE (1370-1250 yr BP) it starts increasing, reaching a percentage of 53% at 818.5 cm (1140 yr BP; 870 CE). These changes can be most likely explained as a consequence of the anthropogenic impact on the environment, considering that climate in this particular period does not show any significant anomaly in terms of temperature and/or precipitation (Büntgen at al., 2011). Deforestation of Monti Sabini began in the 8th century, and extended to Monti Reattini in the 11th and 12th century (Leggio and Serva, 1991). In the early 9th century settlements were dispersed (Coccia et al., 1992) and farming used the fire-fallow method, with clearings (cese – cuttings or macchie – patches) cut into the forest and then burned to provide land for pasture and farming. A period of muslim invasions from North Africa occurred between, 891 and 919 AD resulting in the burning and destruction of the monastery of Farfa and fall of Rieti in 897 AD. Isolated patches of farmland were abandoned during this new period termed incastellamento and most people moved into fortified castles for protection from further attacks, with only limited dispersed settlements (Leggio, 1989a; Coccia et al., 1992).
The most considerable environmental shift began around 1100 yr BP (900 CE) at the beginning of Medieval Warm Period. Pollen and NPP data spanning the period between 1150-600 yr BP (870-1410 CE) describe the most intense anthropogenic exploitation of the landscape ever occured during the history of the Rieti basin; forest trees pollen decrease drastically reaching the lowest percentage recorded in the sediments while, on the contrary, herbs and Poaceae increase rapidly. Alnus spp. decrease as well, following a fluctuating trend compatible with the periodical increase of the water in the plain that however never reached level high enough to create another lager lake. The monastic documents (892 CE) from Farfa abbey report the presence of two distinct lakes still present in the plain atrributable to Lago Lungo and Lago di Ripasottile (Leggio, 1994) and intensive clear-cutting started on higher elevation on the mountains surrounding the lakes (Leggio, 1998). NPP related to human activities reach their maximum suddenly together with the highest concentration of charcoal and ferns (trilete spores) suggesting a degraded landscape ascending up into the mountains and an extensive use of fire. In particular the high value of Sporormiella indicates an intensive farming activity. High percentages of fenestrate (Liguliflorae) pollen and indeterminate grains support an interpretation of high rates of erosion (Bottema, 1975; Cordova and Lehman, 2003).
The percentage of Alnus decrease abruptly following an alternating trend with a few high peaks, the highest of which has been detected around 900 yr BP (1110 CE). It could be speculated that these data are related to a flood that occurred in 1053 CE (Leggio, 1986) as reported in the historical documents “Annales Reatini” (1054-1377 CE). This flood caused the break of the banks of the lakes and the consequently flow of the water in the Nera River and successively into the Tiber River. The damage that occurred during this exceptional meteorological event may have been increased by deforestation practices that created more barren soil surfaces (Leggio, 1986). During the entire period (1150-600 yr BP; 870-1410 CE) the agricultural activities were more intensive than during other periods. Leggio (1994) reports that wide clear-cuttings on the mountains were operated by the Cistercensian monks during the XI-XII centuries to create wider areas for grazing and cereal cultivation; Forest clearing reached an elevation of 1400 m asl on the Terminillo mountain. The Cistercensian monks started to work on the lands for grape plantations, built rural buildings and intensified the agricultural activity, especially for cereal cultivation (Caciorgna, 1995).
This intensive exploitation of forest resources may explain the high level of erosion recorded in sediments together with the lowest percentages of tree pollen. The irregular abundance of aquatic plants like Cyperaceae is also compatible with periodic flooding that
occurred between 1000-1100 CE and that contributed to making it more difficult for the people living in the area, a period already characterized by various social crises such as religious schisms, civil wars and the destruction of Rieti by Ruggero II (Leggio, 1994; Leggio, 1998). It is probable that high rates of erosion following deforestation disrupted the original Roman drainage network and accelerated deposition of travertine at the Marmore falls, due to warm temperatures during the MWP, contributed to flooding in the valley.
From 1150-600 yr BP (870-1410 CE) the percentage of calcium carbonate (CaCO3) (fig.10) drops drastically and stays very low for the entire period while the inorganic matter reaches the highest concentration, supporting the interpretation that high erosion occurred. Zone 3 corresponds to a distinct lithologic interval in the core where sediment is composed of millimeter to centimeter scale varicolored bands of silt, clay, marl, and oxidized bands. The sedimentation rate in this interval is markedly higher (about 50,000 grains cm2 yr-1) than the interval below, and may represent a time of increased siliclastic input into the basin, either by frequent flooding, or increased soil erosion. The percent carbonate in this zone is at its lowest, and may be a function of dilution by silicilastic material, rather than a decrease in carbonate production (Noble, personal communication).
After 1400 CE, the landscape changed dramatically with regrowth of dense mixed deciduous woodland on the slopes, expansion of marshlands in the valley and a sharp reduction in fires. These dramatic changes resulted from a series of economic and demographic changes documented throughout Europe (Fraser, 2010) punctuated by the black plague in 1347-1348 CE (Barbiera and Dalla Zuanna, 2009) but extended by subsequent plagues lasting into the first half of the 16th century (Alfani, 2010; Tozzi, 2009). The plague resulted in mortality of between 30 and 60% across Europe and in many Northern European sites land abandonment followed by woodland regeneration has been documented (Yeloff and van Geel, 2007). In Rieti the population declined by >50% from a combination of epidemics beginning in 1347 CE and continuing through 1400 CE and destruction of the city by an earthquake in 1349 CE (Leggio, 1989b).
A rapid increase in percent arboreal pollen and pollen accumulation rate (fig.16) provides evidence that abandoned farmlands quickly reverted to forest. This caused other consequences on human society; in 1450 CE, for example, the meat of deer and wild boar was less expensive than that of domesticated animals and predators such as bears and wolves were present providing further evidence of a true forest environment (Leggio, 1995). This pattern of the increased importance of game over domesticated animals has been documented in France as well (Vecchio, 1974). The most significant increase in tree forest pollen is due to