DOTTORATO DI RICERCA IN
Scienze dell’Ingegneria
CICLO XXI
COORDINATORE Prof. Stefano Trillo
ADVANCED VIBRATION PROCESSING TECHNIQUES FOR
CONDITION MONITORING AND QUALITY CONTROL
IN I.C. ENGINES
AND HARVESTING MACHINES
Settore Scientifico Disciplinare ING-IND/13
Dottorando Tutore
Dott. Delvecchio Simone Prof. Dalpiaz Giorgio
Università degli Studi di Ferrara Engineering Department in Ferrara
Dottorato di Ricerca in Scienze dell’ Ingegneria XXI ciclo
Doctoral Program: Engineering Curriculum: Industrial Engineering Branch of study: Mechanics of Machines
Title: Advanced vibration processing techniques for condition monitoring and quality control in I.C. engines and harvesting machines Author: Ing. Simone Delvecchio
Supervisor: Prof. Giorgio Dalpiaz Printed: March 2009 PhD Coordinator
Prof. Stefano Trillo Università degli Studi di Ferrara PhD Jury
Prof. Giorgio Dalpiaz Università degli Studi di Ferrara, Italy Prof. Alberto Tiziani Università degli Studi di Padova, Italy Ing. Denis Benasciutti Università degli Studi di Udine, Italy Prof. Dr. Ir. Paul Sas Katholieke Universiteit Leuven, Belgium Final exam
To my grandfather, Bartolomeo, and my grandmother, Angela.
“Imagination is more important than knowledge”
Riassunto
L’argomento affrontato in questa tesi riguarda lo sviluppo e l’implementazione di tecniche avanzate di processamento del segnale di vibrazione per il monitoraggio e la diagnostica delle macchine. Due sono i campi di applicazione qui trattati: il controllo di qualità di motori a combustione interna attraverso test a freddo ed il monitoraggio del processo di trebbiatura in macchine mietitrebbie.
Il test a freddo viene condotto alla fine della linea d’assemblaggio del motore. Tale test permette il controllo di qualità finale del motore non acceso ma trascinato. Tecniche per il monitoraggio di motori basate sull’ analisi del segnale di vibrazione sono attualmente utilizzate. Tuttavia queste tecniche sono spesso applicate a segnali estratti da motori durante test a caldo. Questa tesi tratta l’utilizzo di strumenti di analisi del segnale di vibrazione acquisito durante prove a freddo.
Per quanto riguarda il controllo dello stato del motore, viene presentato un approccio basato sull’uso di pattern simmetrizzati per la caratterizzazione visiva dei segnali di vibrazione e per l’ottenimento di valori di soglia utili per discriminare la condizione difettosa da quella sana.
La diagnosi, ossia la localizzazione del difetto all’interno del cinematismo del motore, è affrontata attraverso l’utilizzo del modello ciclo-stazionario del segnale di vibrazione. La componente ciclostazionaria del primo ordine del segnale viene stimata attraverso il calcolo della media sincrona. Successivamente, la componente ciclostazionaria del secondo ordine viene analizzata attraverso la Distribuzione di Wigner-Ville (WVD), lo Spettro di Wigner Ville (WVS) e
la potenza media istantanea (MIP). Inoltre la Trasformata Wavelet continua (CWT) è presentata e comparata con le distribuzioni sopra descritte.
La scelta di diverse ‘mother wavelets’ e alcuni metodi per l’ottimizzazione della mappa tempo-frequenza ottenuta tramite CWT vengono ulteriormente considerati. Inoltre vengono discusse le potenzialità del segnale di velocità angolare istantanea (IAS) dell’albero motore nell’identificazione della presenza di difetti di assemblaggio. I risultati sperimentali indicano che la correlazione tra immagini ottenute dai pattern simmetrizzati del segnale di vibrazione può essere considerata uno strumento utile per il miglioramento dell’efficienza del test a freddo nel riconoscimento di condizioni difettose.
Viene inoltre verificato che la componente ciclostazionaria del segnale di vibrazione è utile nel riconoscere la presenza del difetto ma non la sua localizzazione.
La componente ciclostazionaria del secondo ordine, invece, permette di superare questo inconveniente localizzando angolarmente il difetto all’interno della catena cinematica biella-manovella-pistone con l’ausilio del diagramma degli eventi del motore. Per quanto riguarda l’analisi tempo-frequenza, la distribuzione WVS e la Trasformata Wavelet calcolata utilizzando la ‘Morlet wavelet’ possono essere considerati utili strumenti di analisi del segnale per localizzare i transitori dovuti alla presenza del difetto nel dominio tempo-frequenza.
Grazie a questa ricerca è possibile capire quale delle tecniche sopra descritte è efficace per effettuare un controllo di qualità semplice e robusto di motori a combustione interna. Inoltre vengono evidenziati i limiti e le problematiche di ciascuna tecnica applicata.
La seconda parte della tesi affronta l’analisi delle relazioni che intercorrono tra le variabili che caratterizzano il processo di trebbiatura in macchine mietitrebbie e la risposta vibratoria delle macchine stesse. Parametri statistici comuni ed avanzati estratti da segnali vibro-acustici sono stati correlati con variabili di efficienza con l’obiettivo di definire un’ insieme ottimale di parametri abili nel monitorare il processo di trebbiatura. La Trasformata Wavelet Discreta (DWT) è
stata utilizzata per trovare il range di frequenza di segnali vibratori caratterizzato da componenti impulsive. Vengono inoltre esposti alcuni risultati ottenuti attraverso l’analisi vibro-acustica condotta nel dominio angolare. Due differenti configurazioni di prova sono state messe a punto per acquisire segnali in diverse condizioni operative della macchina trebbiatrice. L’obiettivo è quello di valutare l’influenza di tali condizioni sulla risposta vibratoria della stessa. I risultati ottenuti possono essere utilizzati per capire come la generazione di vibrazione è connessa alla distribuzione del materiale processato dalla macchina durante il processo di trebbiatura.
Buone correlazioni sono state ottenute attraverso l’analisi del segnale misurato dall’ accelerometro posto sulla gabbia che avvolge parzialmente il rotore che effettua la trebbiatura attraverso il confronto tra alcuni parametri statistici del segnale di vibrazione con indicatori di efficienza. Questi parametri statistici possono essere assunti come buoni indicatori per descrivere la distribuzione del materiale tra la gabbia ed il rotore e, conseguentemente, l’efficienza del processo.
Il principale ed originale contributo di questa seconda parte della ricerca riguarda l’uso del segnale di vibrazione come strumento efficace per il monitoraggio del processo di trebbiatura. Il segnale di vibrazione può essere considerato come un indicatore di qualità del processo utile all’operatore durante le operazioni di trebbiatura condotte su campo.
Abstract
The topic of this thesis is the development and the implementation of advanced vibration processing techniques for machine condition monitoring and diagnostics with two fields of applications: the quality control of I.C. engines by means of cold tests, and the monitoring and control of harvesting processes.
The cold test, i.e. the final test after the assembly line and before shipping the engine to the customer, consists of the final quality control of the engine in a non-combustion state. Techniques for engine condition monitoring based on the analysis of vibration signals are widely used. However, these techniques are often applied to engine tests in firing conditions. This thesis addresses the use of several signal processing tools as a means for the monitoring and the diagnosis of assembly faults through the cold test technology. Firstly, an approach based on the use of Symmetrized Dot Patterns for the visual characterization of vibration signatures is proposed in order to obtain reliable thresholds for the pass/fail decision after the cold test. Secondly, the fault identification is discussed on the basis of the cyclostationary modelling of the signals. The first-order cyclostationarity is exploited through the analysis of the Time Synchronous Average (TSA). Subsequently, second-order cyclostationarity is analysed by means of the Wigner-Ville Distribution (WVD), Wigner-Ville Spectrum (WVS) and Mean Instantaneous Power (MIP). Moreover, Continuous Wavelet Transform (CWT) is presented and compared with the WVD and WVS. The choice of different wavelet functions and some methods for the CWT map optimization (i.e. purification method and the average across the scale
method (TDAS)) are also considered. Moreover, the capabilities of the Instantaneous Angular Speed (IAS) in detecting assembly faults have been tested.
It is worth noting that the cyclostationary and time-frequency technique capabilities have been verified for both simulated and real signals.
The experimental results indicate that the image correlation of Symmetrised Dot Patterns is a good solution that can be used in the cold test technology in order to increase its efficiency and fault detection capability. Moreover, it will be proved that the first order cyclostationary analysis is able to identify the presence of assembly faults but it is not appropriate to localise the faults. The second order analysis overcomes this problem indicating the angular position of the mechanical part affected by the fault. This is achieved by means of a correlation between the results obtained from the cyclostationarity analysis and the angular position of the mechanical events. Concerning the time-frequency analysis, the WVS as well as the CWT, using both Morlet mother wavelet and TDAS method can be considered good tools to characterise the transients due to the fault events in the time-frequency domain. Thanks to this research study it is possible to understand which of the above-mentioned techniques is effective for an easy and fast quality control and for the diagnosis of the considered assembly faults. Moreover, the limits and drawbacks of both monitoring and diagnostic procedures are shown.
The originality of the first part of the research mainly concerns the use of vibration measurements for the quality control of engines at the end of the assembly line while the greater part of methods used for cold test applications focuses on pressure and torque measurements.
The second part of this thesis concerns the analysis of relationships between the harvesting process parameters relative to a non-conventional harvesting machine and its vibration response.
Common and uncommon features extracted from a segmentation analysis have been correlated with the harvesting process efficiency in order to define the optimal monitoring feature subset. Moreover, the Discrete Wavelet Transform method is performed in order to find the
frequency range mostly characterised by impulsive components. In addition, some outlines obtained through the vibro-acoustic analysis performed in the angular domain are also given.
Two different indoor and outdoor test rigs have been built to test the machine under different setting conditions in order to evaluate their influence over the vibration response of the threshing unit. The test results are used to identify how the vibration generation is linked to the crop distribution during the threshing process.
Good correlations have been obtained by analysing the concave middle radial signal and by calculating the relationships that exist between some time domain features and the efficiency parameters. These features can be assumed as good indexes in explaining the crop distribution between the rotor and the concave and, consequently, the efficiency of the process. Moreover, it will be shown that the vibro-acoustic features selected are well-connected to the different sources of the concave excitation.
The main original contribution of this second part concerns the use of the vibration signal as an effective way to monitor the harvesting process. It can also be considered as a proper quality control indicator for the user during field operations.
Acknowledgements
I would like to give a special and sincere thanks to Prof. Ing. Giorgio Dalpiaz, my supervisor, for all his guidance, knowledge, and for the opportunity he gave me. I wish also to thank Apicom and VM Motori (Cento, Ferrara, Italy) and the engineers of these Companies for co-operation and assistance in the collection of engine data. This thesis has been partially developed within the laboratory of research and technology transfer InterMech (Division Acoustics and Vibrations - LAV) realized through the contribution of Regione Emilia Romagna - Assessorato Attivita' Produttive, Sviluppo Economico, Piano telematico, PRRIITT misura 3.4 azione A. The second part of the work is the result of a 9 months research period at Department of Mechanical Engineering at KUL (Katholieke Universiteit Leuven) in Leuven (Belgium) in the framework of the “Marie Curie Host Fellowship EDSVS". I would like to thank the European Commission for the grant received. I am sincerely thankful to Prof. Dr. Ir. Paul Sas for his support and trust he gave me for all the duration of the work. My acknowledgements also go to Dr. Ir. Bart Missotten from CNH and all the academic stuff from the Department of Biomechanics Engineering of KUL for their cooperation and helpfulness.
I am deeply grateful to all people I met during last three years and to my Italian and Belgian colleagues who enriched my experience. Friends, more than colleagues.
Simone,
Preface
In October 2005 I graduated in Mechanical Engineering and I discussed Machine Design in my thesis. I immediately started to work for a company producing forklift trucks. I was really surprised when I received the call from my current supervisor, Prof. Giorgio Dalpiaz, who suggested I followed a Ph.D. on the use of vibration analysis techniques for machines monitoring and diagnostic purposes. Although it was the first time that I had approached this subject, I decided to accept this opportunity without hesitation.
Just a short time was needed to realise the stimulating features of this research field. My new Ph.D. activity developed from the results published by Dalpiaz, Rivola and Rubini in 2000. Based on these results, concerning the comparison of the effectiveness and sensitivity of some vibration processing tools for local fault detection in gears, I first proposed the study of non-stationary processing techniques for the detection of assembly faults in I.C. engines by means of cold tests.
After reading some literature papers, I realised the originality of this application.
Hence, the common thread of the research was characterised at once by the study, application and assessment of some non-stationary signal processing techniques, with wavelet transform as the prime mover. This research activity, which has been carried out in cooperation with APICom and VM Motori (Cento, Ferrara, Italy), is described in the first part of this thesis and in the following publications:
[1] S. Delvecchio, G. Dalpiaz, O. Niculita, A. Rivola, Condition monitoring in diesel
engines for cold test applications. Part I: vibration analysis for pass/fail decision,
in Ana C V Veira et oth. editors, Proceedings of the 20th International Congress & Exhibition on Condition Monitoring and Diagnostic Engineering Management, Faro, Portugal, 2007 June 13-15, pp.197-206.
[2] S. Delvecchio, G. Dalpiaz, O. Niculita, A. Rivola, Condition monitoring in diesel
engines for cold test applications. Part II: comparison of vibration analysis techniques, in Ana C. V. Veira et oth. editors, Proceedings of the 20th International
Congress & Exhibition on Condition Monitoring and Diagnostic Engineering Management, Faro, Portugal, 2007 June 13-15, pp.197-206.
[3] O. Niculita, D. Zetu, S. Delvecchio, Contribution regarding the link between total
productive maintenance and product quality, in Proceedings of International
Conference "Modern Technologies, Quality and Restructuring-TMCR 2007", ISBN 978-9975-45-034-8, Chisinau, Moldova, May 31-June 3 2007.
[4] O. Niculita, D. Zetu, S. Delvecchio, A methodology for diesel engines health
monitoring, in Proceedings of International Conference "Modern Technologies,
Quality and Restructuring-TMCR 2007", ISBN 978-9975-45-034-8, Chisinau, Moldova, May 31-June 3 2007.
[5] O. Niculita, S. Delvecchio, D. Zetu, Online diagnosis over internal combustion
engines using visual dot patterns of vibration signals. in Optimum technologic
systems and materials in the machines building field, TSTM- No.12 , Volume II (2006) ISSN 1224-7499, University of Bacau, Romania, 2006.
[6] D. Zetu, O. Niculita, S. Delvecchio, Implementation of image matching correlation
of symmetrized dot pattern of vibration signals in fault diagnosis cold test method for diesel engines. in Optimum technologic systems and materials in the machines
building field, TSTM- No.12 , Volume II (2006) ISSN 1224-7499, University of Bacau, Romania, 2006.
[7] O. Niculita, S. Delvecchio, D. Zetu, Effect of lag on the symmetrized dot pattern
(SDP) displays of the vibration signal of diesel engines in Optimum technologic
systems and materials in the machines building field, TSTM- No.12 , Volume II (2006) ISSN 1224-7499, University of Bacau, Romania, 2006.
[8] S. Delvecchio, G. D’Elia, G. Dalpiaz, Comparing Wigner Ville Distribution and
Wavelet Transform for the vibration diagnosis of assembly faults in diesel engines,
in Proceedings of the 21th International Congress & Exhibition on Condition Monitoring and Diagnostic Engineering Management 2008, Prague, Czech Republic, 2008 June 11-13, pp. 125-134.
[9] S. Delvecchio, G. D’Elia, M. Cavallari, G. Dalpiaz, Use of the cyclostationary
modelling for the diagnosis of assembly faults in I.C. engine cold tests, in P. Sas, B.
Bergen editors Proceedings of ISMA2008 International Conference on Noise and Vibration Engineering, Leuven, Belgium, 2008 September 15-17, pp. 3191-3204. [10] S. Delvecchio, G. D’Elia, G. Dalpiaz, Application of advanced vibration signal
processing techniques in I.C. engine cold tests, in U. Meneghetti, A. Maggiore and
V. Parenti Castelli editors Memorie della Seconda Giornata di Studio “Ettore Funaioli”, Bologna, Italy, 2008 Luglio 18.
I spent a 9-month-research period at the Department of Mechanical Engineering at KUL (Katholieke Universiteit Leuven) in Leuven (Belgium) within the Noise and Vibration research group. The research activity I carried out during my stay in KUL concerned the use of vibro-acoustic techniques to evaluate the efficiency of the threshing process in non conventional harvesting machines. The idea was to evaluate the influence of the most important factors affecting the process on the vibro-acoustic response of the threshing unit. The objective was to define the best machine setting to improve the quality of the crop. The research to find some correlation among several vibro-acoustic features and “quality” parameters was another goal of this thesis. The methodology and the results of this activity are summarised in the second part of this thesis and in the following technical report:
[11] S. Delvecchio, Condition monitoring of the threshing process in harvesting
machines by means of vibro-acoustic analysis. Technical Report, Katholieke
Universiteit Leuven, Department of Mechanical Engineering, PMA Division, Noise and Vibration Group, (MOD), 2008 March 7.
Moreover I was involved in other research activities in the field of diagnostics of rotating machines by means of vibration analysis. These activities and the achievements obtained are described in the following papers:
[12] S. Delvecchio, G. Dalpiaz, E. Mucchi. Condition monitoring of marine couplings
through vibration analysis techniques, in Proceedings of the Second World
Congress on Engineering Asset Management and the Fourth International Conference on Condition Monitoring 2007, Harrogate, UK, 11-14 June 2007, pp. 506-515.
[13] G. D’Elia, S. Delvecchio, G. Dalpiaz, Gear spall detection by non-stationary
vibration signal analysis, in P. Sas, B. Bergen editors Proceedings of ISMA2008
International Conference on Noise and Vibration Engineering, Leuven, Belgium, 2008 September 15-17, pp. 777-792.
The first paper shows the application of some processing techniques for the vibration analysis in working conditions of two different types of marine flexible couplings for boat propulsion. Due to the presence of impulses in the signals, Continuous (CWT) and Discrete Wavelet Transform (DWT) are applied and compared with the conventional time and frequency domain methods. In this thesis the wavelet analysis was
used for impulsive component extraction and the choice of different wavelet functions was evaluated for this purpose. The results suggested that the wavelet transform techniques were effective in the indication of which type of coupling provided good vibrational behaviour, especially in working conditions when the angular speed of the propeller shaft was often inverted.
The second paper relates to the diagnosis of gear local faults by non-stationary signal analysis such as CWT, Wigner-Ville Distribution (WVD) and cyclostationary analysis. The results indicated the sensitivity of each technique to extract faults in simulated and real signals.
Finally, another activity that I carried out during my PhD course was the design of a test bench for the vibro-acoustic analysis of rotating machines for educational and research purposes, as described in:
[14] G. Dalpiaz, G. D’Elia, S. Delvecchio. Design of a test bench for the vibro-acustical
analysis and diagnostics of rotating machines. In Proceedings of the Second World
Congress on Engineering Asset Management and the Fourth International Conference on Condition Monitoring 2007, Harrogate, UK, 11-14 June 2007, pp.497-505.
The ability of the bench to change different configurations easily makes it useful to carry out a great number of experiments concerning the vibrations produced by gears and rolling bearings in sound conditions and with different types of faults, as well as misalignments between shafts, static and dynamic unbalance and critical speeds.
This thesis gathers and summarises the theories, results and considerations that I have draw in the three years of my Ph.D. course, on the topic of condition monitoring and quality control in I.C. engines and harvesting machines by means of advanced vibration processing techniques. I hope these theories, results and considerations will be useful for future students and other researchers working in the field of vibration signature analysis.
Ferrara, 27/3/2009
List of Abbreviations
AR Autoregressive
AppEn Approximate Entropy
CF Crest Factor
CWT Continuous Wavelet Transform
CRM Faulty engine with wrong assembly of counter-rotating masses
CT Correlation Threshold
BDC Bottom Dead Centre
DSP Digital Signal Processing DWT Discrete Wavelet Transform
FFT Fast Fourier Transform
IAS Instantaneous Angular Speed IF Impulse Factor
MIP Mean Instantaneous Power MOG Material Other than Grain
PDF Probability Density Function PM Phase Modulation
PSD Power Spectral Density RMS Root Mean Square value
RC4 Faulty engine with rod without bearing cap RS3 Faulty engine with rod not correctly pre-loaded
SCD Spectral Correlation Density SDP Symmetrized Dot Pattern SK Spectral Kurtosis SNR Signal to Noise Ratio
STFT Short Time Fourier Transformation
TDAS Time Domain Across the Scales TDC Top Dead Centre
TK Temporal Kurtosis TSA Time Synchronous Average
WV Wigner Distribution WVD Wigner Ville Distribution WVS Wigner Ville Spectrum
CONTENTS
Riassunto...i Abstract ...v Acknowledgements ... ix Preface ... xi List of Abbreviations ...xvList of Figures ... xix
Chapter 1 INTRODUCTION 1.1 What is this thesis about?... 29
1.2 Vibration condition monitoring and diagnostics ... 30
1.3 I.C engine cold tests ... 32
1.4 The threshing process in non-conventional harvesting machines ... 36
1.5 Aims and methodologies of the research... 40
1.6 Overview of the Thesis... 43
Chapter 2 SIGNAL PROCESSING TECHNIQUES 2.1 Introduction ... 45
2.3 Frequency domain analysis ... 65 2.4 Time-frequency analysis ... 66 2.5 Cyclostationary analysis... 86 2.6 Non stationary component extraction using Spectral Kurtosis
(SK) ... 89 Chapter 3
CONDITION MONITORING AND DIAGNOSIS IN I.C. ENGINE COLD TESTS
3.1 Introduction ... 93 3.2 Experimental apparatus and test conditions ... 94 3.3 Dynamic model of a mono-cylinder engine in a non-combustion state ... 97 3.4 Condition monitoring ... 103 3.5 Fault diagnosis ... 107 3.6 Instantaneous Angular Speed (IAS) analysis... 132 Chapter 4
CONDITION MONITORING OF THE THRESHING PROCESS IN HARVESTING MACHINES
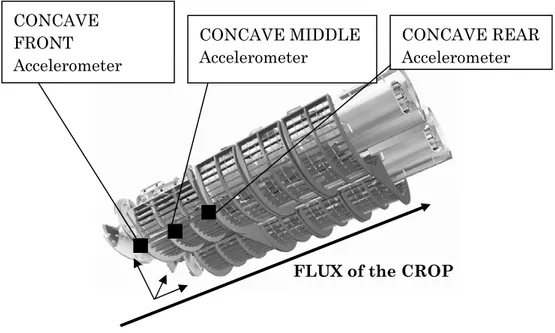
4.1 Introduction ... 139 4.2 The threshing process: description of the mechanical parts. 140 4.3 Experimental apparatus and tests conditions... 142 4.4 Data pre-processing ... 144 4.5 Characteristics of the vibration signature ... 149 4.6 Condition monitoring procedure... 163 4.7 Extraction of non stationary components: use of Discrete
Wavelet Transform (DWT) for filtering purposes... 208 4.8 Evaluation of the rasp bar actions using the TSA of the
vibration and sound pressure signals ... 212 Chapter 5
CONCLUSIONS... 221 References ... 227
List of Figures
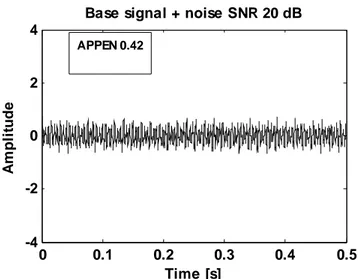
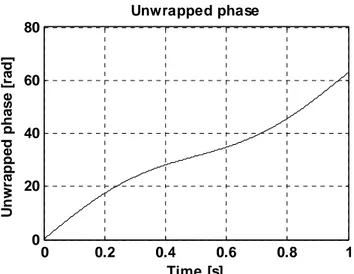
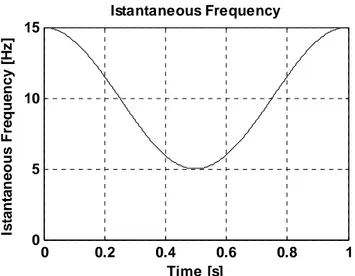
– Cold test bench and data acquisition system. ...32 – Frontal rotors in conventional combine harvesters. ...36 – Longitudinal rotors in non-conventional combine harvesters...37 – Five combine harvester functions. ...38 – Example to illustrate TK sensitivity...49 – Periodic signal with 5 frequency components. ...53 – Periodic signal with 5 frequency components plus additive noise with SNR of 20 dB. ...54 – Periodic signal with 5 frequency components plus additive noise with SNR of 5 dB. ...55 – Original signal (dashed line); amplitude modulated signal (normal line); amplitude modulation signal (solid line)...58 – Phase modulated signal (normal line); amplitude modulation signal (solid line). ...59 – Unwrapped phase of the phase modulated signal depicted in Fig. 2.6. ...59 – Detrend of the phase signal depicted in Fig. 2.7. ...60 – Instantaneous frequency of the phase modulated signal depicted in Fig. 2.6. ...60 – SDP method: (a) time input waveform; (b) symmetrized dot polar graph and (c) image obtained after the edge detection algorithm application. ...63 – Matrix representation of the FFT algorithm...65 – Simulated signal without additive noise. ...72
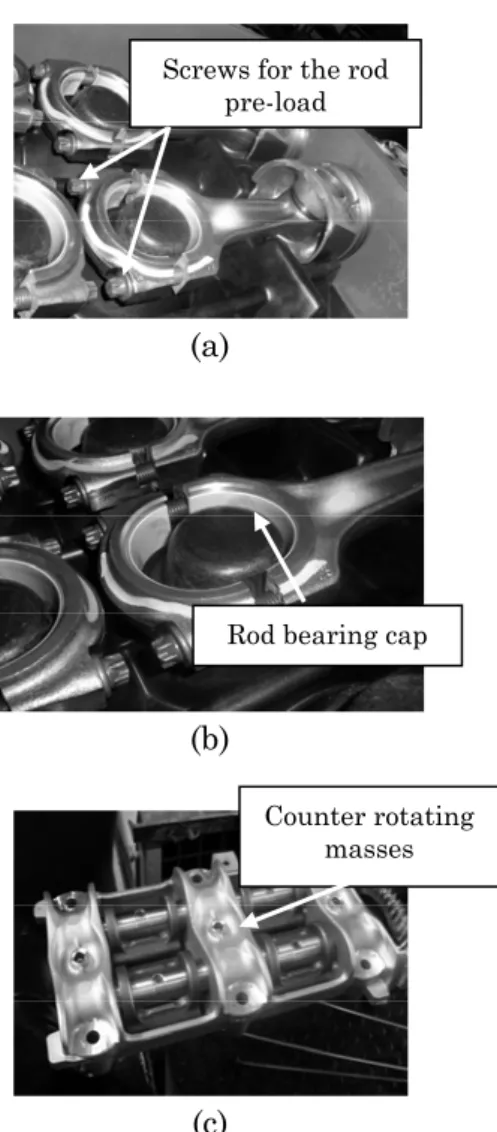
– CWT (Morlet wavelet) of the simulated signal without noise: traditional method. ...74 – CWT (Morlet wavelet) of the simulated signal without noise: purification method...74 – CWT (Impulse wavelet) of the simulated signal without noise: traditional method. ...75 – CWT (Impulse wavelet) of the simulated signal without noise: purification method...75 – CWT (Impulse wavelet) of the simulated signal and additive noise (SNR 5dB): traditional method. ...76 – CWT (Impulse wavelet) of the simulated signal and additive noise (SNR 5 dB): purification method...76 - CWT (Impulse wavelet) of the simulated signal and additive noise (SNR 1 dB): traditional method. ...77 – CWT (Impulse wavelet) of the simulated signal and additive noise (SNR 1 dB): purification method...77 – PSD of the test signal. ...91 – SK of the test signal...91 – Mechanical devices involved in 3 faulty conditions under study. ...96 – Cold test bench and data acquisition system. ...98 – Dynamic model of a single-cylinder engine: global coordinate system x-y...98 – Local coordinate system (z-w) integral with the piston rod...99 – Theoretical air pressure within the combustion chamber...99 – Polar graph of the
R
zw force transmitted by the rod against thecrankpin during two crankshaft revolutions: first crankshaft revolution (solid line) and second crankshaft revolution (dashed line). ...102 – Zoom of the polar graph depicted in ...102 – First experimental investigation (120 rpm); PSD of the engine block acceleration in (a) healthy and (b) faulty condition (RS3 engine)...104 – Symmetrized Dot Polar graph: Healthy engine (reference pattern). 106 – Symmetrized Dot Polar graph: faulty engine (pre-loaded rod: RS3).106 – IC engine vibration signal model considering only pressurization, inertial forces and an impulsive component...109
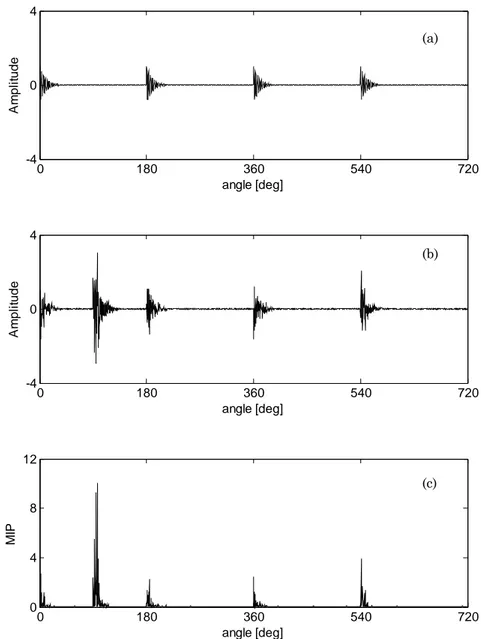
– Model of I.C. engine vibration signal, considering only pressurization, inertial forces and an impulsive component: (a) deterministic part; (b) cyclostationary part; (c) mean instantaneous power of the residual signal. ...110 – WVS of the cyclostationary part depicted in Fig. 3.12 (b). ...111 – CWT (traditional method - impulse wavelet) of the TSA (16 averages) of the raw signal model...114 – CWT (traditional method - impulse wavelet) of the TSA (16 averages) of the raw signal model after adding noise (SNR=1 dB)...114 – TDAS using linear average (impulse wavelet) of the raw signal model after adding noise (SNR=1 dB). ...115 – CWT (traditional method - morlet wavelet) of the TSA (16 averages) of the raw signal model...115 – CWT (traditional method - morlet wavelet) of the TSA (16 averages) of the raw signal model after adding noise (SNR=1 dB)...116 – TDAS using linear average (morlet wavelet) of the raw signal model after adding noise (SNR=1 dB). ...116 – RS3 engine: (a) Time Synchronous Average, (b) residual signal, (c) Mean Instantaneous Power of the residual signal, (d) engine event diagram...121 – RS3 engine. WVD of the (a) TSA and (b) residual signal. ...122 – RS3 engine - CWT (traditional method - impulse mother wavelet) of the: (a) TSA and (b) residual signal. ...123 – RS3 engine - CWT of the TSA: purification method (impulse mother wavelet). ...124 – RS3 engine - CWT of the TSA: traditional method (morlet mother wavelet). ...124 – RS3 engine - TDAS using linear average (traditional method - morlet wavelet). ...125 – RS3 engine - TDAS using geometric average (traditional method - morlet wavelet). ...125 – RS3 engine – WVS of the residual signal. ...126 – RC4 engine: (a) Time Synchronous Average, (b) residual signal, (c) Mean Instantaneous Power of the residual signal, (d) engine event diagram...127
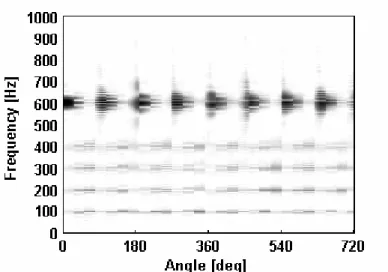
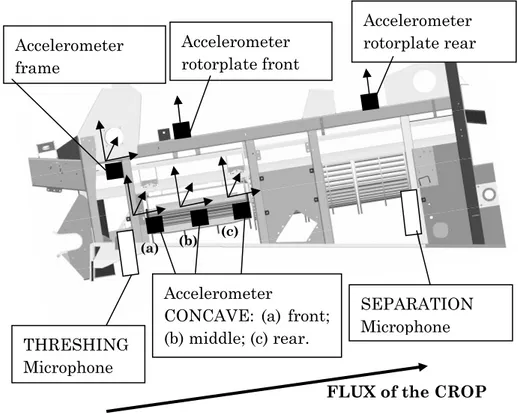
– CRM engine: (a) Time Synchronous Average, (b) FFT of the TSA, (c) FFT of the TSA amplitude modulation...130 – Healthy engine: (a) Time Synchronous Average, (b) FFT of the TSA, (c) FFT of the TSA amplitude modulation...131 – Waterfall of synchronous IAS acquisitions in two crankshaft revolutions...133 – TSA of IAS: (a) Healthy engine; (b) RS3 engine; (c) RS4 engine...135 – Healthy engine: (a) torsional TSA acceleration after differentiation of IAS trend depicted in Fig. 3.32 (a); (b) residual torsional acceleration; (c) MIP of the residual torsional acceleration. ...136 – RS3 engine: (a) torsional TSA acceleration after differentiation of IAS trend depicted in Fig. 3.32 (b); (b) residual torsional acceleration; (c) MIP of the residual torsional acceleration. ...137 – RC4 engine(a) torsional TSA acceleration after differentiation of IAS trend depicted in Fig. 3.32 (c); (b) residual torsional acceleration; (c) MIP of the residual torsional acceleration. ...138 – Threshing unit: mechanical parts involved in the threshing process. ...141 – Harvesting unit: threshing and separation zones...141 – Feedrate signal measuring the amount of crop processed: processing phases. ...144 – Test setup: accelerometers and microphones mounted INSIDE the machine. ...145 – Test setup: microphone mounted OUTSIDE the machine, over the cabin...146 – Test setup: triaxial concave accelerometers directions...146 – Threshing zone -Test setup: focus on the CONCAVE accelerometers: front, middle and rear positions...147 – Segmentation analysis...148 – PSD of the raw and multiband filtered concave middle radial vibration signal. ...148 – Run 27 - PSD of the vibration signal - Radial direction - Positions: (a) concave front, (b) concave middle, (c) concave rear...152 – Position: concave front - PSD of the vibration signal - Radial direction - Runs: (a) 54, (b) 36, (c) 12...154
– Position: concave middle - PSD of the vibration signal - Radial direction - Runs: (a) 54, (b) 36, (c) 12. ...155 – Position: concave rear - PSD of the vibration signal - Radial direction - Runs: (a) 54, (b) 36, (c) 12. ...155 – Run 27 - Position: concave middle; Radial direction. PSD of the vibration signal: focus on the 0-600 Hz frequency range...156 – Run 27 - Different concave positions - Radial direction: PSD in the entire bandwidth...156 – Run 27 - Different concave positions - Radial direction: PSD in the range 0-600 Hz. ...157 – Run 27 - Concave middle position - 3 directions: PSD in the range 0-600 Hz...157 – Run 27 - Different concave positions - Tangential direction: PSD in the entire bandwidth...158 – Run 27 - Different concave positions - Tangential direction: PSD in the range 0-600 Hz. ...158 – Run 27 -Position: frame; Radial direction. PSD of the vibration signal: focus on the 0-600 Hz frequency range...159 – Real concave middle vibration signal decomposition: (a) Synthesized sinusoidal component in load condition; (b) Synthesized noise component in load condition; (c) Measured raw signal in idle conditions.
...160 – Run 27: PSD of the front and rear rotorplate vibration signals in the entire bandwidth...161 – Run 27: PSD of the front and rear rotorplate vibration signals in the 0-600 Hz frequency range...161 – PSD of the sound pressure measured by threshing and separation microphones. ...162 – PSD of the sound pressure measured by threshing and separation microphones: focus on the 0-600 Hz frequency range...163 – Concave middle radial vibration signal: influence of capacity at 1350 rpm and 5 mm concave distance (see Table 14). ...167 – Concave middle radial vibration signal: influence of capacity at 1350 rpm and 13 mm concave distance (see Table 15). ...167
– Rotorplate front vibration signal: influence of capacity at 1350 rpm and 25 mm concave distance (see Table 16). ...168 – Av. RMS vs. capacity - Concave radial vibration signal: (a) front, (b) rear, (c) middle positions. ...170 – Av. TK vs. capacity - Concave radial vibration signal: (a) front, (b) rear, (c) middle positions. ...171 – Av. (a) CF and (b) IF vs. capacity - Filtered middle concave radial signal (600-3000 Hz). ...172 – Av. AppEn vs. capacity – Raw concave middle radial signal. ...173 – (a) Loudness and (b) Sharpness of the sound pressure signal measured by the microphone outside the cabin. ...174 – Concave middle radial vibration signal: influence of concave distance at 1350 rpm and 90 ton/h capacity (see Table 17)...176 – Rotorplate front vibration signal: influence of concave distance at 1350 rpm and 90 ton/h capacity (see Table 17). ...177 – Concave middle radial vibration signal: influence of the concave distance at 1350 rpm and 10 ton/h capacity (see Table 18)...177 – Concave middle radial vibration signal: evolution of (a) RMS and (b) TK at 50 ton/h capacities for different concave distances...178 – Av. RMS vs. concave distance - Concave rad. vibration signal - positions: (a) front, (b) rear, (c) raw middle, (d) filtered middle...179 – Av. TK vs. concave distance - Concave radial vibration signal: (a) front, (b) rear, (c) middle positions...181 – Av. (a) CF and (b) IF vs. concave distance - Filtered middle concave radial signal (600-3000 Hz). ...182 – Av. AppEn vs. concave distance – Raw concave middle radial signal. ...183 – (a) Loudness and (b) Sharpness of the sound pressure signal measured by the microphone outside the cabin. ...184 – Concave middle radial vibration signal: influence of the rotor speed at 72 ton/h capacity and 13 mm concave distance...186 – Rotorplate vibration signal: influence of the rotor speed at 72 ton/h capacity and 13 mm concave distance. ...186 – Av. RMS vs. rotor speed - Concave radial vibration signal: (a) front, (b) rear, (c) middle positions. ...187
– Av. TK vs. rotor speed - Concave radial vibration signal:(a) front, (b) rear, (c) middle positions. ...188 – Av. (a) CF and (b) IF vs. rotor speed - Filtered middle concave radial signal (600-3000 Hz). ...190 – Av. AppEn vs. rotor speed – Raw concave middle radial signal...190 – (a) Loudness and (b) Sharpness of the sound pressure signal measured by the microphone outside the cabin. ...191 – Sound pressure signals weighted A in LM and HM conditions: (a) outside, (b) separation, (c) threshing microphone...193 – Plant: grain kernels and straw. ...194 – RMS value of the concave middle radial vibration signal: influence of the grain to straw ratio at (a) 102 ton/h, (b) 90 ton/h, (c) 72 ton/h, (d) 51 ton/h...195 – Distribution of the gross content of the containers at the cleaning position. A beta function has been fit on this data...198 – Concave middle vibration radial signal: Av. RMS values (600-3000 Hz) vs. Threshing Losses...200 – Concave middle vibration radial signal: Av. TK values (600-3000 Hz) vs. Threshing Losses...200 – Concave middle vibration radial signal: Av. AppEn values vs. Total Loss: Runs carried out at 1350 rpm and 13 mm concave distance. ...201 – Sound pressure signal from microphone outside: Av. Loudness vs. Total Loss. ...201 – Sound pressure signal from microphone outside: Av. Loudness vs. Total Loss: Runs carried out at 1350 rpm and 13 mm concave distance.
...202 – Sound pressure signal from microphone outside: Av. Sharpness vs. Total Loss. ...202 – Sound pressure signal from microphone outside: Av. Sharpness vs. Total Loss: Runs carried out at 1350 rpm and 13 mm concave distance.
...203 – Field tests: Av. TK vs. Broken Grains. ...204 – Concave middle vibration radial signal: Av. AppEn values vs. Gross 90% position: Runs carried out at 1350 rpm and 13 mm concave distance...205
– Sound pressure signal from microphone outside: Av. Loudness vs. Gross 90% position...205 – Sound pressure signal from microphone outside: Av. Loudness vs. Net 90% position: Runs carried out at 1350 rpm and 13 mm concave distance...206 – Sound pressure signal from microphone outside: Av. Sharpness vs. Net 90% position. ...206 – Sound pressure signal from microphone outside: Av. Sharpness vs. Net 90% position: Runs carried out at 1350 rpm and 13 mm concave distance...207 – Concave middle radial signal: comparison between (a) detail D2 obtained after DWT multiresolution analysis and (b) filtered signal in the range 750-1500 Hz...210 – Typical TK for different wavelet levels...211 – SK: effect of the window length...211 – Influence of the concave distance: Av. TK calculated for (a) raw signal, (b) signal filtered in the range 750-1250 Hz...212 – TSA of the concave middle tangential vibration signal: effects of the rasp bars and friction elements...213 – Concave middle tangential vibration signal: (a) TSA, (b) FFT of TSA, (c) Unwrapped Phase Modulation (PM) of TSA, (d) Instantaneous Frequency of TSA...216 – Threshing microphone signal: (a) TSA, (b) FFT of TSA. ...217 – TSA of the concave middle tangential vibration signal at 90 ton/h capacity: (a) 5 mm, (b) 13 mm, (c) 25 mm concave distances. ...218 – TSA of the concave middle tangential vibration signal at 51 ton/h capacity: (a) 5 mm, (b) 13 mm, (c) 25 mm concave distances. ...218 – TSA of the threshing microphone signal at 90 ton/h capacity: (a) 5 mm, (b) 13 mm, (c) 25 mm concave distances. ...219 – TSA of the threshing microphone signal at 51 ton/h capacity: (a) 5 mm, (b) 13 mm, (c) 25 mm concave distances. ...219
Chapter 1
INTRODUCTION
1.1 What is this thesis about?
This thesis deals with the problem of condition monitoring and diagnostics in I.C. engines and harvesting machines by means of vibration signature techniques.
Concerning the issue of I.C. (Internal Combustion) engine quality control, three main questions are posed:
− Are the vibration measurements obtained from the cold tests useful in detecting assembly faults in diesel engines?
− Is it possible to assess a fast and reliable monitoring procedure to make a correct pass/fail decision at the end of the engine assembly line?
− Which is the most effective technique to diagnose malfunctions (not common in literature) in engines by means of the analysis of vibration signals carried out in a non-combustion state?
Concerning the harvesting process condition monitoring, the three main questions are the following:
− What do the concave vibrations tell about the threshing process?
− How are the vibrations correlated to the threshing/separation process?
− Can we use information from vibrations to predict the efficiency performances?
1.2 Vibration condition monitoring and diagnostics
The purpose of condition monitoring is to use information extracted from the vibro-acoustic signature of a machine to detect faults or to define its state of health. A change in the vibration signature not only indicates a change in machine conditions but also points directly to the source of the signal alteration.
Fault diagnosis, condition monitoring and fault detection are different terms sometimes used improperly. Condition monitoring and fault detection refer to the evaluation of the state of a machine and the detection of the anomaly. Fault diagnosis could be separated from the others because it is more rigorous and requires the identification of the component or process that causes the machine’s deviation from the normal state.
In each chapter of this thesis the term “signature’ will be mentioned many times in order to stress its fundamental role in describing the state of the machine. Since it is impossible to quantify the amount of information collected in the vibration signature of a machine, the aim of this work is to extract and relate some of this information to the components or operational factors that produce significant alterations within the signal.
Because of its non-intrusive behaviour and ability in diagnosing a wide range of mechanical faults, the vibration monitoring techniques are commonly used by manufacturing companies. Moreover, the increase of computing power has helped the employment and development of signal processing techniques.
Firstly, the monitoring procedure involves the acquisition of vibration signals by means of piezo-electric accelerometers. Because of the critical selection of the acquisition parameters, the data acquisition step is not of minor importance. Sometimes, several operations, like
correct selection of time histories, averaging and digital filtering are needed in order to separate the useful part of the signal from the noise (electrical an mechanical), which is often present in the industrial environments.
Secondly the signal processing techniques have to be implemented by taking into account the characteristics of the signal and the type of machine from which the signal is being measured (i.e. rotating or alternative machine with simple or complex mechanisms).
Eventually, several features have to be extracted in order to assess the physical state of the machine or to detect some incipient defects and to determine the causes of their presence.
Concerning the I.C. cold tests engine application the signature processing techniques can be used in order to obtain a reliable pass/fail decision for the quality control of the diesel engines at the end of the assembly line. Moreover, some vibration analysis tools can be considered useful in indicating the mechanical part affected by the defect.
Regarding the threshing process application, condition monitoring can be used for the following purposes: to extract not redundant features physically related to the nature of the signal measured on combine harvesters; obtaining meaningful correlations between the vibration features and efficiency parameters (i.e. losses and quality of the crop) in order to validate an automatic procedure of feature selection; achieve information about the influence of the operational parameters (i.e. rotor speed, concave distance and amount of crop processed) that mostly influence the process.
1.3 I.C engine cold tests
Nowadays, the main part of engine manufacturers test their engines by means of a “hot test”, i.e. a test in which the engine is firing. On the other hand, recently, some companies have instead chosen to introduce a “cold test”, but this method has to be further improved.
Fig. 1.1 – Cold test bench and data acquisition system.
The essential difference between these two methods is that the hot test aims at verifying the engine performance, while the cold test aims at verifying the anomalies by means of torque, pressure and vibration measurements.
It is worth noting that in the hot test only the main anomalies could be detected, while in the cold test the fault detection is more precise and effective, since no noise and vibration due to the firing are added.
In the “hot test”, each engine must be connected to a test bench. This test bench includes a brake, provides the cooling (water, oil) and connects to the other auxiliary services in working condition as fuel, gas and air. For this reason, a complete hot test procedure takes more than ten minutes. At present, the hot test technology only indicates to the
manufacturer which engines are not good for customers, but does not give any more information regarding the causes of the fault producing the malfunction.
The introduction of this technology decreases the noise produced during the test as well as the number of personnel involved, which reduces the costs of testing and fast detection of faults and of their causes.
As it is well-known, mechanical faults in machines often show their presence through abnormal vibration signals, thus techniques for machine condition monitoring based on the analysis of these signals are widely used [1]-[8].
However, most of the studies have been carried out on simple mechanical parts, such as gears and rolling bearings, having well-determined dynamic characteristics. Therefore, gearbox condition monitoring and bearing defect analysis using vibration signatures are extensively reported [9]-[15]. Moreover, some works related to the condition monitoring of the drilling process are present in literature [16]-[18].
Vibration of reciprocating machinery such as internal combustion engines, compressors and pumps is far more complex and difficult to analyse. Moreover, the analysis of vibration signals of I.C. engines is affected by the complexity of the engine; some useful information can be deduced by Wowk [4] that “excessive vibration on reciprocating engines can be caused by operational problems such as misfiring, piston slap, compression leaks, faulty fuel injection and valve clash”.
Therefore, each type of fault may produce a different vibration signature which can be detected by means of proper signal processing techniques.
Generally speaking, fault detection and the diagnosis of I.C. engines can be carried out using different strategies. One strategy can consist of modelling the whole mechanical system using lumped or finite element methods in order to simulate several faults and compare the results with those found through the experimental tests. Another strategy can adopt signal processing techniques in order to obtain features or maps that can be used to detect the presence of the defect. Concerning this, a
decision algorithm is needed for a visual or automatic detection procedure. Moreover, the maps can also be also analysed for diagnostic purposes. This method is the most commonly used and well suited for the judgment of expert technicians.
Most of the work in literature, concerning the above-mentioned strategies, refers to engines in firing condition.
Kimmich et al. proposed a model-based diagnosis method [19]. Hugh Thomas et al. developed a diagnostic method to detect engine knock using pattern recognition with wavelet networks [20]. Molinaro et. al. used some pattern recognition detectors, such as cepstral coefficients and amplitude histograms, in order to improve knock recognition in spark engines [21]. Li et al. used the Independent Component Analysis to decompose noise signals into a number of independent components and, consequently, study each individual component separately [22].
Antoni et al. [23]-[24] proposed a methodology based on the properties of cyclostationarity that was applied to the malfunctions related to engines in firing (advance and delay of injections, misfires and knocks). In one of their papers they use the vibration signal to derive the cylinder pressure overcoming the issue of fixing pressure transducers to the engine. Zouari et al. applied the cyclostationary modelling to signals measured from reciprocating compressors [26].
The application of time-frequency distribution techniques is well suited for the analysis of non-stationary signals and has been widely applied to engine monitoring. The Short-Time Fourier Transform (STFT), the Wigner-Ville Distribution (WVD) and the Continuous Wavelet Transform (CWT) were used in order to distinguish faulty conditions from normal ones for practical fault diagnosis and not to obtain reliable parameters for an automatic procedure led by a data acquisition system [27]-[30]. In particular, Liu and Ling [31] proposed a novel method for extracting features from vibration signatures of a diesel engine using wavelet packets. They were able to extract the wavelets that contain maximum information about the induced fault condition.
Some approaches have been introduced by applying the measurement of instantaneous angular speed for detection of fuel leakage in engines in firing [32]. Yang et al. use the instantaneous angular speed to detect faults relating to the gas pressure in the cylinder [33].
All these techniques are often applied for tests on engines in firing conditions. Moreover, all these methods, based on standard and advanced techniques, are effective for the manual analysis based on meaningful comparisons among vibration signatures or patterns obtained from these signatures.
Accurate comparisons require extensive experience usually acquired at the cost of less production efficiency. Moreover, a degraded product quality may be obtained due to mistakes in judgments.
The use of vibration measurements for the purpose of condition monitoring in end-testing is most commonly practiced by gearbox manufacturers. Usually, as said before, the measurements are shown graphically and are analysed manually by a technician.
On the other hand, engine industrial manufacturing testing requires automatic analysis: vibration is measured and some features have to be set in order to classify a condition as pass/failure.
Hence, this thesis aims to investigates the problem of obtaining reliable features for the pass/ fail decision. Then it seeks to obtain a robust diagnostic procedure in order to detect the cause of the possible malfunction.
1.4 The threshing process in non-conventional harvesting machines
The combine harvester, or simply combine, is a machine which "combines" the tasks of harvesting, threshing and cleaning grain plants [34]. The desired result is the seed or grain (including corn, soybeans, flax, oats, wheat, or rye among others).
Fig. 1.2 – Frontal rotors in conventional combine harvesters.
For a considerable time, combine harvesters used the conventional design, in which three rotating cylinders at the front-end knocked the seeds out of the heads. The rest of the machine was used to separate the straw from the chaff, and the chaff from the kernels.
Since the threshing and separation processes are more related to the centrifugal force and less to gravity, the adoption of the non-conventional design was needed.
Fig. 1.3 – Longitudinal rotors in non-conventional combine harvesters. By the early eighties, most major manufacturers had settled on the non-conventional design. More advantages were obtained in terms of faster grain harvesting and gentler treatment of fragile seeds. In fact the faster rotational speeds of the previous conventional threshing cylinders caused the kernels to break.
High threshing efficiency and better kernel separation are the major characteristics of the non-conventional "two rotor" technology (see Fig. 1.3).
The main basic functions performed by the non-conventional harvester are the following:
− The cutting of the crop and the collection of the moved crop material (1);
− The threshing (2) and separation (3) of kernels from the straw; − The cleaning process (4) to separate kernels from other small
particles such as chaff and short straw;
Fig. 1.4 – Five combine harvester functions.
As the crops enter between the rotors and the large concave, spirally mounted rasp bars rub the grains out.
An helicoidally flux of the crop is formed by the two rotors. It is worth noting that the threshing path is more than ten times multiplied more than the one obtained by means of the previous conventional technology.
The threshing process is given by two principal effects:
− the "grain to grain” effect (i.e. the threshing of the grain kernels among themselves);
− the threshing between the kernels and the concave.
The grain to grain effect allows high grain quality to be obtained with less broken kernel grains.
The rasp bars and the friction elements mounted on the rotors favour the friction of the crop against the concaves.
Moreover, the concave is huge and offers the possibility of continuous separation: repeated agitation of the crop by the rasp bars and friction elements offers an uninterrupted threshing process.
A more detailed explanation of the mechanical components and their function will be given in the next Chapter 4.
Several factors have relevant influence over the process. They can be summarised as follows:
− environmental crop conditions; − crop variety;
− setting of cutter bar;
− grain to straw ratio (i.e. length of the plant); − rotor speed;
− ground speed;
− concave clearance (radial distance between concave and rotor); − total amount of crop material entering the machine (capacity). In Chapter 4 a more specific description of the quality indicators for the threshing process and the procedure for their determination will be given.
So, it is easy to understand that since there is the "grain to grain effect" when capacity increases the threshing efficiency increases. Moreover, a faster rotor speed and a lower concave clearance assure a improved crop separation (the centrifugal force consequently increases) but make the threshing more aggressive, causing inferior crop quality.
In conclusion, we assume the following parameters as the most important useful indicators, which can be used for the evaluation of the quality of the threshing process.
− loss amount; − kernel integrity;
− distribution of crop on the pan and upper sieve.
Most of the studies carried out in condition monitoring of industrial processes concern production processes, such as papers related to the classification of cutting tool wear and the monitoring of the mechanical assembly of parts, while applications on the threshing process do not exist in literature. Only [35] showed some results about conventional machines.
1.5 Aims and methodologies of the research
The first part of this thesis deals with the analysis of vibration signatures obtained from diesel engines during cold tests.
Since the cold test imposes a pass/fail decision comparing vibration features with proper threshold values, the effectiveness of some features obtained from image correlations of the Symmetrized Dot Pattern of the vibration signal (SDP) is discussed. By means of this method, the normalized time histories of the vibration signal can be represented as symmetrized dot graphs. In order to implement this technique in the cold test procedure for fault detection, an image correlation system has been developed, applying the algorithm of the edge detection that represents the most common approach for detecting meaningful discontinuities in intensity values. The basic idea behind the edge detection is to find the points where the intensity rapidly changes. The goal is to identify a reference pattern that represents the normal condition and then compare the images obtained from all the test engines with this ‘healthy pattern’ by means of a similarity parameter. Among many possibilities, this parameter, called correlation, was chosen as the percentage of common white pixels with respect to the total number of white pixels in the healthy engine pattern.
For fault diagnostic purposes the author seeks to obtain accurate event identification, taking the advantages of the cyclostationary modelling of the vibration signal. First of all, first-order cyclostationarity is exploited through the analysis of the Time Synchronous Average (TSA). Subsequently, second-order cyclostationarity is developed by means of Wigner-Ville Distribution (WVD), Wigner-Ville Spectrum (WVS) and Mean Instantaneous Power (MIP).
Additionally, a correlation between the results obtained from the cyclostationarity analysis and the angular position of the mechanical events is carried out in order to detect and localize the presence of the faults. In order to make quantitative evaluations about the cyclostationary analysis capabilities, a signal model, which mimics the
realistic vibration signal measured from the cold test, has been analytically formulated.
Moreover, the Continuous Wavelet Transform (CWT) has been presented and compared with the Wigner Ville Distribution. Some CWT enhancements in terms of choice of different wavelet functions, purification method and Time Domain Average across the Scale (TDAS) have also been applied and discussed. The analysis of the Instantaneous Angular Speed (IAS) obtained after the synchronization with the crankshaft revolution has also been carried out in order to test its capabilities in assembly fault detection. The effectiveness and the limitations of the above-mentioned techniques and diagnostic procedures applied to the considered assembly faults have been compared and discussed on the basis of experimental results.
The second part of the thesis deals with the extraction of several features from vibration and microphone signals acquired from the threshing unit of a harvesting machine and the evaluation of their effectiveness in obtaining useful information for condition monitoring purposes. Thus, the aim of this part is the selection of appropriate features from different signals and their capability in explaining the mechanisms of the noise and vibration generation during the threshing process.
Some common and uncommon (i.e. impulse factor and approximate entropy) features have been extracted from several time blocks of the vibration signal. Some data pre-processing such as band-pass and multiband filtering of the time domain signals have been carried out in order to extract more reliable features.
In order to validate the effectiveness of these features and to point out the effects of the different source of excitations (turbulence due to grain on grain threshing and impacts between the kernels and the concave) the Discrete Wavelet Transform (DWT) has been used to filter the original signal: its capability in extracting impulsive components from the signal has been verified.
The rotor crop distribution and, consequently, the efficiency of the process is strongly influenced by a series of operational parameters. The
factors that have the major influence on the process are: the environmental crop conditions, such as moisture, the variety of the crop (wheat and corn have been tested), the grain to straw ratio, the ground and rotor speed, the concave distance (radial distance between the concave and the rotor) and the capacity.
Therefore, the experimental tests have been carried out to obtain good correlation between the features, the above-mentioned operational parameters and threshing efficiency variables (total loss, separation and threshing loss, integrity of the kernels, distribution of the crop over the threshing zone). Some of the threshing efficiency variables have been obtained directly from measurements (i.e. losses), others from probability function calculations (i.e. distribution of the crop over the threshing zone).
Finally, the evaluation of the rasp bar actions (i.e. mechanical parts fixed to the rotor and used to reinforce the threshing action) is carried out by means of the angular domain analysis of the vibration signals measured from the rotor concave. The Hilbert Transform based frequency demodulation technique have also been applied and discussed.
1.6 Overview of the Thesis
Chapter 2 introduces the essential signal processing theoretical background exploiting the formulation of each techniques used in this thesis. Firstly, the mathematical definitions of the time domain features and their physical meaning are described in order to justify their use within the condition monitoring procedure.
Secondly, the well known method in relating the temporal and frequency structure of a signal based on the analytic signal derived using the Hilbert transform is formulated, pointing out its capability to reveal the amplitude modulation and instantaneous phase and frequency of a signal.
Thirdly, two time-frequency techniques, i.e. Continuous Wavelet Transform (CWT) and Wigner Ville Distribution (WVD), are explained, highlighting their effectiveness in overcoming the limitation in resolution of the Short Time Fourier Transform. Two types of mother wavelets are defined such as the Morlet wavelet and the Impulse wavelet. Moreover, the correlation purification method using Morlet and Impulse wavelets is explained: the CWT coefficients are weighted by a coefficient of correlation between the original signal and the sinusoidal function with the frequency corresponding to the wavelet scale. This technique allows a visual enhancement of the transform map.
The WVD is also considered as a cyclostationary analysis tool used to analyse the second order cyclostationary content of the raw signal. Its fundamental properties and some useful statistics extracted from it, such as the Mean Instantaneous Power (MIP), are highlighted.
Chapter 3 is devoted to the description of the results concerning the signature analysis carried out in cold tests on diesel engines. Firstly the characteristics of the cold test technology, the experimental apparatus, the test conditions, the data acquisition system and the artificially introduced faults are described. Then, the results achieved by means of the SDP detecting method, the application of the cyclostationary modelling to a synthesised signal and the comparison between the results obtained through CWT and WVD techniques are also given.
Finally, the cyclostationary capabilities in localising faults and several CWT enhancements (i.e. use of the Impulse mother wavelet, purification and TDAS methods) are discussed on the basis of controlled experimental tests.
Chapter 4 treats the results obtained from the vibration analysis carried out on the harvesting machine. First, the experimental setup designed in order to measure the vibro-acoustic response of the threshing unit is firstly presented. Then, the estimation of the efficiency parameters, such as threshing losses, separation losses, total losses, MOG (Material Other than Grain), distribution of the grain over the sieve and broken grain percentage is exploited. Finally, the results achieved in applying different signal processing tools and the discussion about how the signals are sensitive to the setting parameters and the process efficiency are outlined.
Chapter 5 summarises the achievements and the concluding remarks. The future perspectives are finally proposed.
Chapter 2
SIGNAL PROCESSING TECHNIQUES
2.1 IntroductionAs shown in the Chapter 1, the literature on I.C. engine fault detection is quite rare although a lot of work was carried out in the area of rotating machinery fault detection.
As a matter of a fact, most of the studies have been carried out on simple mechanical parts, such as gears and rolling bearings and no applications to the monitoring of I.C. engine cold test exist. Similarly, there is not mention in literature about the use of the vibration signal to evaluate the efficiency of the threshing process in harvesting machines.
This thesis is an attempt to apply some basic and advanced signal processing techniques in order to study their limits and capabilities in extracting useful information from the vibration signal in hand.
In the next section, an overview of the theoretical background of all the techniques adopted in this work is presented.
The choice of the adopted techniques has been guided by the following questions:
− What is the nature of the measured vibration signal: does it exhibit periodicities or is it random in nature? Is it stationary or non-stationary?
− What techniques have been used conditionally to the nature of the signal? Which is the proper domain of study: time, frequency or joint time-frequency domain?
− Which information can be extracted from the signal by the use of each technique? How effective are the chosen techniques?
So, assumed that the type of signal to be analyzed has an influence on the type of analysis to be carried out, it is of relevant importance to examine the various types of signal that are encountered in practice.
Rigorously, random signals have been described mathematically by using the theory of probability, random variables, and stochastic processes, which are not the aim of this work, but a complete stochastic signal analysis can be found in [36] and [37].
The typical classification of signals considers [38][39]: − Stationary signals;
− Non stationary signals.
The stationary signals are characterized by time-invariant averaged properties and thus independent of the particular sample record used to determine them. This applies to both deterministic and random signals. In particular, a random signal
x t
( )
is called wide-sense stationary if the first order (i.e. mean) and second order (i.e. covariance) statistics of its PDF (i.e. Probability Density Function) are independent. If all moments (or cumulants) of the PDF are time-independent, then the random signalx t
( )
is strict-sense stationary.Since a non-stationary random signal is a signal the statistical structure of which changes as a function of time, it can be defined as a signal which satisfies a non-property, the property of non-stationarity. Non-stationary signals may be divided into continuous non-stationary signals and transient signals which may be defined as those which start and finish at zero. It is interesting to look at another particular class of non-stationary signals that includes the so-called cyclostationary signals, recently investigated by Antoni in the area of condition monitoring of rotating machinery [89].
Analysis of stationary signals has largely been based on time domain techniques and on the Fourier Transform, which identifies the constituent frequency components within the signals. Sections 2.2 and 2.3 treat some concepts concerning the time and frequency domain analysis respectively.
Although the Fourier Transform can be used in analysing signals with periodic impulses (giving rise to uniformly spaced harmonics and sidebands), the time-averaging approach adopting in the Fourier Transform is ineffective in evaluating the time-dependent behaviour of the frequency components.
In contrast, time-frequency techniques decompose one-dimensional series signal into a two-dimensional plane by exposing the time-dependent variations of characteristic frequencies within the signal, thus presenting a valid and effective tool for non-stationary signal analysis than the Fourier Transform. In addition to the classical Short Time Fourier Transform (STFT) - which presents uniform resolution in both time and frequency domains - other time-frequency analysis techniques, such as Continuous Wavelet Transform (CWT), Discrete Wavelet Transform (DWT) and Wigner Ville Distribution (WVD) have been recently developed. The capabilities and the drawbacks of these techniques are explained in the Section 2.4. Then, the properties of the cyclostationary techniques are exploited in Section 2.5.
The last Section 2.6 includes the concept of Spectral Kurtosis (SK) applied to the extraction of non stationary components within a signal.
2.2 Time domain analysis 2.2.1. Time statistical parameters
The time series of a signal can yield a big amount of information. A visual inspection of the portions of the time domain waveform can reveal the nature of the signal (i.e. stationary or non-stationary) and the presence of some intrinsic periodicities.
Simple signal metrics applied to the measured time domain signal can give some useful information which cannot be extracted from other domain analyses. Moreover, time domain metrics are cheap and simple
to implement and they can be determined through the Probability Density Function (PDF).
It is worth noting that they cannot be used to directly indicate the locations of the defect.
Hence, for fault detection purposes, we can refer to: − energy parameters;
− peakedness parameters.
The Root Mean Square value (RMS) is a energy dimensional parameter reflecting the overall level of the signal.
The Crest Factor (CF), Temporal Kurtosis (TK) and Impulse Factor (IF) are non-dimensional parameters that indicate the peakedness of a signal.
The Crest Factor (CF) is equal to the peak amplitude of a waveform divided by the RMS value. It is defined as follows:
Peak
CF
RMS
=
(2.1)The purpose of the CF calculation is to give a quick idea of how much impacting is occurring in a waveform. CF is a normalized measurement of the amplitude of the signal and is designed to increase in the presence of a small number of high amplitude peaks.