11 June 2021
Spagnolo, V., Crezzini, J., Marciani, G., Capecchi, G., Arrighi, S., Aureli, D., et al. (2020). Neandertal camps and hyena dens. Living floor 150A at Grotta dei Santi (Monte Argentario, Tuscany, Italy). JOURNAL OF ARCHAEOLOGICAL SCIENCE: REPORTS, 30.
This is the peer reviewd version of the followng article:
Neandertal camps and hyena dens. Living floor 150A at Grotta dei Santi (Monte Argentario, Tuscany, Italy)
Published:
DOI:10.1016/j.jasrep.2020.102249
Terms of use:
Open Access
(Article begins on next page)
The terms and conditions for the reuse of this version of the manuscript are specified in the publishing policy. Works made available under a Creative Commons license can be used according to the terms and conditions of said license. For all terms of use and more information see the publisher's website.
Availability:
This version is available http://hdl.handle.net/11365/1106591 since 2020-11-30T11:57:38Z
A Mousterian living floor is analysed with a spatial and interdisciplinary approach A complex processual history was reconstructed by a taphonomic perspective A brief hyena den shortly preceded the structured Neandertals camp
Faunal processing, lithic production and shell-related activity were found Multipurpose hearth-related activity areas were found
Neandertal camps and hyena dens. Living floor 150A at Grotta dei Santi (Monte Argentario, Tuscany, Italy)
Vincenzo Spagnoloa, b [email protected]; Jacopo Crezzinia, b [email protected];
Giulia Marciania, c [email protected]; Giulia Capecchia, b [email protected]; Simona
Arrighia, b, c [email protected]; Daniele Aurelia, b, e [email protected]; Isak Ekbergg
[email protected]; Sem Scaramuccia, b [email protected]; Laura Tassonid
[email protected]; Francesco Boschina, b [email protected]; Adriana Moronia, b, f
a. Dipartimento di Scienze Fisiche, della Terra e dell’Ambiente, Unità di Ricerca di Preistoria e Antropologia, Università degli Studi di Siena (UniSI) – Strada Laterina, 8, 53100, Siena, Italy; b. Centro Studi sul Quaternario Onlus – Via Nuova dell’Ammazzatoio, 7, 52037, Sansepolcro (AR), Italy.
c. Department of Cultural Heritage, Università di Bologna (UniBO) – Via degli Ariani, 1, 48121, Ravenna, Italy;
d. Dipartimento di Studi Umanistici, Sezione di Scienze Preistoriche e Antropologiche, Università degli Studi di Ferrara (UniFE) – C.so Ercole I d’Este, 32, 44100, Ferrara, Italy.
e. UMR 7041 ArScAn équipe AnTET.MAE, Université Paris Ouest Nanterre La Défense (UPN) – 21, Allée de l’Université, F-92023, Paris, France;
f. Istituto Italiano di Paleontologia Umana – Anagni – Italy.
g. Institutionen för arkeologi och antikens historia, Lunds Universitet, Lund, Sweden.
Abstract:
Grotta dei Santi represents a very suitable investigation field for carrying out an inquiry into the Neandertal behaviour at a high-resolution time scale, in order to obtain data useful for the “functional” reading of the economic and settling strategies. This cave opens into the Monte
Argentario Promontory (southern coast of Tuscany, central Italy), almost at sea-level, at the base of a limestone falaise about 50 m high. During MIS 3, when Neandertals occupied the site, there was a wide plain in front of the cave. Excavations carried out by the University of Siena over the last 11 years brought to light several Mousterian occupation phases represented, most of the times, by thin living floors separated from one another by sterile sediments. However, another “occupant”, the spotted hyena (Crocuta crocuta), left clear traces in the cave in layers other than those occupied by
humans. Although there usually is a clear-cut stratigraphic separation, a partial overlapping between the human and hyena occupations is sometimes documented, owing to their closeness in time. This is the case for the uppermost “living floor” of layer 150, which is the object of our study. A
multidisciplinary integrated analytic methodology was applied, including lithic technology,
taxonomic analysis of faunal remains, taphonomy, use-wear analysis and spatial analysis by means of a GIS platform. This approach allowed us to detect a set of parameters useful for identifying activities due to each of these two predators individually, which provided substantial information about their behaviours.
Key words: Neandertal behaviour; Crocuta crocuta; Taphonomy; Lithic technology; GIS; Activity Areas; MIS 3.
1. Introduction
The increasing attention for problems related to the reconstruction of Neandertals’ behaviour has pushed research more and more towards analytical approaches and archaeological contexts
characterized by high temporal resolution. The discrepancy between anthropogenic and geological times in the formation of archaeological “layers” constitutes the main node of the palimpsest-effect debate since the ’80s (Bailey, 2007 and references therein; Romagnoli et al. 2018). Over the last decade, several studies have been aiming at developing increasingly integrated analytical
procedures to “dissect” the palimpsests into “smaller time-units”, increasing the time-resolution (e.g. Bargalló et al., 2016; Henry, 2012; Leierer et al. 2019; Machado et al., 2013; Machado and Pérez, 2016; Martínez-Moreno et al., 2016; Real et al., 2018; Romagnoli and Vaquero, 2016; Rosell et al., 2012; Spagnolo et al., 2016a, accepted; Thacher et al., 2017; Vaquero, 2008; Vaquero et al., 2012, 2017; Villaverde et al., 2017; Way, 2018). Indeed the availability of contexts whose duration is as akin as possible to the human time-scale rather than the geological one, is a fundamental prerequisite for a realistic reading of some economic and social structures which are behind the evolution of settlement dynamics. Moreover, the high-temporal resolution issue has played a major role in addressing research on Palaeolithic sites where short-lived contexts are present, due to the interaction of various causes (e.g. fortuitousness, site function, sedimentation rates/occupation intensity, “catastrophic” events). From an analytical point of view, these contexts should be considered and treated as “short-term palimpsests” lato sensu. Following the time-perspectivism approach (Bailey, 2007), each sort of anthropogenic context is definitively a palimpsest made by the overlapping of different kind of activities, functions, times, and/or meanings. The time-span-based differentiation between short-lived and long-lived palimpsests is essential in order to correctly address the research, because different cultural phenomena can be identified (or missed) at different time-scales (intended as time-span/resolution). In this light, the concept of “living floor” is not antithetical to that of palimpsest (e.g. a palimpsest-free context), but it should be described as a geometrically-defined sub-set of the short-lived palimpsests, including the very thin (few mm) anthropogenic layers sandwiched between sterile layers. The specific stratigraphic characteristics of living-floors allow us to perform some high temporal resolution analyses, potentially increasing our understanding of the formation processes and relationships among the different sorts of findings. However, also in the short-lived cases the formation processes of the archaeological contexts can dramatically affect the preservation and visibility degree of the archaeological records. Close alternation between humans and other carnivores, for instance, can represent a significant obstacle for the correct interpretation of the records (Bountalis and Kuhn, 2014; Camarós et al., 2013, 2017; Daujeard et al. 2016; Diedrich, 2011; Esteban-Nadal, 2012; Kuhn, 2014). On the other hand, sites with living-floors and/or other sort of short-term palimpsests, where different “bone accumulators”
are present, embody a very suitable frame of reference for developing efficient analytical protocols aimed to disentangle the human and natural components of the Stratigraphic Units (e.g. Conti et al., 2012; Crezzini et al., 2016; Enloe, 2012; Moroni et al., 2019; Rusch et al. 2019; Sanchis et al., 2019). Moreover, in the scientific literature, several scholars have paid attention to the
archaeological meaning of carnivores in action, approaching this issue by means of
actualistic/taphonomic methods, both from an extant and an archaeological standpoint, sometimes also taking into account the spatial variable. Most of these works are focused on the spotted hyena (Crocuta crocuta), as this predator is the main bone-accumulator contending with humans for caves and shelters (e.g. Arribas and Palmqvist, 1998; Binford et al., 1988; Crezzini et al., 2016; Diedrich, 2010, 2011; Fourvel, 2012; Potts et al., 1988; Rusch et al., 2019; Saladié et al., 2017; Sanchis et al., 2019). Other studies involve the ethological and taphonomic analysis of other
bone-accumulators/modifiers, such as the leopard (Ruiter and Berger, 2000; Sauqué and Sanchis, 2017), red fox (Krajcarz and Krajcarz, 2014), bear (Camarós et al., 2013, 2017; Rosell et al., 2019) and badger (e.g. Roper et al., 1991).
Fig. 1. Site location: (a) on the photomap of Italy (source: ESRI World Basemap) and (b) on the Mt. Argentario Promontory (source: Google Earth).
The aim of this paper is to lay groundwork for a wider analytical project focused on the creation of a multifocal taphonomic frame of reference for characterizing material signals derived from the activities of the spotted hyena and humans in Pleistocene contexts. Grotta dei Santi (Monte Argentario, Tuscany, Central Italy) (Fig. 1) is particularly suitable for this purpose as its MIS 3 stratigraphic sequence contains several living floors and other short-term palimpsests, which are usually separated by sterile clay/sandy layers. Different occupation patterns (Crocuta crocuta alone, close alternation between humans and hyena, Neandertals alone) occurred in similar
sedimentological and paleo-environmental conditions, which developed in a relatively brief chronological span (Moroni et al., 2019). This is an ideal context both for carrying out high-resolution studies and for obtaining reliable interpretations of data and reconstructive models. Prospectively, the comparative analysis of results from all the layers of Grotta dei Santi will
significantly contribute to creating a large sample-based taphonomic framework, also usable as a benchmark for other sites having superimpositions between humans and hyenas.
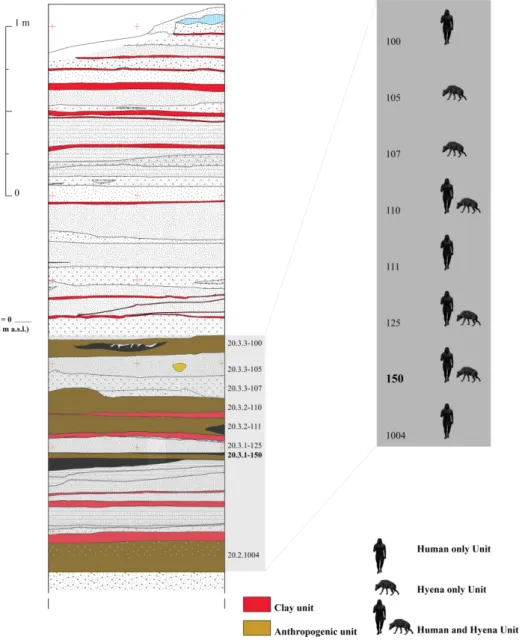
Fig. 2. Stratigraphic sketch of the excavated deposit and correlation between Units and the relative occupation patterns.
The context here analysed is the uppermost living floor of Unit 20.3.1-150 (Fig. 2). Our
multidisciplinary approach includes the taxonomic, anatomical and taphonomic analyses of both macro-faunal and mollusc remains, the technological and use-wear analyses of the lithic finds and the spatial analysis of the aforementioned data. Our results appear particularly encouraging, as the relative “weight” of the components of the spotted hyena and humans can be clearly discriminated. The human occupation was shown to prevail and to come after the Crocuta crocuta. This can allow us to reconstruct some aspects of the functional structure of the Neandertal camp.
2. The context
Grotta dei Santi is a roughly rectangular wide cavity directly facing the sea and opening into the “Calcare Cavernoso” formation on the slopes of the Monte Argentario Promontory. The internal cave deposit (about 3 m thick) is composed of an upper part devoid of any anthropogenic evidence and a lower part (at least 1.5 m thick) containing stratified, usually thin, layers with Neandertal and/or hyena occupations alternating with sterile sediments. While at the rear of the cave the deposit is preserved, its front (towards the entrance) has been completely removed by the sea, thus leaving the profile of the stratigraphic sequence exposed from top to bottom. Fieldwork at Grotta dei Santi, carried out by the University of Siena, was firstly (2007-2014 fieldwork seasons) devoted to remove the reworked sediments due to the Holocene erosive events. Later on, research was dedicated to understanding the chrono-cultural succession of the cave deposit (Moroni et al., 2019) (Fig. 2). Data presented here are intended to give a preliminary overview on the site informative potentialities, taking the portion excavated in 2014 (about 4 m2) of Unit 20.3.1-150 upper living floor (150A), as
an example.
The radiocarbon (on charcoal) and OSL chronological model obtained at the Max Planck Institute for Evolutionary Anthropology of Leipzig places the whole anthropogenic sequence of Grotta dei Santi in the time span between 50 and 40 ka BP (detailed information about the cave infill
formation processes and chronology can be found in Moroni et al., 2019). Typical marks of the Units exclusively occupied by carnivores are large quantities of both entire and trampled coprolites (which often create actual thin levels), combined with scant fragments of bones of prey (with
chewing or digestion traces) and very rare bones of predators (including Crocuta Crocuta, Panthera pardus and Vulpes vulpes) (Moroni et al., 2019).
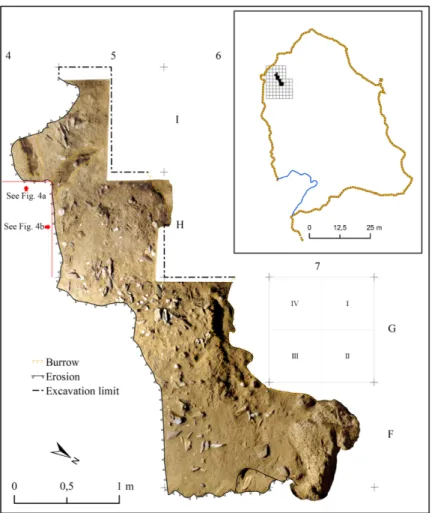
Fig. 3. Accurate photomap of the investigated surface of the living floor 150A and location of the excavation grid into the cave.
The top of Unit 20.3.1-150 (hereafter 150) was brought to light during the field season 2014, over a surface of 4 m2 (Fig. 3). This Unit is formed by at least three living floors (few mm thick) separated
by levels of sterile sand (Fig. 4). The excavation was carried out adopting a 1x1 m regular grid, sub-divided into 0.5x0.5 m sectors (Fig. 3). The uppermost human occupation (150A) contains a fireplace and several clusters of remains of anthropogenic origin. Along its E-NE side this living floor was truncated by the Holocene erosion. In addition, relevant bioturbations, including a wide burrow/channel, partly altered other sectors of the excavated area. The rest of the exposed living floor was found to be in an exceptional state of preservation (Fig. 3).
Fig. 4. Photographic detail of Unit 150 along the cross-sections H/I-4 (a) and 4/5-H (b). See Fig. 3 for the relative position of the sections.
3. Materials and methods
The study of 150A was carried out with a multidisciplinary integrated analytical protocol, including the zooarchaeological (taxonomy and taphonomy), lithic (technology and traceology),
malacological (taxonomy and taphonomy) and spatial analyses (taphonomy and reconstruction of the activity areas).
3.1. Zooarchaeological analysis
Taxonomic and skeletal identification of macromammals was based on the reference collections from the Research Unit of Anthropology and Prehistory of the University of Siena. Species abundance was quantified using the Number of Identified Specimens (NISP; Grayson, 1984) and the Minimal Number of Individuals (MNI; Chaplin, 1971). All specimens were divided into dimensional (1-3 cm, 3-6 cm, 6-10 cm, >10 cm) and anatomical categories (i.e. “skull”, “jaw”, “teeth”, “vertebrae”, “ribs”, or more generically “epiphysis”, “diaphysis”, “spongy bones”). Fragments of cancellous bone and bone fragments which could not be assigned to a specific category were gathered into the class: “others”. This procedure allowed us to assess the degree of fragmentation of bones. Specimens showing fresh fractures produced during their recovery were excluded from this count. The fact that the bones were well preserved permitted a detailed analysis of bone surface modifications. Fresh or dry status of diaphyses at the moment of breakage was estimated using the Fracture Fresh Index (FFI; Outram, 2002).
3.2. Lithic analysis
3.2.1. Technology
The lithic sample of living floor 150A consists of 116 items in a good state of preservation and with fresh edges. In order to gain a complete picture of the production procedure the technological study was carried out (Boëda, 1994; Geneste, 1991; Inizan et al., 1999), registering all the pieces’
morpho-technical characters in an Access® database (Marciani, 2018). The traits collected for each piece include the lithotype (chert, jasper, siliceous limestone, quartz) the granulometry (fine or coarse grained), and geological nature (pebble, slab, block). For the metrical quantification we considered 5 dimensional classes (DC) evaluated on the area covered by each piece on a millimeter graph paper (Marciani et al., 2016; Spagnolo, et al., 2016a) (DC 1: 1-50 mm2, DC 2: 50-100 mm2,
DC 3: 100-150 mm2, DC 4: 150-200 mm2, DC 5: >200 mm2). Items larger than the second DC were
also measured (length, width, thickness) according to their technological axes. When the orientation was not possible, the longest measure was conventionally regarded as the length. The definition of flakes, long flakes or blades is based on the ratio length/width (ratio between 0 and 1.5 = flake; ratio between 1.5 and 2 = long flake; more than 2 = blade), according to Laplace (1968). Then we
considered the integrity degree of the item and the location of fractures in the case of broken pieces. The retouched tools were described according to Laplace (1964).
A preliminary evaluation of the presence and location of macro-traces was made by naked eye and with a magnifying glass (based on the recurrence, order and regularity of the scars, see next
All the artifacts were sorted according to the following technological classes: pebbles, hammer-stones, flakes, cores, micro-flakes (intact flakes of the 1-2 DC), debris (fragmented or altered items of the 1-2-3 DC), undetermined (fragmented or altered items larger than the 4 DC whose orientation is not possible). Flakes were analyzed considering their role in the reduction sequence; thus their technological category are: completely-cortical flakes (100% cortical); semi-cortical flakes (between 100-75% of cortex coverage); management flakes (flakes produced when regulating the lateral and distal convexities and angles of the core with less than 75% of cortex; and flakes aimed at managing the striking platform); target flakes (the predetermined objectives of the debitage). In this case we considered as objectives of debitage: long baked target flakes (a blank with at least one cutting edge opposed to a back, cortical or created by flaking (Bordes, 1961); convergent target flakes; long target flakes. A peculiar technological category is the pseudo-Levallois point, this type of flake can be a target object of a reduction sequence (e.g. discoid production), or a management flake in another context (e.g. centripetal Levallois). The function of this type of flake can be ascertained only on the basis of the context in which it is found, and in this case, we cannot ascertain its role.
For each flake we recorded extension (0; 0-25%; 25-50%; 50-75%; 75-100%; 100%) and position of cortex (lateral, backed side, proximal, distal, mesial) morphology, symmetry – according to the technological axis – section shape, presence of flaking accidents. A diacritical analysis was
performed in order to identify the direction and chronological order of the scars and their role in the debitage process (Dauvois, 1976; Inizan et al., 1999). Percussion attributes including type of butt, position of the impact point, and type of bulb were taken into consideration. According to these technical and morpho-metrical features the volumetric concept of debitage has been identified for each flake: Levallois (unipolar or centripetal); additional debitage (i.e. volumetric unidirectional production without management of convexities. e.g. Boëda, 1997, 2013; Guilbaud and Carpentier, 1995).
For each core we considered: the type and morphology of the raw block; its volumetric conception of exploitation (Boëda, 2013); the hierarchy of surfaces; the striking platform type (partial,
peripheral), position (unipolar, bipolar, orthogonal) and mode of organization (one or several detachment, with or without abrasion of the overhang, without any preparation); the diacritical analysis of scars (including number, direction chronology and role of each scar) (Dauvois, 1976; Inizan et al., 1999) and the reasons why the core was abandoned (cf. Marciani, 2013, 2018). Moreover, to integrate the spatial and technological studies some lithic traits (significant to infer insights on spatial taphonomy of the context and human behavior) were selected, including both the Dimensional Classes and the lithic technology. As far as the lithic technology is concerned, the sample was sorted in macro-categories, including: production waste (all the completely-cortical,
semi-cortical, management flakes, flakes aimed at managing the striking platform, undetermined, micro-flakes and debris), target flakes (without macro-traces on the edges), tools (all the retouched items and the flakes with micro-traces on the edges), cores and hammer-stones/pebbles. The sub-set of the production waste included into the smallest Dimensional Class (all the items < 50 mm2) was
taken into account as micro-debris. These categories were conceptualized following the criteria described in Spagnolo et al. (2016a, 2019).
3.2.2 Traceology
A preliminary test to evaluate the feasibility of use-wear analysis was carried out on a sample of 11 lithic tools randomly selected from the technological categories of semi-cortical, completely cortical flakes and target objects, plus the pseudo Levallois point. The cortical items were chosen in order to test the functional potential of the cortical portion of the flakes. The target objects were selected because of their role of objectives of the debitage. The pseudo Levallois point was added to the sample because of the presence of clear macro-traces.
Use-wear analysis was carried out by means of both low-power approach (LPA) (Tringham et al., 1974; Odell, 1980) and high-power approach (HPA) (Keeley, 1980; Van Gijn, 1990). In both cases observations were made by the 3D digital Hirox KH 7700 microscope: for LPA analysis (20x-80x magnifications) this device was equipped with a MX-G 5040Z body and an AD-5040Lows lens, for HPA examinations (140x-560x magnifications) with an MXG-10C body and OL 140 II lens
(Arrighi and Borgia 2009; Sano et al. 2019; Wierer et al., 2018). Traces on the archaeological lithic tools were interpreted by means of comparison with the experimental reference collection of the Research Unit “Prehistory and Anthropology” of the University of Siena.
3.3. Malacological analysis
For the taxonomic analysis of the malacofaunal sample we used the updated nomenclature from two online datasets: the S.I.M. - Società Italiana di Malacologia (www.societaitalianadimalacologia.it) and the WoRMS - World Register of Marine Species (www.marinespecies.org). The quantification indexes adopted include the Number of remains (Nr), the Number of Identified Specimens (NISP), the Minimum Number of Individuals (MNI) for the gastropods and the Minimum Number of Valves (MNV) for the bivalves. MNV is aimed to better represent each valve (that is a unitary datum), highlighting the laterality of each remain. MNI and MNV have been calculated by means of landmarks, following Gutiérrez-Zugasti (2011). The correlation of the identified species with
specific habitats was made following Santhanam (2018a, b).
The taphonomic analysis was performed on the NISP following Claassen (1998), taking into account the pre-depositional alterations (e.g. marine abrasion, predation by other molluscs and
bioerosion), the intentional/unintentional anthropogenic alterations (e.g. thermic alteration, transformation of the edges and use as tools) and the post-depositional transformations (e.g. fragmentation, abrasions, root marks, carbonate/sediment crusts, decalcification).
3.4. Spatial analysis
The archaeological visibility of a context (sensu Spagnolo et al., 2019) expresses its actual overall potential (then also the relative error margin) to be correctly referred to the behavioural, social and economic structures that produced it. This concept of archaeological visibility is a sort of “algebraic sum”, including the Otherness of the Past, the correspondence between systemic and archaeological contexts (sensu Schiffer, 1972), the residuality of the archaeological context, the magnitude of the palimpsest effect, the intensity of the archaeological signal and the ambiguity of the archaeological record (Spagnolo et al., 2019 and reference therein). The intrinsic ambiguity of the archaeological data, in particular, severely hinders a clear and correct reading of a context, in particular if based on a limited dataset analysis. This implies that the taphonomic evaluation of an archaeological context (representing the crucial/preliminary point of the research) must be carried out taking into account as many parameters as possible.
The approach applied is the same successfully tested for the study of several Mousterian contexts in central and southern Italy (Spagnolo, 2017).
A preliminary taphonomic step was performed in order to evaluate the preservation state of the context. The parameters adopted include the “freshness” of the findings (faunal remains, lithics and shells), the size-sorting analysis of lithics and faunal remains (Bertran et al., 2012; García-Moreno et al., 2016; Lenoble et al., 2008; Rasic, 2004; Schick, 1986, 1987; Spagnolo et al., 2016a;
Stevenson, 1985, 1991) and the orientation analysis of elongated faunal remains (Benito-Calvo and de la Torre, 2011; Bertran et al., 2015; Boschian and Saccà, 2010; Cobo-Sánchez et al., 2014; Domínguez-Rodrigo et al., 2012, 2014; Domínguez-Rodrigo and Pérez, 2013; García-Moreno et al., 2016; Giusti et al., 2018; Lenoble and Bertran, 2004; Lenoble et al., 2008; Sánchez-Romero et al., 2016). The size-sorting analysis and the orientation analysis have been both related to the high-resolution Digital Elevation Model (DEM) and the Slope Model (SM) of living floor 150A. A two-step size-sorting analysis was achieved, taking into account both the quantitative and spatial distribution of findings. On the one hand, the distribution of lithics by dimensional classes was compared to a theoretical model based on the experimental data-set of Bertran et al. (2012). On the other hand, the spatial behaviour of findings (both lithics and faunal remains) was evaluated in order to recognize possible size-related linear gradients or differences of spatial pattern. As far as the theoretical model used for the quantitative analysis is concerned, an asymptotic-like curve is expected to describe a typical un-disturbed knapping assemblage, with the largest proportion of
items included in the finest size fraction (Bertran et al. 2012 and reference therein). As shown in Table 1, the dimensional classed of lithic finds used in this work are roughly comparable to the mesh-sizes of Bertran et al. (2012), making possible a quantitative comparison. Briefly, the expected values of particle size distribution should range around the 64% in the DC1 (1-50 mm2),
the 26% in the DC2-3 (50-150 mm2) and the 10% in the DC4-5 (> 150 mm2).
Lithic Dimensional Classes (Bertran et al. 2012) Lithic Dimensional Classes
in this work (mm2)
Sieve mesh d (mm) Piece width w (mm)
Expected values (based on mean values in
Bertran et al. 2012) DC 1 1-50 2-4 2.8-5.7 64.3% DC 2 50-100 4-5 5.7-7 10.7% DC 3 100-150 5-10 7-14 15.2% 10-20 14-28 5.7% 20-31.5 28-44 2.5% 31.5-50 44-71 1.2% DC 4 DC 5 150-200 > 200 >50 >71 0.4%
Table 1: Comparison between Dimensional Classes adopted in this work and the ones used by Bertran et al., 2012 with related mean % values expected by experimental collection reference. The faunal remains sampled for the fabric analysis include all the pieces > 2 cm in length and with Elongation Index ≥ 1.7 (Benito-Calvo and de la Torre, 2011; Boschian and Saccà, 2010;
Domínguez-Rodrigo et al., 2014; Domínguez-Rodrigo and García-Pérez, 2013; García-Moreno et al., 2016; Giusti et al., 2018). The two-dimensional vector drawing of faunal remains was made at scale 1:1 by means of the accurate photomap (Fig. 3) and eventually integrated with the 1:5 field-maps. The vector map was used to calculate the orientations of bones directly in the GIS platform (ArcGIS® 10.6.1), by means of the MBRA (Minimum Bounding Rectangle Axis). This automatic procedure, functioning in the similar way as the SLA (Symmetrical Longitudinal Axis), is an excellent indicator of the actual directionality in particular of longitudinal flat bones (Domínguez-Rodrigo and García-Pérez, 2013), such as fragmented diaphyses, which represent a large part of the faunal sample (4.1). The circular statistics (Rayleigh’s, Watson’s and Kuiper’s Tests – carried out both with the von Mises and the uniform Distributions – and Rose diagrams) were performed with Oriana 4.0. More specifically, the Rayleigh’s Test was aimed to identify a possible uniform-linear pattern, whilst the Watson’s and Kuiper’s Tests are more suitable to recognize non-uniform or bimodal/multi-modal patterns. The isotropy hypothesis cannot be rejected with p > 0.05 (Benito-Calvo and de la Torre, 2011; Cobo-Sánchez et al., 2014; Domínguez-Rodrigo et al., 2012, 2014; Domínguez-Rodrigo and García-Pérez, 2013; García-Moreno et al., 2016; Giusti et al., 2018;
Lenoble and Bertran, 2004). The evaluation of the spatial behaviour of taphonomic parameters was based both on statistical (e.g. Ripley function) and visual (Kernel Density maps and plotting maps) methods. More specifically, the statistical approach to the point pattern analysis was performed with the L(d) transformation of the K-Ripley function, setting the confidence envelopes on 99
permutation with the Monte Carlo simulations and using the polygon of the excavated area as study area (given that the study-area changes sensitivity of this method). Moreover, the edges/boundary-effect (produced by interrelation between point patterns and morphologies/dimension of the study area) can bias the accuracy of results. This effect is typically shown by consistent
deviated-behaviours of the expected values on the confidence envelopes. In order to avoid or limit the effect of this deviation on final results, a Boundary Correction Method was applied with the parameter “simulate outer boundary values” (e.g. Baddeley et al., 2015; Crema and Bianchi, 2013; Carrer, 2017; Conolly and Lake, 2006; Domínguez-Rodrigo et al., 2018; Giusti and Arzarello, 2016; Marín et al., 2019; Negre et al., 2019; Ripley, 1976, 1977; Romagnoli and Vaquero, 2016; Spagnolo et al., 2016, 2019, accepted; Thacher et al., 2017).
In agreement with the sample size, the behaviourally significant data for the spatial patterns include lithic micro-debris (DC = 1-50 mm2), lithic tools (both retouched tools and items with micro-traces
compatible with use), cores, hammer-stones/pebbles, unburnt smaller faunal remains (1-3 cm), unburnt larger faunal remains (> 10 cm), burnt faunal remains, faunal remains with cut-marks and/or notches, cones and marine malacofauna. The set of spatial-functional analyses performed includes: L(d) transformation of the K-Ripley function, Kernel Density (e.g. Blasco et al., 2016; Moroni et al., in press; Oron and Goren-Inbar, 2014; Spagnolo et al., 2016a, 2019, accepted; Thacher et al., 2017), visual maps of the less numerous although significant categories and Ward’s Cluster Analysis (e.g. Frahm and Tryon, 2018; Pardo et al., 2016; Shennan, 1997; Spagnolo et al., 2019, accepted; Whallon, 1984).
4. Results
4.1. Zooarchaeology
The zooarchaeological and taphonomic study of the macrofaunal assemblage was carried out on 71 identified specimens and 1,019 unidentifiable fragments (Tables 2-3).
Species NISP % Cervus elaphus 35 49.4 Dama dama 4 5.6 Capreoulus capreolus 1 1.4 Cervidae indt. 5 7 Bos primigenius 13 18.3
Bos/Bison 7 9.9
Equus ferus 5 7
Stephanorhinus sp. 1 1.4
Total 71
Table 2: Number of the Identified Specimens and percentages of the macromammal assemblage.
Element NR (without others)%
Horn/Antler 2 0.7 Skull 16 7.4 Mandible 2 1 Teeth 7 3.3 Scapula 3 1.4 Ribs 26 12 Vertebrae 6 2.9 Coxal 2 1 Phalanges 1 0.7 Diaphysis 100 46.4 Epiphysis 6 2.9 Cones 21 9.7 Spongy bones 23 10.6 Others 805 TOT 1,019
Table 3: Number and percentages of the unidentified remains.
Cervids (56.4%) are the most common ungulates followed by bovids (18.3%) which are exclusively represented by the aurochs. Among cervids, the dominant species is the red deer (49.4% of NISP), whilst the fallow deer and the roe deer show much lower percentages (5.6% and 1.4% respectively). The horse is represented by few remains (7%). A jugal tooth of Stephanorhinus sp. was identified (Pandolfi et al., 2017).
The MNI is equal to 9. Out of these, 3 are red deer (a juvenile, a prime adult and an old adult) and 2 are aurochs (both old adults). The other taxa are represented by one individual per taxon.
Fig. 5. Skeletal frequencies of the macromammal assemblage.
The macro-faunal association of living floor 150A suggests the existence, in the emerged plain at the foot of Monte Argentario (Moroni et al., 2019), of a composite landscape formed both by wooded environments (proved by the abundance of cervid taxa) and open areas (attested by the presence of the bovids, the rhino and the horse).
The identified sample is exclusively composed of elements of the pelvic and scapular girdles and of cranial and limb bones (Fig. 5). Specimens mostly consist of isolated teeth (26.8%) and diaphysis fragments (42.2%), among which tibiae and metapodials (mainly belonging to cervids) are the most represented (Table 3). Due to the unique morphology of their shafts, these bones are more
identifiable than diaphysis portions of other long bones. For this reason, tibiae and metapodials have probably been overestimated. No carpal bone has been identified and phalanges and tarsal bones are scarce (1.4% and 9.8% respectively).
Anthropogenic marks were detected on 35.2% of the identified remains (21% percussion marks and 14.2% cut marks). Only a single gnawing mark by carnivores (on a first phalanx of Cervus elaphus) was recorded.
The observation of Freshness Fracture Index (FFI) carried out on 25 identified specimens shows values mainly comprised between 0 and 2, thus indicating that fractures were performed when bones were still fresh.
Fig. 6. Fragmentation of unidentified sample.
The unidentified remains appear to be highly fragmented: 83.7% falls in the class 1-3 cm (Fig. 6). In this sample diaphysis fragments are the most abundant (46.4%), followed by ribs (12%), spongy bones (10.6%), and skull fragments (7.4%) (Table 3). Anthropogenic marks are present on 2.2% of the unidentified specimens, while gnawing traces by carnivores are completely absent. Burnt bones are very scant (3.1% of the unidentified sample).
4.2. Lithics 4.2.1. Technology
The lithic sample of living floor 150A consists of 116 items in a good state of preservation, with fresh edges and well-preserved macro and micro traces.
The raw material consists mainly of red and dark radiolarite (41.4%), found both in the form of pebbles and blocks with traces of rolling as well as smooth, fine grey, and dark green small chert pebbles (28.4%). A component consisting of siliceous limestone (22.4%) and few limestone and (1.7%) quartz (0.9%) artifacts are also present (Table 4). Specific studies on the supply of raw materials have not yet been tackled, but they are in agenda and partially ongoing (Scaramucci, 2018). The metamorphic component (e.g. quartz) of the industry can be probably linked to the Verrucano formation of the Monte Argentario promontory (Segre, 1959). The rounded siliceous pebbles, instead, are from fluvial (e.g. the Albegna river) and nearby beach deposits. This is a factor which argues in favour of a local supply of most of the raw material, possibly coming both from the formations cropping out close to the cave, and from now submerged alluvial deposits (Moroni et al., 2019). DC 1 DC 2 DC 3 DC 4 DC 5 (1-50 mm2) (50-100 mm2) (100-150 mm2) (150-200 mm2) (> 200 mm2) Total Raw Material n. % n. % n. % n. % n. % n. % Radiolarite 10 62.5 7 35.0 6 50.0 3 37.5 22 44.0 48 41.4
Chert 5 31.3 4 20.0 3 25.0 3 37.5 18 36.0 33 28.4 Siliceous limestone 8 50.0 8 40.0 3 25.0 1 12.5 6 12.0 26 22.4 Limestone 2 12.5 0 0.0 0 0.0 0 0.0 0 0.0 2 1.7 Quartz 0 0.0 0 0.0 0 0.0 0 0.0 1 2.0 1 0.9 Indeterminable 1 6.3 1 5.0 0 0.0 1 12.5 3 6.0 6 5.2 Total 16 20 12 8 50 116 % 13.8 17.2 10.3 6.9 43.1
Table 4: Raw material and Dimensional classes of lithic implements.
Technological classes n. % Pebbles 2 1.7 Hammer-stones 4 3.4 Flakes 48 41.4 Micro-Flakes 24 20.7 Cores 5 4.3 Debris 22 19.0 Undetermined 11 9.5 % 116
Table. 5: Technological classes.
Half of the lithics (43.1%) (Table 4), are included in the larger dimensional class (DC 5: > 200 mm2). The technological study is focused on the most discriminant items, namely 5 cores and 48
flakes which document different reduction sequences (Table 5). That is to say: we note the presence of several fragments from various reduction sequences, mainly pertaining to the Levallois concept (22 items) and volumetric unipolar debitage (5 items) (Table 6). Given the paucity of the sample it was not always possible to ascertain the debitage concept as flakes obtained by different reduction sequences may show similar or even identical technical characteristics (Table 6). Nevertheless, we note a phase of pebble opening attested by the presence of completely cortical and semi-cortical flakes. Half of the flakes show a cortical coverage; in particular there are some which have their cortex in the lateral position. Many flakes have cortical parts on the dorsal face as the starting pebbles are quite small: after the first phase of cortex removal and the first extraction of flakes the core was already destructured and depleted. There are rarely more than three negatives on the dorsal face of flakes. The directions of the removals are mostly unipolar and convergent (unipolar 23, convergent 9, orthogonal 5, centripetal 2). The butts are mostly faceted (11), flat (8) and dihedral (6), with a central point of impact (20) and bulbs are prominent or slightly prominent, attesting a direct percussion technique.
Levallois unidirectionalVolumetric Indeterminated Total Technological Category\
Concept of debitage
Core 2 3 5 9.4
Completely-Cortical Flakes 2 2 3.8
Semi-cortical flakes 6 6 11.3
Management flakes 7 2 17 26 49.1
Pseudo-Levallois points 1 1 1.9
Target long backed flakes 6 6 11.3
Target convergent flakes 2 2 3.8
Target long flakes 5 5 9.4
Total 22 5 26 53
% 41.5 9.4 49.1
Table 6: Technological categories and concept of debitage (considering flakes and cores). Total Technological Category\ Amount of cortex 0 0 to 25 % 25 to 50% 50 to 75% 75 to 100% 100% n % Completely-Cortical Flakes 2 2 4.2 Semi-cortical flakes 6 6 12.5 Management flakes 13 6 2 5 26 54.2 Pseudo-Levallois points 1 1 2.1
Target long backed flakes 2 4 6 12.5
Target convergent flakes 2 2 4.2
Target long flakes 1 1 3 5 10.4
Total 19 11 5 5 6 2 48
% 39.6 22.9 10.4 10.4 12.5 4.2
Fig. 7. Technological categories of flakes: A: Completely-Cortical Flakes; B, C, E, F: Semi-cortical flakes; G, H, I: Management flakes; L: Pseudo-Levallois point, D, Q: Target long backed flakes; O, P: Target convergent flakes; M, N: Target long flakes. P: Retouched point, Q: side scraper (P, Q: Drawings modified from Moroni et al., 2018).
Some blanks were selected to be retouched, namely: 5 target items, 3 management flakes and 1 semi-cortical flake). We note that retouched flakes are larger (between 4.5 and 3.3 cm) than the majority of the other items of the collection (smaller than 3 cm) (i.e. Fig. 7q). Moreover, one of them, a retouched point, was produced by a fully Levallois production with several negatives on the dorsal face indicating a phase of plain debitage, and an elaborate preparation that implies the exploitation of larger cores (i.e. Fig. 7p). This evidence led us to hypothesise the arrival at the site of such tools as already finished objects.
There are only five cores and we identified two reduction concepts: Levallois and unidirectional volumetric debitage. The unidirectional additional debitage is characterized by an opening of the striking platform with an orthogonal strike followed by a series of mostly unipolar scars. It is the case of core C (Fig. 8) both the thinner and larger side of the pebble was used as debitage surface. These cores show different hinged accidents that could have caused the core abandonment.
The Levallois recurrent unipolar and convergent cores show striking platforms prepared with small detachments followed by few removals aiming at removing the cortex and producing the objectives of debitage. Constraints due to the small size of the starting blocks do not allow the structuring of the lateral and distal convexity typical of Levallois (Fig. 8a-b), but actually in this case, the selection of pebbles with a lenticular shape and natural convexities suitable to this method seems to replace the initialization phase (Marciani, 2018). Beside the paucity of the core sample, only for 5 items, we note a selection of a different initial shape of the block according to each debitage concept: for the unidirectional additional cores angular volumes were selected, while for the Levallois lenticular flattened pebbles were preferred.
Fig. 8. Diacritical analysis of cores. A, B: Levallois core; C: unidirectional core (Drawings modified from Moroni et al., 2018).
Furthermore, we note two types of hammerstones, one of a larger size and three of a smaller size. These three have an ellipsoidal shape and very similar dimensions (respectively length, width and
thickness expressed in mm: 49-31-9; 45-25-8; 48-34-8). These common technical characteristics allow us to hypothesise the selection of these elements for a possible retouching action, performed both with the wide and with the narrow surface of the pebble.
4.2.2. Traceology
The lithic sample usually boasts very well-preserved edges and surfaces, only few items (4) are affected by mechanical and chemical alterations related to post-depositional processes. Diagnostic traces were detected on 4 artefacts (a levallois point and 3 target long flakes). The pseudo-levallois point displays well developed use-wear associable to butchering activity (Fig. 9). This item was used in mixed motion of cutting combined with scraping, involving fleshy and hard tissue. The active portion of this artefact is formed by the two lateral edges (one is convex and the other
rectilinear). Use-wear involves only half of the edges in their distal part. Use-wear Post-dep.
alterations Unused Uncertain Total analysed
Target convergent flake 1 1
Pseudo-levallois point 1 1
Target long flakes 3 2 3 1 9
Total analysed 4 2 4 1 11
Table 8: Total amount of pieces examined for use-wear analysis
The target long flakes exhibit less developed traces, consisting in edge rounding, micro-scarring and weakly polishing. All these items could be used for cutting soft material, probably fleshy tissue (Table 8). The active portions of these flakes are in lateral position and occupy ¾ of the tool totality. They have rectilinear (2) or convex (1) delineations.
Fig. 9. Pseudo-levallois flake (1) showing macro and micro use-wears (dotted line) due to processing fleshy and hard tissues through mixed actions; in detail, rough polish. Target long flake (2) showing macro use-wear (dotted line); in detail edge damage interpreted as the result of cutting soft material.
4.3. Malacological sample 4.3.1. Taxonomy
The malacological assemblage includes 279 remains (19 unidentifiable and 260 identified), belonging to 7 taxa (Table 9). Among the gastropods only 3 fragments of Patella sp. and a whole specimen of Naticarius hebraeus have been identified. The most representative bivalve species are Callista chione (NISP = 190; MNVtot = 19) and Mytilus galloprovincialis (NISP = 60; NMVtot = 6). Acanthocardia sp. and Pecten jacobaeus are represented by 4 fragments without significant landmarks for the MNV.
The infralittoral zone with sandy/muddy seabed constitutes the typical habitat for the majority of the species found in 150A. However, the occurrence of limpets and mussels testifies to the additional presence of cliff environments.
Nr NISP MNI MNVright MNVleft Habitat Substrate
Gastropoda
Patella sp. 3 3 - - - Supra/Mediolittoral Hard
Naticarius hebraeus 1 1 1 - - Infralittoral Soft
Unident. Gastropoda 2 2 - - - -
-Bivalvia
Mytilus galloprovincialis 60 60 - 5 1 Medio/Infralittoral Hard
Pecten jacobaeus 1 1 - - - Infralittoral Soft
Acanthocardia sp. 3 3 - - - Infralittoral Soft
Callista chione 190 190 - 11 8 Infralittoral Soft
Unidentified taxa 19 - - -
-Total 279 260 1 16 9
Table 9: Mollusc species found in living floor 150A.
4.3.2. Taphonomy
The main taphonomic processes that affected the malacological set include decalcification (25.3%) and post-depositional fragmentation (26.8%). The presence of white surfaces with exfoliations (recorded on 77.7% of the specimens) can be connected to the loss of minerals from the tissue. This process entails an increment of shell fragility and can explain the high frequency of
post-depositional fractures. Excluding the fragments with carbonate coating, 39.2% of the specimens display bio-erosional traces (both on the ventral and dorsal side of the shell). A single item shows evidence of predation. Dot-like thermal alterations are recorded on 7.7% of the sample (including M. galloprovincialis and C. chione specimens only) (Fig. 10). Traces of charcoal are present on 8.5% of the specimens and are recorded both on the dorsal and ventral side of the shell and on the fractured edges (Table 10).
Fig. 10. Photo of a refitted specimen of Callista chione with dot-like thermal alterations. Interestingly, an altered patch is present at the boundary between two refitted fragments but it
affects only the proximal one. This evidence suggests that the exposition of the valve proximal fragment to thermal agents took place after the shell breakage.
BioEr
NISP Nabr Int Ext Both Apred Decal PdepD EscD Roots Sed CaCO3 TAlt Charcoal
Patella sp. 3 - - - 2 - - 2 - - - -Naticarius hebraeus 1 - - - 1 1 1 - 1 - - -Unident. Gastropoda 2 - - - 2 - - - -Mytilus galloprovincialis 60 - 4 - - - 21 52 12 - 21 24 7 5 Pecten jacobeus 1 - - - 1 - 1 1 - - - -Acanthocardia sp. 3 - - 2 1 - 3 3 1 - 2 2 - -Callista chione 190 1 24 19 49 1 174 155 35 3 50 86 13 17 Total 260 1 28 21 53 1 202 214 49 3 74 112 20 22 Total taph. (%) 0.1 3.5 2.6 6.6 0.1 25.3 26.8 6.1 0.4 9.3 14.0 2.5 2.8 Total NISP (%) 0.4 10.8 8.1 20.4 0.4 77.7 82.3 18.8 1.2 28.5 43.1 7.7 8.5
Table 10: List of taphonomic processes by identified marine taxa. Abbreviations: Nabr – natural abrasion; BioEr – bio-erosion; Int – ventral side; Ext – dorsal side; Both – Both side; Apred – animal predation; Decal – decalcification; PdepD – post-depositional damage; EscD – escavation damage; Roots – roots damage; CaCO3 – calcium carbonate crust; TAlt – Termo-alteration damage; Charcoal – charcoal crust; Total taph. – total taphonomic processes; Total NISP – total Number of Identified Specimens. Note: some specimens could have been exposed to more than one type of taphonomic alterations.
4.4. Spatial evidence
4.4.1. Spatial taphonomy
Different preservation degrees characterize the different areas of living floor 150A. A significant part of the original deposit was destroyed by the Holocene marine erosion, including its E-NE edge. Possible bioturbations have been identified in squares I4-I5 (where two 10 cm wide channels are present) and partly in squares G6-G7 (where a wider channel is documented). Therefore these sectors have been excluded from our study (Fig. 3).
The horizontality of the living-floor shown by DEM and SM (Fig. S1) constitutes a likely
conservative factor for the spatial patterns in relation to gravitational and/or tractive disturbances. Nevertheless, the low extent of the excavated area limits a wide-range reading of the evidence. The presence of thermally altered sediments in square H5 is what remains of a fireplace, whose ash and/or charcoals are not preserved.
The quantitative-based distribution pattern of the lithic sample is characterized by a higher proportion of larger items, with a clear underrepresentation of the smallest dimensional class, if
compared with the theoretical values of Table 1 (Table 4). Regarding the spatial-based size-sorting analysis the L(d) Ripley’s function highlights size-dependent variations in the spatial patterns (in terms of increment/decrement of the clustering rate) of the faunal remains and lithic finds. In the set of faunal remains, some clear clustered patterns are recognizable among the smaller fragments (1-3 and 3-6 cm) and a moderate clustering rate is visible among the larger fragments (> 10 cm),
highlighting a general trend to clustering decrease increasing the Dimensional Class. Conversely, in the lithic set a trend towards an increase in clustering can be detected from the smaller to the larger dimensional classes. The highest clustering rates tend to range around 0.5 m radius (Fig. S2). The evidence from the density and visual maps of the dimensional classes seems not consistent with linear size-sorted assemblages (Fig. 11a-e).
Fig. 11. Density maps and visual maps of faunal remains sorted by dimensional classes (a: DC1; b: DC 2; c: DC 3; d: DC 4), lithics sorted by dimensional classes (e) and lithic finds sorted by micro-debris, cores and pebbles/hammer-stones (f).
Fig. 12. Visual representation of the orientation analysis results, by squares (a) and by Elongation Index (b).
A two-way orientation analysis was performed, setting the sample on the basis of two criteria: the first one groups the faunal remains in relation to their Elongation Index (case A = 1.7 ≤ EI < 2.5; case B = 2.5 < EI < 3.5; case C = EI > 3.5), the second one to their spatial localization (case E = Squares F7-F6; case F = Squares G6-G5; case G = Square H5-I5). The rose diagrams related to the EI criterion suggest different pattens among the case A and the cases B and C respectively. A bimodal cross-patterned orientation seems to characterize the bones with Elongation Index ≤ 2.5, with a main NW-SE orientation and a secondary one perpendicular (Fig. 12b). The cases B and C seem to be characterized by a SW-NE and a SSW-NNE uniform-linear patterns respectively (Fig. 12b). As far as the spatial criterion is concerned, a strongly linear iso-oriented pattern is evident only in square H5, while other zones return more isotropic-like patterns (with weak suggestions of cross-patterned orientations) (Fig. 12a). The statistical analysis partially confirms this visual observation. Statistically significant anisotropic patterns are highlighted by the Rayleigh’s, Watson’s (with the uniform distribution) and Kuiper’s (with the uniform distribution) tests both in
Commented [11]: 1.5 column; Colour online only
square H5 (case G) and among the most elongated faunal remains (case C). Moreover, the bimodal cross-patterned orientation detected by rose diagrams among the faunal remains with EI < 2.5 (case A) seems to be highlighted by the Watson U² Test (carried out with the von Mises distribution). The isotropy hypothesis cannot be rejected among the bones with 2.5 < EI < 3.5 (case B), in F7-F6 (case E) and G6-G5 (case F) (Fig. 12; Tables 11-12).
1.7 < EI < 2.5 2.5 < EI < 3.5 EI > 3.5
Data Type Axial Axial Axial
Number of Observations 42 50 41
Mean Vector (µ) 164.065° 50.574° 43.773°
Length of Mean Vector (r) 0.214 0.21 0.423
Median 162.5° 47° 39°
Concentration 0.437 0.43 0.934
Circular Variance 0.393 0.395 0.288
Circular Standard Deviation 50.343° 50.594° 37.559°
Standard Error of Mean 14.469° 13.473° 7.114°
95% Confidence Interval (-/+) for µ 135.699° 24.162° 29.826°
192.43° 76.986° 57.72°
99% Confidence Interval (-/+) for µ 126.789° 15.866° 25.445°
201.341° 85.282° 62.101°
One Sample Tests
Rayleigh’s Test (Z) 1.915 2.21 7.35
Rayleigh’s Test (p) 0.148 0.11 0.000492
Watson’s U² Test (Uniform, U²) 0.174 0.158 0.406 Watson’s U² Test (p) 0.1 > p > 0.05 0.1 > p > 0.05 < 0.005
Kuiper’s Test (Uniform, V) 1.647 1.742 2.412
Kuiper’s Test (p) 0.10 > p > 0.05 0.10 > p > 0.05 < 0.01
Watson’s U² Test (von Mises, U²) 0.078 0.043 0.046 Watson’s U² Test (p) < 0.025 0.25 > p > 0.15 0.5 > p > 0.25 Kuiper’s Test (von Mises, V) 1.149 1.121 1.012 Kuiper’s Test (p) > 0.15 > 0.15 > 0.15
Table 11: Results of the statistical analysis of the orientation of elongated bones by EI.
F7-F6 G6-G5 H5
Data Type Axial Axial Axial
Number of Observations 34 58 34
Mean Vector (µ) 54.053° 4.549° 45.912°
Length of Mean Vector (r) 0.191 0.119 0.381
Median 42° 4° 47°
Concentration 0.39 0.239 0.825
Circular Variance 0.404 0.441 0.309
Circular Standard Deviation 52.102° 59.154° 39.783°
Standard Error of Mean 17.99° 22.345° 8.762°
95% Confidence Interval (-/+) for µ 18.786° 320.744° 28.736°
89.321° 48.354° 63.088°
99% Confidence Interval (-/+) for µ 7.707° 306.984° 23.34°
100.399° 62.114° 68.483°
One Sample Tests
Rayleigh’s Test (p) 0.29 0.442 0.006
Watson’s U² Test (Uniform, U²) 0.11 0.082 0.273 Watson’s U² Test (p) 0.25 > p > 0.15 0.5 > p > 0.25 < 0.01
Kuiper’s Test (Uniform, V) 1.67 1.308 1.747
Kuiper’s Test (p) 0.10 > p > 0.05 > 0.15 < 0.05
Watson’s U² Test (von Mises, U²) 0.042 0.044 0.023 Watson’s U² Test (p) 0.5 > p > 0.25 0.25 > p > 0.15 > 0.5 Kuiper’s Test (von Mises, V) 1.087 0.942 0.77 Kuiper’s Test (p) > 0.15 > 0.15 > 0.15
Table 12: Results of the statistical analysis of the orientation of elongated bones by high-density zones. Strike through values may be unreliable because of low concentration (i.e. uniform distribution).
Fig. 13. Visual maps: a) correlation between lithic tools, faunal remains with cut-marks and/or notches; b) cones sorted by dimensional classes; c) spongy bones sorted by epiphyses and by trabecular indeterminate bones; d) burned bones; e) bone with gnawing traces; f) coprolites.
Fig. 14. Visual maps: a) distribution of Cervus elaphus; b) distribution of Bos primigenius; c) distribution of Callista chione; d) distribution of Mytilus galloprovincialis; e) malacofauna with thermic alterations and/or traces of charcoal; f) malacofauna with bio-erosions.
The scant hyena-related evidence (including the gnawed bone and the trampled and highly fragmented coprolites) do not exhibit evidence of clustering. Conversely, a higher spatial structure signal is detectable among the anthropogenic materials (Figs. 13-14). Interestingly, in G6/III, a fragment of a red deer ileum with cutmarks was found superimposed on a trampled coprolite.
4.4.2. Spatial patterns and Neandertal behaviour
Comparisons of results from both L(d) Ripley’s function and visual maps returned clustered patterns among most of the analysed categories (e.g. spatial distribution of faunal remains with percussion-marks, cones, trabecular bones, burned bones, malacofauna and shells with thermal alterations and charcoal). Moreover, even if in the confidence envelopes of the L(d) Ripley’s function, also the spatial distributions of lithic micro-debris, lithic tools and faunal remains with cut-marks resembles a clustered-type pattern (Figs. 11, 13-14, S2, S3).
Broadly speaking, a structured aspect of the studied area emerges both from the density/scatter maps and from the cluster analysis, the cophenetic correlation value (c = 0.8055) of which underlines the quality of the final dendrogram. The different clusters recognised are characterised by specific co-occurrences of findings. In particular, sectors I5-H5/IV and F7-F6/I, identified by cluster 4, are characterised by a very low density of anthropogenic signal (Figs. 11, 13-15). On the contrary, higher concentrations of findings are recorded in other sectors. The distinctive feature of F6/II-III (corresponding to cluster 1) is the indirect evidence of fire (given by a concentration of burnt bones) (Figs. 13-15). The central part of the excavated area contains clusters 2 and 3. Small faunal remains (1-3 cm in length), cones and marine shells are common items in both these clusters. However they differ from one another for the larger concentration of large faunal remains (> 10 cm), bones with impact notches, trabecular bones and lithic tools (cluster 2) and for a higher occurrence of bones with cut-marks (cluster 3) (Fig. 15). In agreement with the cluster analysis, the density/scatter maps emphasize the same pattern (Figs. 13-15).
Finally, taking into consideration the spatial distribution of Cervus elaphus and Bos primigenius, which are the most abundant species in the faunal sample, we note that the former appears to be randomly distributed, whilst the latter, is markedly clustered, especially when we take into account its different anatomical parts: sector G5-G6 mainly includes head remains (two jaws and four isolated teeth) and forelegs; sector F6-F7 exclusively contains hind-legs (mainly tibia fragments) (Fig. 14a-b).
Fig. 15. Results of the Ward’s Cluster Analysis (a: dendrogram and related table; b: spatial distribution of identified clusters).
Commented [15]: Double column; Colour online
5. Discussion
5.1. Preservation of the context and Homo-Crocuta relationships
The asymmetrical preservation of living floor 150A is linked to the complex post-depositional history of the cave infill. The most destructive event that affected the deposit of Grotta dei Santi is the marine ingression due to the Holocene sea high-stand (Fig. 16). Taking into account both the changes of sea level and the regional tectonic stability (Antonioli, 2012; Ferranti et al., 2006;
Waelbroeck et al., 2002), we know that, during the late Pleistocene, after the deposition of Unit 150, the sea-level was continuously lower than it is today and there was a wide plain extending in front of the cave during the Mousterian occupation. It is only with the Holocene that a relatively rapid rising of sea level has been recorded. This event led to the present landscape (isolating the entrance of the cave from the mainland) and removed the forepart of the prehistoric deposit. Such an
erosional process is still active today as testified by the material signals due to some exceptional southerly gales (Moroni et al., 2019).
The presence of irregular channels crossing some parts of the deposit could be probably related to the action of small-to-middle sized mammals. Among these, the post-depositional wide burrow (possibly due to the action of a small carnivore/lagomorph den), which affected not only Unit 150 but also Unit 111, although highly destructive, is well delimited (Fig. 16).
Other taphonomic parameters appear to be more controversial and need a better contextualization to allow for correct interpretation.
The state of faunal remains (fresh aspect of surfaces, cut-marks and edges, absence or scarcity of trampling and vegetal/animal activity) and lithic finds (fresh edges, clear use-wear traces, very scant evidence of post-depositional alteration on the lithic edges), suggests a good preservation of the context (e.g. no prolongated exposition of materials to weathering and abrasive agents)
(Behrensmeyer, 1978; Lyman, 1994:354-403). On the other hand, the molluscs seem to be framed within a different formational history than faunal remains and lithic finds. The relative difference in their physical state can be related to their fragility due to decalcification. The temporal relation between this decalcification/alteration process and their introduction into the site is not clear. The simultaneous presence of most altered shells and of some very well-preserved large specimens could be consistent with the introduction into the cave of both fresh and partially altered shells. The horizontality of the living floor in the excavated area, together with the planar fabric of the findings and the clustered patterns of most specimens, could suggest a good preservation of the Palaeolithic context and of its behavioural patterns. Nevertheless, the evidence of clusters of findings with a planar fabric on a horizontal layer is not exclusively determinant for assessing the preservation rate of the context, due to the equifinality problem.
Other taphonomic parameters, such as the preservation state of the fireplace, the size-sorting and the fabric analyses, lead us to recognize evidence of a possible partial reworking of the context.
Different preservation patterns were recorded among the fireplaces of Grotta dei Santi (all surficial). The perfectly preserved structures are characterized by ash beds covering charcoal layers and
thermally-altered sediments. In some cases, more phases of use are suggested given the inter-layering of distinct ash-layers and thin brownish/reddish sands (rubefactions). Perfectly preserved fireplaces were excavated and documented in Unit 111; possible well-preserved fireplaces are visible in the cross-sections of Units 100, 150 (lower living floors) and 1004. Conversely, the set of badly-preserved fireplaces spans from the ones with only partially preserved ash layers to the those with almost completely destroyed features, testified by the rubefaction alone (as in the case of living floor 150A). The presence of these variegate preservation patterns must be analysed and
contextualized more in-depth per Unit. Different agents could be responsible for the bad preservation of the fireplace of living floor 150A (e.g. trampling, low-energy water-flow,
bioturbation and other post-depositional processes). The apparent small-scale dislocations between the items bearing evidence of exposition to fire/charcoal (faunal and malaco-faunal remains) and the fireplace could reaffirm the hypothesis of a low-energy shallow-flux event (with a WWS→EEN direction). However the limited extent of the excavated area imposes prudent interpretation.
The quantitative distribution of lithic finds by Dimensional Classes highlights a significant underrepresentation of the smallest items (present anyhow in the lithic sample). The observed quantitative profile cannot be related to bias during the recovering phase, because the soft-sediment covering the living floor allowed for an accurate recovering of sieved findings (based on 1 mm wide mesh sieves). According to the theoretical size-distribution model of a knapping assemblage
provided by Bertran et al. (2012), the quantitative profile of the lithic sample resembles wash material related to ultimate stages of residualization. Nevertheless, given the preliminary nature of this research, more data are needed to verify and calibrate this hypothesis. First, the absolute majority of smaller faunal remains (1-3 cm) partially contrasts with the evidence of lithic finds (despite the different criteria of size classification of faunal remains and lithics). Second, both the lithics and faunal remains do not return clear evidence of linear size-sorting and, so far, there are no sufficient data about the relief morphology of living floor 150A from unexcavated areas. Finally, the partiality and limited extent of the present day excavated area seriously hinders the formulation and verification of more specific hypotheses. Surely, the presence of micro-debris in the living floor 150A testifies that some in situ lithic knapping activities were carried out by the inhabitants.
Nevertheless, only the identification of de facto refuses (sensu Schiffer, 1972) areas can tell us where these activities were carried out. Water-flow events can significantly undermine the
et al., 2012; Isaac, 1967; Schick, 1986, 1987). The spatial pattern of the lithic micro-debris from living floor 150A seems to suggest two possible sorts of “disordered cluster”. Both these zones seem to be related to the presence of fire, as suggested by the rubefaction of the sediment and the presence of burned malacofauna in square H5 and by the concentration of burned faunal remains in square F6/II-III. This evidence resembles the typical hearth-related assemblage model (sensu Binford, 1983), but the very low proportion of micro-debris is not compatible with an experimental lithic knapping assemblage (e.g. Bertran et al., 2012; Schick, 1986, 1987; Spagnolo et al., 2019 and reference therein). Consequently, unless the evidence from living floor 150A represents some marginal/peripheral scatters of drop-zones located elsewhere, these micro-debris weak clusters could be considered to be the remnants of partly residualized drop-zones, possibly by a kind of low-intensity shallow flow, like, for example, an overland flow (Bertran et al., 2012; García-Moreno et al., 2016; Isaac, 1967; Schick, 1986, 1987).
The anisotropic patterns identified among the elongated bones seem to be strongly sensitive both to the elongation index and to the spatial origin of the samples from the excavated area. The EI allows recognition of a trend evolving from the criss-crossed pattern of the bones with 1.7 ≤ EI ≤ 2.5 (NW-SE vs SW-NE) towards the strongly iso-oriented pattern of remains with EI ≥ 3.5 (SSW-NNE); the “intermediate” elongated specimens seem to follow both rules, with a dominant SW-NE mean vector, but statistically not supported. The SW-NE anisotropic orientation (dominant among the bones with EI > 2.5 and secondary among the ones with EI ≤ 2.5) is the same observed in squares H5-I5. The results of the orientation analysis are in line with ambiguous interpretations, in
particular with the limited extent of the excavated area, due to the possible equifinality problem. As shown by experimental studies, statistically significant preferential orientations can be produced by a plethora of causes, including water flows, gravity, scuffing/trampling, human activities and, on a smaller scale, also stochastic events (Arriaza et al., 2018; Domínguez-Rodrigo et al., 2014; Eren et al., 2010; Frostick and Reid, 1983; Krajcarz and Krajcarz, 2014; Lenoble et al., 2008; Olsen and Shipman, 1988). The most plausible explanatory model fitting with the evidence from living floor 150A seems to be the occurrence of an ephemeral post-depositional shallow flux of very low energy. This hypothesis is supported both by the significant (and complementary) difference of the observed patterns by elongation indexes and by the internal coherence of the dominant mean vectors (also in relation to the spatial criterion). As shown by experimental approaches the aligned patterns are typically a function of the morphology/a-axis of the re-oriented specimens, the energy of flux, the height of water and the substrate interaction. In general, a low energy shallow flux selectively re-orients the most elongated items transversally to the current and the specimens with a lower a-axis are re-oriented downstream. Partially submerged bones with high Elongation Indexes can be re-oriented parallel to the current only by increasing the water height (completely