CATANIA UNIVERSITY OF STUDY
FACULTY OF AGRICULTURE
FACULTY OF MATHEMATICS, PHYSICS AND NATURAL SCIENCES
ETTORE ALFREDO ANTONIO PETRALIA
Analysis of the ground Coleoptera communities of agro-ecosystems
within the Oriented Natural Reserve “Pino d’Aleppo” (Ragusa, Sicily)
and their use for assessing the environmental quality
INTERNATIONAL PhD IN
ENTOMOLOGICAL SCIENCE AND THE DEFENSE OF AGROECOSYSTEMS XXIV CYCLE
Coordinator: Prof. Carmelo Rapisarda
Tutor: Prof.ssa Vera D’Urso
Cotutor: Prof. Giorgio Sabella
A Ombretta e Diego
1
SUMMARY
ABSTRACT ... 3
1 INTRODUCTION ... 7
2 THE STUDY AREA ... 11
2.1 GENERAL FRAMEWORK ... 11 2.2 CLIMATE FRAMEWORK ... 12 2.3 GEOLOGIC FRAMEWORK ... 13 2.4 FLORO-VEGETATION FRAMEWORK ... 15 2.5 LAND-USE FRAMEWORK ... 17 2.6 FAUNAL FRAMEWORK ... 19
3 MATERIALS AND METHODS ... 21
3.1 SAMPLING METHOD... 21
3.2 BRIEF DESCRIPTION OF SAMPLING STATIONS ... 22
3.3 METHOD OF DATA STANDARDIZATION ... 29
3.4 METHODS OF EVALUATION FOR THE QUALITY AND QUANTITY COMPARISON ... 30
4 GENERAL ANALYSIS OF SAMPLING REGARDING THE FAMILIES OF COLEOPTERA ... 33
4.1 ANALYSIS OF THE STATIONS FOR COLEPTERA FAMILIES ... 47
5 GENERAL ANALYSIS OF SAMPLING FOR SPECIES OF CARABIDAE, TENEBRIONIDAE AND STAPHYLINIDAE ... 59
5.1 COLEOPTERA CARABIDAE ... 59
5.2 COLEOPTERA TENEBRIONIDAE ... 79
5.3 COLEOPTERA STAPHYLINIDAE ... 98
6 ANALYSIS PER STATION FOR SPECIES OF CARABIDAE, TENEBRIONIDAE, STAPHILINIDAE ... 118
6.1 COLEOPTERA CARABIDAE ... 118
6.2 COLEOPTERA TENEBRIONIDAE ... 128
6.3 COLEOPTERA STAPHYLINIDAE ... 137
7 BIODIVERSITY, EVENNESS AND SIMILARITY INDICES ... 148
7.1 BIODIVERSITY AND EVENNESS INDICES ... 148
7.2 COMPARISON AMONG THE INDICES OF BIODIVERSITY AND EVENNESS ... 156
7.3 SIMILARITY INDEX OF SØRENSEN ... 158
8 OVERALL ANALYSIS OF INDIVIDUAL STATIONS ... 170
9 MULTIVARIATE ANALYSIS OF THE COMMUNITIES ... 190
9.1 NON METRIC MULTIDIMENSIONAL SCALING BASED ON THE BRAY-CURTIS MATRIX ... 190
10 COMPARISON AMONG INVESTIGATED STATIONS DURING THE PRESENT RESEARCH AND STATIONS OF A PREVIOUS RESEARCH ... 229
10.1 METHODS ... 229
10.2 BRIEF DESCRIPTION OF STUDY-2009 STATIONS ... 230
10.3 GENERAL RESULTS ANALYSIS ... 230
2
11 INDEX OF FAUNAL VALUE FOR STATIONS (INV) BASED ON SPECIES OF
CARABIDAE ... 250
12 CONCLUSIONS ... 256
BIBLIOGRAPHY ... 262
ACKNOWLEDGMENTS ... 277
3
ABSTRACT
The agricultural systems that have been established in recent decades are characterized by a high productivity thanks to a series of external factors that raise the efficiency and/or quality. While this practice leads to increase production and make it economically advantageous, the other result is a more substantially simplification of agro-ecosystems and a significant reduction of biodiversity. Today various authors claim that at a reduction of biodiversity correspond a low level of ecosystem stability; for this reason they propose agronomics management systems based on crops diversification and increase of natural marginal areas neighboring the agro-ecosystems; this practice improve biodiversity, especially for generalist and specific predators, insect pollinators etc., with a possible decrease of human interventions like the use of pesticides.
Most researches in this field aimed to establish the relationship between a certain type of agronomical practice and a specific group of insects, with results that differ in relation to insect species, selected agronomical practice and location. Seldom the attention was focused on a wider scale of biodiversity with reference to landscape mosaic, to understand its effect on agro-ecosystem biocoenosis composition, dynamic and homeostatic.
Recent studies showed that increasing or maintaining a high level of biodiversity in agriculture depend not so much on the reduction of conventional farming practices but rather on other factors, where the most significantly appears to be the patchy structure of landscape.
In the Mediterranean area, human activity has dramatically reversed the relationship between open spaces and forests, reducing the latter to fragments inserted in a matrix profoundly changed: in flatland and hilly areas the extension of the forest has been drastically reduced and they are now comparable to islands more or less large.
The “Pino d’Aleppo” Natural Reserve, where the present research was conducted, shows a typical situation: a mosaic of natural and semi-natural habitats fragmented and isolated at various degree, within an environmental matrix strongly modified by human actions, first of all the intensive use of land for agricultural activities.
This research concerned the study of ground Coleoptera communities of three different agro-ecosystems: Arable land with Carob trees (AC), Olive grove (Ol) and Citrus grove (Ci) and of a residual patch of Mediterranean maquis (Tk) investigated by pit-fall traps.
Therefore, the study focused on Coleoptera, for which has been developed the examination of
Families, with particular reference to species of Carabidae, Tenebrionidae and Staphylinidae
(excluding Aleocharinae).
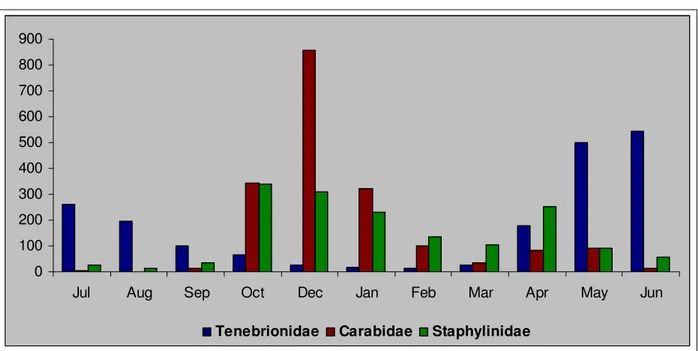
Inside each station five pit-fall traps have been installed filled with a solution of water, vinegar and table salt in saturation; the gatherings of the pit-fall traps took a year from June 2009 to July 2010. An amount of 10.402 specimens of Coleoptera (belonging to a total of 42 Families) have been collected, with 2.064 specimens belonging to a total of 38 Carabidae species, 1.899 specimens belonging to a total of 26 Tenebrionidae species and 1.026 specimens belonging to a total of 46
Staphylinidae species (excluding Aleocharinae).
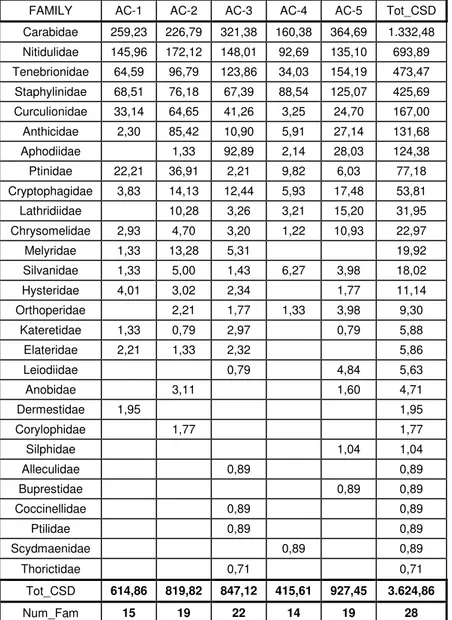
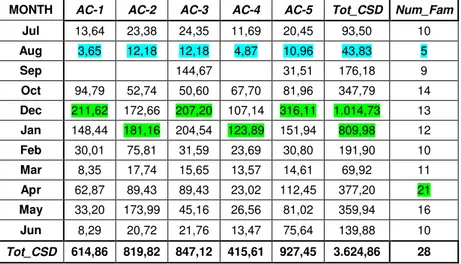
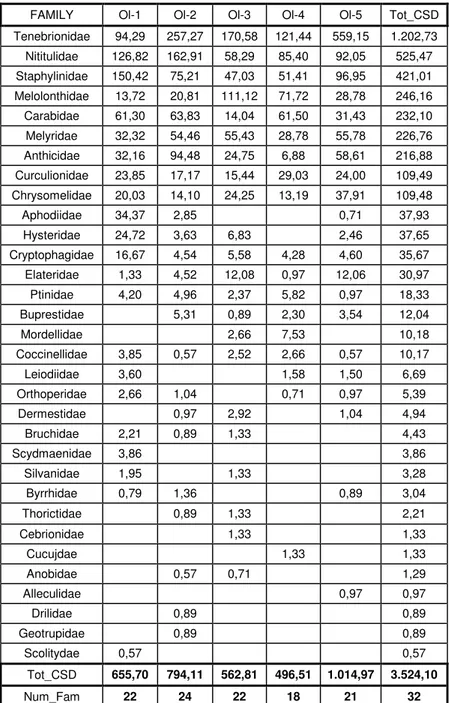
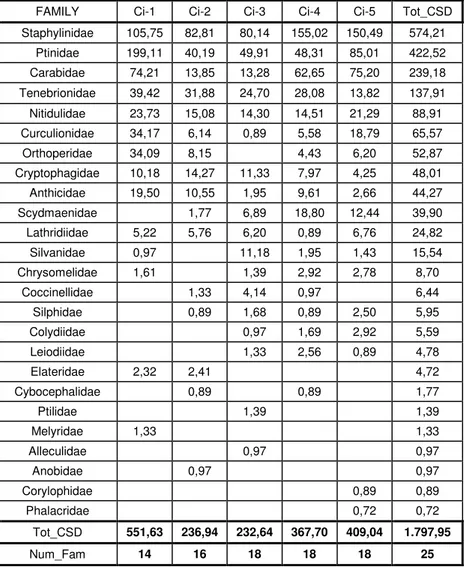
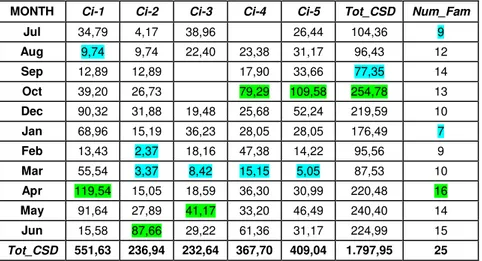
The sampling data were standardized according to the unit effort and expressed as value of CSD (Standard Capture Density). The CSD of Coleoptera, both for Families and species, was analysed during the entire period of sampling and in the different stations, and even in individual trap for each station.
The following biodiversity and similarity indices have been computed:
• Index of Margalef (d) to evaluate the richness in taxa among the surveyed places; indices of Simpson (D) and Shannon (H’) to evaluate the biodiversity of the surveyed places.
• Pielou (J) and Simpson’s Dominance (λ) indices to evaluate the evenness. • Index of Sørensen (QS) to evaluate similarity rates.
For the comparison between communities was used a multivariate analysis by the method of Non Metric Multidimensional Scaling based on the index of similarity of Bray-Curtis and tested with ANOSIM and SIMPROF.
4 All the indices and the multivariate analysis of the communities were elaborated for Coleoptera
Families and for species of Carabidae, Tenebrionidae and Staphylinidae (excluding Aleocharinae).
The results obtained have been compared with the data of a previous research conducted from July to December 2007 using the same method within the same area in different habitat typology: 3 natural Pinus halepensis woods, 1 maquis, 2 garrigues, 1 meadow, 1 artificial Pine reforestation (BOCCHIERI 2009).
With regard to the single family of Coleoptera Carabidae, it was developed the index for fauna value (INV) (in BRANDMAYR et alii, 2005) for each of the 12 patches studied, transferring than the
value of this index on computerized cartographic support (GIS platform) to process of thematic maps elaboration.
The study has underline that:
1) Three species are new for Sicilian fauna: Microlestes fissuralis (Reitter 1901), Pterostichus
(Platysma)niger niger (Schaller 1783) e Micropeplus porcatus Paykull 1789.
2) The biodiversity of ground fauna occurs with different aspects depending on the stations
and groups considered.
Biodiversity appears to be in some cases depending on the intrinsic structure of single stations, while in other cases on the group of animals taken into consideration.
Data suggest that the assessment of biodiversity levels for a site, taking into account the component under investigation, generally represents a fraction of the total animal diversity being influenced by bio-ecological characteristics of the component itself. So it is not possible to take conclusion only considering one or a few animal groups, although some areas have intrinsic features that give a strong and homogeneous connotation to the structure and characteristic of the ground fauna. This limitation for the biocenotic analysis can be partially solved by a multi-taxa approach.
3) Biodiversity is distributed in different temporal domains.
The asynchrony of captures peak for species of Carabidae, Tenebrionidae and Staphylinidae most abundantly sampled is an additional aspect of the biodiversity. The phenology of the species permit to identify in the summer, characterized by the limiting factors (e.g. temperature and humidity) of primary importance in the mediterranean contest, the critical period for Carabidae and Staphylinidae but not for Tenebrionidae, coherently with the bio-ecological characteristics of these Families. The fraction of ground fauna of agro-ecosystems examined in this study shows a complex structure through which it can occupy the most temporal ambits with different species that follow one another over time.
This diversity is favored by the structure of the landscape mosaic. Actually, the species of Coleoptera Carabidae, Tenebrionidae and Staphylinidae most abundantly sampled during this study show, generally, a clear preference for one station where they recorded high values of CSD, while they are absent, or present with low values of CSD, in the other stations. Their presence is therefore linked to some patches, rather than others, and is thus made possible precisely by the environmental mosaic that characterizes the study area.
4) The biodiversity of ground fauna observed within the investigated agro-ecosystems is not as
high on average, both for Families and for the species complex of Carabidae, Tenebrionidae and Staphylinidae, than that found in natural habitats within the same area.
The comparison of data obtained in the present research with those of the previous study conducted, using the same method within the same area, in natural environments, shows that biodiversity and evenness indices registered for agro-ecosystems are in most cases lower than that of stations in natural environments, both for Coleoptera Families and for species of Carabidae and
Tenebrionidae. As for Staphylinidae should be noted that they present a model of biodiversity indices values significantly different from the previous with Shannon and Pielou indices values higher in some agro-ecosystems than in some natural environments. This could be partially
5 explained with the fact that the most abundant species sampled are ubiquitous and especially phyto- or zoo-saprophytic, connected to temporary microhabitats characterized by strong seasonal fluctuations, and provided with good dispersal ability related to active flight.
5) The stations differ significantly in community structure at any level they are investigated. The examination of the indices of similarity and the Non Metric Muldimensional Scaling, based on the index of Bray-Curtis, show a general more homogeneity between the traps of each of the 4 stations investigated in the present study, than between that 8 stations examined in the previous research. The ANOSIM tests confirms, with values always statistically significant for all groups considered, that traps of a station are more similar to each other than to those of other stations. This homogeneity is accompanied by a slight similarity between the stations, as evidenced by the qualitative index of Sørensen and the Non Metric Muldimensional Scaling. In particular, the parwise test shows for all groups investigated that the dissimilarities between stations are, with few exceptions, statistically significant.
In conclusion, the study points out that all considered stations differ significantly from each other for the structure of coenosis investigated, both in terms of quality and quantity, and that each has such features able to maintain different fractions of ground fauna, thereby contributing to preserve significant and peculiar portions of biodiversity.
6) The contribution of this biodiversity, and the stability of agro-ecosystems remains to be
defined.
This study has emphasized the specific zoocoenosis at each station and their contribution for the preservation of biodiversity. However it remains to define the role of biodiversity as ecology-stabilizer of agro-ecosystems.
7) In prospect of a correct land management, considering that the land investigated is a
protected area, the patches should be protected to maintain significant levels of biodiversity.
The study highlights the strategic role of the environmental mosaic for the preservation of adequate levels of biodiversity of ground fauna in the area in question.
The computation of the faunal value index for habitats (INV), based on species of Coleoptera Carabidae according the methodology proposed by BRANDMAYR et alii (2005), shows that the
station with the highest value (medium class) is the agro-ecosystem AC (Arable land with Carob
trees) followed by stations with medium-low class value, that in decreasing order are: Mq (Maquis), Mw (Meadow) and WD (Pine artificial reforestation), Ci (Citrus grove) and Tk (P. halepensis – Q. calliprinos thicket), WC (P. halepensis wood 3), Ga (Garrigue 1) and WA (P. halepensis wood 1), while only three stations: WB (P. halepensis wood 2), Gb (Garrigue 2) and Ol (Olive grove) show low class values for fauna quality.
The properties of the natural mosaic at a landscape scale and its significance for the conservation of biodiversity have been recently investigated in order to have a valid scientific basis for the study and the preparation of measures for protection and land management. These studies underline three main properties that affect biocoenosis: the extension of the habitat, the composition of the mosaic and the spatial configuration of the elements. In particular, the extension of the habitat influences the presence of individual species. In our case, the extreme fragmentation, the small size and their relative isolation give to the natural landscape patches of the Pineta di Vittoria a marked ecotonal facies, which affects the structure and stability of the biological communities in the single patch. This could explain, for example, the low affinity found between the four residuals of Pinus
halepensis forest, or between the two fragments of mediterranean maquis. The extension of such
patches of natural landscape would therefore be an important purpose towards the biodiversity conservation and the recovery of a more stable and homogeneous biocoenosis of scrub and forest environments.
Whereas some studies have shown different properties of the environmental mosaic characterized by good or poor ecological connectivity and different responses depending on the groups
6 investigated (DIEKÖTTER et alii 2008), the conservation strategies should be guided by flexible
7
1 INTRODUCTION
The agricultural systems that have been established in recent decades are characterized by a high productivity thanks to a series of external factors that raise the efficiency and / or quality. While this practice leads to increase production and make it economically advantageous, the other result is a more substantially simplification of agro-ecosystems and a significant reduction of biodiversity (HERNÁNDEZ 1997, ALTIERI 1999, BENTON et alii 2003, ALLEN 2003, BUREL et alii 2004, HERZOG
et alii 2005, TSCHARNTKE et alii 2005, FIRBANK et alii 2008, GEIGER et alii 2010, SAUTEREAU et alii
2010).
Within an agroecosystem are, conventionally, found two different components of the functional biodiversity: planned biodiversity, which depends on the application of agricultural practices (such as plant species used in the field, crop rotation, types of soil tillage, etc.) and associated
biodiversity, that includes all the components of fauna and flora that colonize the agroecosystem
from surrounding environments, becoming part of that in relation to its conduction and structure (BESTELMEYER et alii 2003, CARDINALE et alii 2003, WEIBULL et alii 2003, LETOURNEAU &
BOTHWELL 2008, BALOG et alii 2009,YASUDA 2010).
The evaluation of the impact of agricultural practices on biodiversity conservation has long been the subject of many publications (CARCAMO et alii 1995, ALTIERI 1999, PFIFFNER & LUKA 2000,
WASCHER 2000, BUGUNA-HOFFMANN 2000, STOATE et alii 2001, LIANG et alii 2001,
HADJICHARALAMPOUS et alii2002, DÖRING &KROMP 2003, WEIBULL & ÖSTMAN 2003,HAYSOM et
alii2004,THORBEK &BILDE 2004), all showing some negative effects, as the most important seems
to be the loss of environmental heterogeneity (PURTAUF et alii 2005, HERZOG et alii 2005, HOLE et
alii 2005, SCHWEIGER et alii 2005, JACKSON etalii 2007, BRUSSAARD et alii 2007 DE ARANZABAL et
alii 2008, BROCK et alii 2010, POWER 2010).
Some agricultural practices, at least potentially, have a direct influence on functional biodiversity, being able to cause either its increase or its decrease. The use of pesticides, for example, while preserving the crops from harmful species, causes a general decrease in diversity and therefore that of those species operating as natural predators of dangerous insects, with the consequently possible increase of these latter (ANDERSEN 1982, ALTIERI 1994, SAMSØE - PETERSEN 1995, SHAH et alii
2003, PRASAD &SNYDER 2004, BALOG & MARKO 2007, BALOG et alii 2009, GIBBS et alii 2009,
GEIGER et alii 2010).
According some authors (ALTIERI 1995, ALTIERI 1999, ALTIERI 2002,ALTIERI 2004)an increase in
biodiversity promotes sustainable production. The use of “agro-ecological practices”, such as diversification of crops and presence of marginal areas with characteristics of natural or seminatural, helps to reduce ecological simplification resulting in an increase of functional biodiversity that make agro-ecosystems more stable (THIES & TSCHARNTKE 1999, LANDIS et alii
2000,TSCHARNTKE et alii 2005, PRETTY 2008, WEZEL et alii 2009, GABRIEL et alii 2010, GROOT et
alii 2010, FAHRIG et alii 2011).
From this point of view, an increase of generalist predator components is considered useful because, directly or indirectly, they can potentially control the populations of phyto-saprophagous species harmful to agriculture (KAREIVA 1990, JONSEN & FAHRIG 1997, HOLLAND & THOMAS 1997,
BENGTSSON et alii 2005, GIBSON et alii 2007, BIRKHOFER et alii 2008).
Many studies have been conducted in this context with special reference to predators, both generalist and specialized, like Carabidae, Staphylinidae, Araneidae, etc. (LANDIS et alii 2000,
MÄDER et alii2002,SYMONDSON et alii 2002, PIFFNER &LUKA 2003, SHAH et alii 2003, MEEK et
alii 2002, BENGTSSON et alii 2005, BIRKHOFER et alii 2008, LOBLEY et alii 2009).
The results are sometimes contradictory, showing positive, neutral or even negative effects, in relation to the taxon examined or the environmental context (altitude, biogeographic area, etc.) where research was carried out (MOREBY et alii 1994, KROOS & SCHAEFER 1998, ANDERSEN &
ELTUN, 2000, WEIBULL et alii 2003, WINDER et alii 2005, CLOUGH et alii 2007, BEST 2008,
8 Many of these studies have investigated a single type of agro-ecosystem in relation to different agricultural practices, but they rarely direct their attention to the landscape as larger scale of diversity. However it was proved that in many cases the increase, or maintain a high level, of biodiversity in agriculture depends not so much on the reduction of conventional farming practices, but rather on other factors, where the mosaic structure of the landscape appears as the most significant one (WIENS 1995, ATAURI &DE LUCIO 2001,ÖSTMAN et alii 2001, RENJIFO 2001, WITH
et alii 2002, ALTIERI et alii 2003, DAILY et alii 2003, EILU et alii 2003, WEIBULL &ÖSTMAN 2003,
BENNETT et alii 2006, ERNOULT et alii 2006, ZAMORA et alii 2007) together with its heterogeneity
degree (ROFF 1974a, ROFF 1974b, GERING et alii 2003, PAUSAS et alii 2003, TEWS et alii 2004,
FISCHER et alii 2004, LASSAU et alii 2005, STRIJKER 2005, ERNOULT et alii 2006, DE ARANZABAL et
alii 2008, PALMER et alii 2010).
That population dynamics of the single cultivated field are directly or indirectly influenced by those established at the wide area level. The agricultural landscape mosaic (farmlands, tree crops, semi-natural and semi-natural areas, etc.) provides suitable conditions to carry out the biological activities (reproduction, feeding, etc.) of many useful species for agriculture. On the contrary, these conditions do not occur in a landscape characterized by extensive monoculture (THOMAS et alii
1991, DUELLI 1997, ALTIERI 1999, SHAH et alii 2003, ZAMORA et alii 2007,BRÜHL &ELTZ 2010).
Many studies show that natural areas and habitats or ecotonal bands between cultivated areas and natural environments, facilitate the dissemination of predatory species, which can play within the single cultivated field the role of potential regulators for populations of destructive species, limiting, consequently, the need of using agricultural pesticides (WITH & CRIST 1995, KAREIVA &
WENNERGREN 1995, DUELLI 1997, DUELLI & OBRIST 1998, HADDAD 1999, ALTIERI 1999,
TSCHARNTKE et alii 2005, ROSCHEWITZ et alii 2005, DIEKÖTTER et alii 2008).
The mosaic structure of the environment has been for years under investigation, in relation to the structure of populations and communities (NIEMELÄ et alii 1986; NIEMELÄ et alii 1988; KLEIN
1989; BAUER 1989a, BAUER 1989b; SAUNDERS et alii 1991, NIEMELÄ et alii 1992; MARGULES et
alii 1994,LAW &DICKMAN 1998,THOMAS 2000,GOLDEN &CRIST 2000,ATAURI &DE LUCIO 2001,
MAGURA et alii 2001, NIEMELÄ 2001, MCGARIGAL & CUSHMAN 2002, OLFF & RITCHIE 2002,
PARKER & MAC NALLY 2002, BAILEY et alii 2002, STEFFAN-DEWENTER & TSCHARNTKE 2002,
FAHRIG 2003,TSCHARNTKE &BRANDL 2004,BENNETT et alii2006).
The analogy of the patches with the islands was also the starting point for studies aimed at verifying whether their communities are regulated by the balance between extinction and immigration, as appears to characterize the island communities (MACARTHUR & WILSON 1967; SIMBERLOFF 1974;
WILLIAMSON 1989, HAILA 2002). A mosaic of environments has been even identified in extensive
and apparently uniform areas such as tropical forests (BROKAW 1985), and has been argued that this
heterogeneity may account for the extraordinary biodiversity of this biome (HUSTON 1994).
This spatial structure of the landscape has been correlated with that of the populations that constitute the community. It was thus possible to define two main typologies for populations: multi- populations, correlated with wide environments, and metapopulations correlated with single patches (DEN BOER 1979; DE VRIES et alii 1990, BAGUETTE 2004).
The environmental mosaics, and their high heterogeneity, are already largely used to individuate the contexts in which it is possible to hypothesize evolutionary processes, as speciation and variation in space-time structure of biocenosys (HENGEVELD 1994). Actually the definition of an articulated
theoretical framework of instruments to apply at various territorial planning levels (FOSTER et alii
2003, ANTROP 2005), with the purpose of maintenance of high biodiversity degree (AHERN 2001,
ALTIERI 2004,YOUNG et alii2005,WEZEL et alii2009), is possible only through the acquisition and
comparison of data on real communities in different environmental contexts. This obviously also applies for the management of agroecosystems.
For this reason, the study of communities of fragmented habitats has now become a necessity, especially in ecological contexts such as those of the mediterranean environments characterized by
9 a number of articulated limiting factors and where the territory is under continuous transformation (RESCIA et alii 1997, NAGENDRA et alii 2004, CLOUGH et alii 2007, DE ARANZABAL et alii 2008,
GERI et alii2010).
The mosaic structure of the environment is generally determined by natural and / or anthropic disturbance events and its characteristics are highly related to the type and degree of the disturbance (WHITE & PICKETT 1985; SAUNDERS et alii 1991, FAHRIG 2003, GERI et alii2010).
The natural disturbances which determine a patches structure, have different dynamics: in forest systems, for example, the collapse of old trees produce small extension areas characterized by a dynamic community that tends to reconstitute, in a relatively short time, the previous balance. Rather fires or slush avalanches cause much stronger and perturbing effects; the eruptions, in volcanic environment, determine continuous fragmentation of habitats with consequent effects also on the genetic structure of populations (VRIJENHOEK, 1985; CARSON & TEMPLETON 1984; CARSON
et alii 1990, TANAKA et alii 2008).
It is nowadays crucial to understand the structure and dynamics of coenosis for fragmented habitats, to provide both general and detailed information on the management of territory, also in line with Community policies. This is strongly indispensable where the purpose is establishing appropriate policies to protect biodiversity, which cannot be promoted on the basis of simple theoretical considerations.
In the Mediterranean area, human activity has dramatically reversed the relationship between open spaces and forests, reducing the latter to fragments inserted in a matrix profoundly changed: in flatland and hilly areas the extension of the forest has been drastically reduced and they are now comparable to islands more or less large.
The Pino d’Aleppo area, where the present research was conducted, shows a typical situation: a mosaic of natural and semi-natural habitats fragmented and isolated at various degree, within an environmental matrix strongly modified by human actions, first of all the intensive use of land for agricultural activities.
The effects of these radical changes on fauna are evident with regard to vertebrates, with not only the disappearance of species and genera, but also of Orders. But for small size species, such as those of the soil arthropod community, becomes difficult to assess how these changes have affected them. They are not static and presumably vary depending on the community and the sites investigated. Anyway, they are populations whose living space is represented by small portions of territory and whose microhabitats may persist, though with reduced frequency, even in situations of profound changes.
This research concerned the study of ground Coleoptera communities of three different agroecosystems (arable land with Carob trees, olive grove and citrus grove) and of a residual patch of mediterranean maquis.
Therefore, the study focused on Coleoptera, for which has been developed the examination of Families, with particular reference to species of Carabidae, Staphylinidae and Tenebrionidae.
These families of Coleoptera are of great importance for the study of soil fauna, due to their relative abundance, to the number of species, to their ecological specialization and diversification; so the study of these components allows to explore different aspects of changes in space-time structure of the ground fauna.
Regarding the groups investigated, few studies (and mainly concentrated on Carabidae and Staphylinidae) have so far conducted in the mediterranean ambit.
The communities of Carabidae are the subject of numerous investigations in european sphere (see
VAN DER BOER et alii 1986), and have been used since time as bioindicators (BRANDMAYR & ZETTO
BRANDMAYR 1980,BRANDMAYR 1983, PIZZOLOTTO 1993, PIZZOLOTTO 1997, BRANDMAYR et alii
2005, UEHARA-PRADO et alii 2009), but few studies are that conducted in environments strictly
mediterranean (BRANDMAYR et alii1981a,BRANDMAYR et alii1981b, BRANDMAYR & PIZZOLOTTO
10 2002,PIZZOLOTTO et alii 2005) and in Sicily (BRANDMAYR & PIZZOLOTTO 1990, PIZZOLOTTO &
BRANDMAYR 1990).
The zoocoenosis of Staphylinidae are even less studied than Carabidae. In the mediterranean area were investigated by OUTELERO DOMINGUEZ (1981), in the italian ambit studies have focused on
forest habitats (CHEMINI & ZANETTI 1982, SCHATZ 1988, ZANETTI 1992, ZANETTI et alii 1997,
TAGLIAPIETRA &ZANETTI 2002,ZANETTI &MANFRIN 2004, ZANETTI &TAGLIAPIETRA 2005), while
the ground biocoenosis of Sicilian forest environments have been studied with regard to Nebrodi (SABELLA & ZANETTI 1991), Etna (ADORNO 1994) and Hyblean (ADORNO & SABELLA 1998). In
Sicily ADORNO (2002) has also investigated the effects of soil erosion on communities of Carabidae,
Staphylinidae and Tenebrionidae of Etna.
Here, the present study aims to delineate the structure of Coleoptera communities of the 4 patches explored, and then to compare it with that of 8 other patches of natural and semi-natural habitats, still inside the R.N.O. Pino d’Aleppo, studied with the same methodology, from July to December 2007, by BOCCHIERI (2009). The research purpose is to define the role and importance of these
landscape patches to maintain, or increase, biodiversity and to imagine as well, on the basis of scientific criteria, models of management and planning for agricultural activities that allow the maintenance of high biodiversity degree at single species and ecosystem levels.
With regard to the single family of Coleoptera Carabidae, it was developed the index for fauna value (INV) (in BRANDMAYR et alii2005) for each of 12 patches studied, transferring than the value
of this index on computerized cartographic support (GIS platform) to process of thematic maps elaboration.
11
2 THE STUDY AREA
2.1 GENERAL FRAMEWORKThe Riserva Naturale Orientata “Pino d’Aleppo” was established by D.A. n.536/90 of Assessorato Territorio e Ambiente of Sicilian Region, with the aim to safeguard the remaining native Pinus
halepensis formations and restore the pine forest where scrubland areas degraded by human action.
The protected area management entrusted to the Provincia Regionale di Ragusa, lies in the municipalities of Victoria, Comiso and Ragusa (figs. 2.1.1 e 2.1.2) and covers approximately 3.000 hectares of integral reserve area (zone A) and pre-reserve area (zone B).
The site is an SCI (Site of Community Importance ITA080003 - Vallata del fiume Ippari) (fig. 2.1.2) established by D.P.R 357/97 and s.m.i., in application of Directive 43/92 CEE. The area of SCI almost completely overlaps that of Reserve and will be used as a reference in the discussion of the study area.
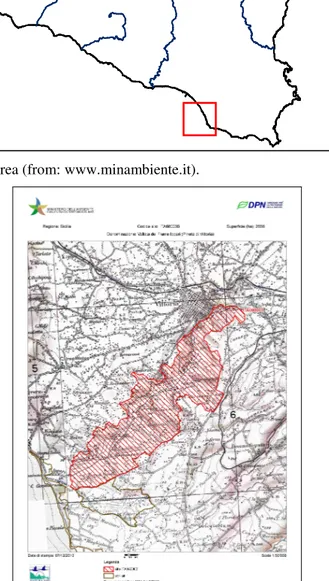
Fig. 2.1.1- Location of the study area (from: www.minambiente.it).
Fig. 2.1.2 – Perimeter of the SCI ITA080003 - Vallata del fiume Ippari (from: www.minambiente.it).
The area lies between in longitude 14° 27’ 13” and 14° 33’ 35”, and in latitude between 36° 27’ 01” and 36° 57’ 4”; it is contained within the Foglio IGM (1:100,000) 275 “Scoglitti” and Foglio IGM 276 “Ragusa”, and within Tavolette IGM (1:25.000) 276 IV N.O. “Victory”, 276 IV S.O. “Donnafugata” and 275 I S.E. “Scoglitti”, occupying the lower part of the river Ippari.
12
2.2 CLIMATE FRAMEWORK
Based on the information reported in the Atlas of Climatology of Agro-Meteorological Information Service Department of Agriculture and Forestry of the Sicilian Region and in the Plan for the Protection of the Waters of Sicily are identified for the Ippari basin area of interest the following climatological indices:
- Lang’s Rain-Factor indicates a steppe climate;
- De Martonne’s Index of Aridity is comprised between semiarid and warm-temperate; - Emberger’s pluviometric quotient is comprised between semiarid and sub-humid; - Thornthwaite’s index of moisture reports a climate from semiarid to dry-subhumid;
- Rivas Martinez’s bioclimatic index proposes a climate from inferior dry thermo-mediterranean to dry superior thermo-thermo-mediterranean.
Looking at the thermopluviometric diagram for Vittoria (fig. 2.2.1) it shows that the annual average temperature is approximately 18°C, with a dry period that extends from April to September.
As for precipitation it shows that the averages range vary from 300/400 mm in coastal areas to 600/700 mm in inner territories, with a monthly distribution typically Mediterranean, and a concentration of rainfall in autumn and winter and a drastic reduction of that in the period spring-summer.
Fig. 2.2.1 –Climate diagram of Vittoria thermopluviometric stations (from ZAMPINO et alii 1997). To the right are
reported elevation characteristics of the station, numbers of years of observation (A.O.), the mean annual and monthly temperature and rainfalls.
Based on available data, the study area falls in the bioclimatic range of superior themo-mediterranean thermotype and superior dry ombrotype. By comparing the location of the study area with the neighboring areas (fig. 2.2.2), it is evident that the bioclimatic type in question occupy the coast-hills.
As the distance from the sea and the altitude change, occurs a rapid succession of different types of bioclimatic increasingly fresh and moist. For each type or bioclimatic range corresponds to a different type of natural climaceous vegetation or “climax”.
It represents the most advanced natural vegetation for each bioclimatic belt. In the study area, although the deep anthropic changes have resulted in the reduction or disappearance of much of the original natural vegetation, it can be assumed that the original climax vegetation is Quercus suber wood, attributable to Stipo bromoidis-Quercetum suberis.
13
Fig. 2.2.2 - Bioclimatic types of South-East Sicily (from SCELSI &SPAMPINATO 1998). With black dot (●) is indicated
the location of the study area.
2.3 GEOLOGIC FRAMEWORK
The study area represent the south-eastern sector of the wide foothills strip comprised between the Hyblean Plateau and the Erei Mountains; it is a vast sub-flat sector, called Piana di Vittoria, which develops elongated in the direction NE - SW between Chiaramonte Gulfi, Comiso, Vittoria and the Canale di Sicilia, with an altitude generally ranged between 50 m and 300 m a.s.l.
The Piana di Vittoria slopes gently toward the sea, with large undulating forms resulting from the erosive surface water run-off, bringing the outcrop of a substrate consisting of clayey and sandy
14 deposits, showing also sandstone-sandy Pleistocene deposits intercalated with silt-clay layers. Below the Pleistocene deposits are found other land forming the clastic and pelagic Gela foredeep and Hyblean avampaese deposits.
The oldest outcropping deposits are represented by Trubi, calcareous marl and marly limestone, generally covered with clay of the deep sea, with the exception of the eastern section of the plain, where they are replaced by bio-calcarenite with an average thick of 40-50 m; the most recent deposits are represented by fine marine sands having a thickness of up to tens of meters.
The main river axes are represented by Dirillo river and Ippari river, both with NE-SW course that border the plain respectively to the west and east.
The particular amplitude of the valley, particularly in the area between the town of Vittoria and the mouth of the Ippari river, has favored the settlement of the man who took advantage from the side portions and the same riverbed, as well as the large areas of alluvial, for agricultural purposes planting varieties in the past also valuable.
Finally, at the mouth the river makes its way through residual ancient dunes almost disappeared due to human activities.
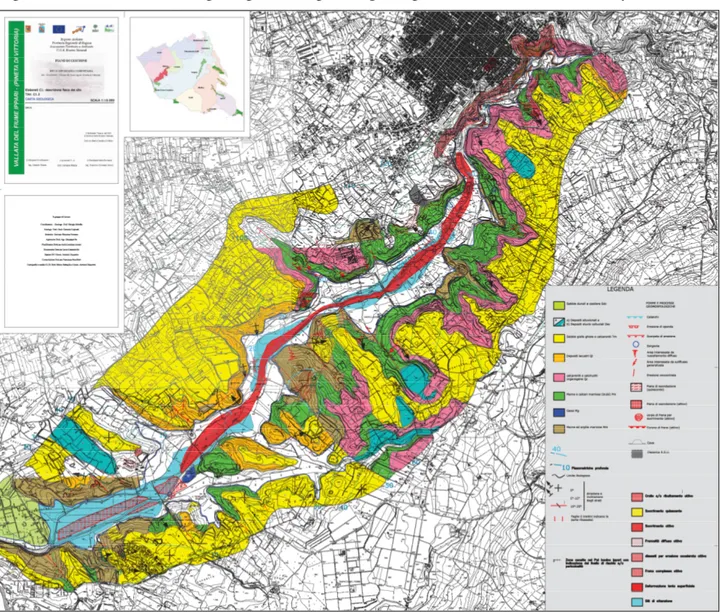
Figure 2.3.1 shows the main geological and geomorphologic characteristics of the study area.
Fig. 2.3.1 – Geological and geomorphologic map of the study area (from PdG del SIC ITA080003 Vallata del fiume Ippari).
15
2.4 FLORO-VEGETATION FRAMEWORK
The study area is a site of exceptional geobotanic interest as represents one of the few natural Pinus
halepensis forest in Sicily. It is developed on marly substrates for which the pine is an edafoclimax.
The site also features, even in relation to the aridity of the climate, by peculiar scrublands that host a rare flora.
A significant portion of the area is home for real pine-forests, interpenetrating with maquis-scrubland and garigues, and are characterized by large clearings whose origin can be traced back to the felling and fires that in the pastime were common in the area.
The natural plant formations are represented by scrub and garigue with pine trees, scrub and garigue without pines, dry meadows of Thero-Brachipodietea.
The maquis-scrub is often attributable to Chamaeropo-Quercetum calliprini or Pistacio-Quercetum
ilicis, or rarely to Ephedro-Pistacietum lentisci, while in the garigue dominates the
Rosmarino-Thymetum capitati abundantly accompanied by Globularia alypum in the warmer slopes.
Near the sea, on land predominantly sandy, there are sparse groupings of Juniperus oxycedrus subsp. macrocarpa and the presence of Retama raetam subsp. gussonei.
On the sides of the valley dominates the class of Thero-Brachypodietea with formations that pervade as mosaic the garigues in Thimus and Rosmarinus. Where the sand, though incoherent, it manages to retain a good percentage of humus settle Malcolmietalia associations.
It’s also present the association Vulpio-Leopoldietum gussonei with Muscari gussonei.
In the districts of Martorina and Passo Piro of the town of Comiso, abound the associations with
Ampelodesmos.
Where limestone or marl are replaced by clays are present, more or less sporadically, specimens of
Salsola oppositifolia, Salsola agrigentina, Capparis ovata, Asparagus aphyllus, etc.
Do not miss aspects of vegetation typical of riparian brackish areas with various species of Juncus and Carex, as well as the rare Lithrum tribracteatum.
On limestone rocks settles vegetation dominated by Euphorbia dendroides attributable to
Oleo-Euphorbietum dendroidis (Quercetea ilicis class).
The real-river vegetation is very degraded, having been completely eradicated in the past the riparian forest to make place for crops of Arundo donax.
Surprising is the number of rare plant species, endemic and with phytogeographic significance:
Loeflingia hispanica, Cistus clusii, Retama raetam, Ophrys calliantha, together with species of
Community interest Muscari gussonei and Ophrys lunulata.
It should also be noted that many species, even rare, of various genera of Orchidaceae are concentrated in the valley.
From the dynamic point of view, the landscape consists essentially of two edaphophilous series, each characterized by aspects linked together in which any stage is the result of a dynamic evolutionary or regressive process. The first series, Coridothymo-Pineto halepensis sigmetum, is characterized by Coridothymo-Pinetum halepensis representing the more mature stadium. This vegetation that grows on marly substrates is replaced, due to degradation processes especially through works of cutting and fires, by the aspects of garigue of Rosmarino-Coridothymetum
capitati or of that Cistetum salvifolio-clusii. The further degradation of garigue leads to the Ampelodesmos mauritanicus meadows, which are reported for hyblean area to the Helichryso-Ampelodesmetum mauritanici.
The second series, Junipero-Querceto calliprini sigmetum, is characterized by the more advanced maquis stage of Junipero-Quercetum calliprini, which develops in correspondence with sandy substrates; as a result of degradation processes such association is replaced, always above sandy substrates, by coenosis referred to the Hyparrhenio-Helianthemetum sessiliflorum. This is followed by a particularly interesting aspect of the area represented by the type of psammophilous vegetation of Malcolmietalia: the Vulpio-Leopoldietum gussonei, association characterized by
16 Among habitats of particular importance are included: natural Pinus halepensis pine forest, interesting and special native wood-formation that nowadays represents a small part of that original tree cover that once covered wide areas of the south-eastern Sicily; formations of Quercus ilex, also associated with Pistacia lentiscus, Phyllirea angustifolia, Asparagus acutifolius, Rubia peregrina, representing residual of a thermophilous forest vegetation physiognomic characterized by Quercus
ilex; formations of Euphorbia dendroides, related to rocky environments, being usually part of
xerophilous and pioneer series located along arid and sunny ridges, which sometimes play a minor role, settling on soil substrates impoverished by erosion and landslides, left open by woodlands as a result of degradation processes (cutting, fire, etc.); maquis with elements of Oleo-Ceratonion where there are typical elements of Oleo-Ceratonion and Pistacio-Rhamnetalia such as Olea europea var.
sylvestris, Pistacia lentiscus, Artemisia arborescens, Anagyris foetida, Teucrium fruticans; garigues
and maquis of evergreen sclerophyll, present on calcarenitic substrates with a strong sandy component, in stations characterized by an extremely xeric microclimate, where it develops a typology of garigue characterized by the presence of Cistus clusii, species with an western-Mediterranean distribution, with Cistus salvifolius, Cistus monspeliens, Cistus creticus, Rosmarinus
officinalis, Coridothymus capitatus, Phagnalon rupestris, Calicotome infesta;
thermo-mediterranean and pre-desert shrubs (with Pistacia lentiscus, Phyllirea angustifolia, Coridothymus
capitatus, Cistus monspeliensis, Cistus incanus), which develop on marly substrates and derive
from the degradation process of Coridothymo-Pinetum halepensis pine-forest; there the frequent fires especially in the past have affected this area, together with works of cutting and grazing: that has resulted in the disappearance of the tree layer and the development of shrub-type formations. In the territory there is in fact in some areas recently subjected to fires, a transition more or less gradual from dense pine forest to more and more open forest, physiognomy characterized by sparse specimens of Aleppo pine trees, and especially by tree-shrub species favored in their diffusion by the action of fire.
17
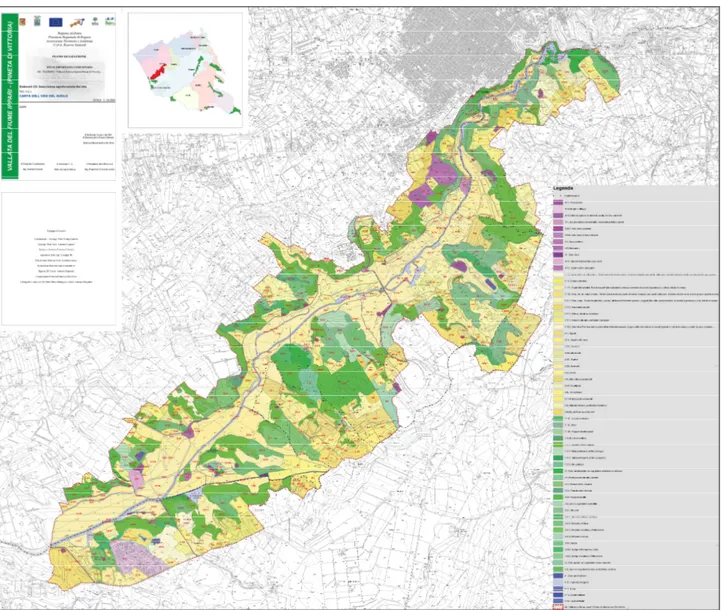
Fig. 2.4.1 – Vegetation map of the study area(from PdG del SIC ITA080003 Vallata del fiume Ippari).
2.5 LAND-USE FRAMEWORK
The whole area is the result of close coexistence between nature and man’s work: in fact, agricultural activities are intense and present since few hundred years ago.
In reference to natural or semi-natural vegetation, those zones covered by forests and semi-natural areas have a total occupancy of around 34% of the total area. The natural areas are therefore characterized by woodlands, garigues and maquis sparse and disconnected with each other; the fragmentation of these areas interrupted in the continuity of their shapes, with extensions of potential habitat often reduced, constitute an element of fragility of the natural system.
In particular, the forested areas (pine, holm oak, willow, poplar) cover an area of approximately 15% of the territory, falling almost entirely in zone A of the reserve and consisting for the main part in Aleppo pine systems.
Areas characterized by shrub vegetation (maquis, scrublands, garigues) or herbaceous (pastures, meadows, dry grasslands) instead compute a covering of about 20%. These habitats are developed mainly by forms of degradation of the forest (e.g. because of fire), or derived from the conquest of space in steep areas due to more or less recent abandonment of land already cultivated.
With regards of agricultural activities, the most common cropping systems are distributed as follow: in the lower valley garden crops in open fields, crops, orchards and vineyards for table grapes, in addition to the omnipresence of reeds Arundo donax; in the surrounding plains carob trees, olive groves and crops as traditional cultures, and citrus groves, vineyards and vegetable crops in lands more recently transformed; on the slopes and on areas that are often leveled and terraced insist
18 greenhouses, vineyards and some canopy tree planting, interspersed with wooded areas, garigues, pastures and fallow. In this context the land use for agriculture has a percentage of total site area more than 50%.
If we analyze in more detail the main crop types for the area in question, is the following: simple arable land (subjected to extensive herbaceous cultivation of cereals, leguminous and vegetable crops in field) have an incidence of approximately 5.2 %; arable simple irrigated land (permanently and periodically irrigated through permanent infrastructure, subjected to intensive herbaceous cultivation of cereals, leguminous, vegetable crops in field) have an incidence of approximately 12.4%; extensive arable wooded land (with the same features of the simple arable land, but characterized by the presence of arboreal plants for an accessory agricultural production) have rates of about 1.3%; intensive wooded arable land have an incidence of approximately 1.4%; garden centres for plants, crops and vegetables have an incidence of approximately 2.3%; vineyards have an incidence of around 3.7%; citrus orchards have an incidence of about 10%; olive groves have an incidence of approximately 5%; cropping systems and complexes particles field have an incidence of approximately 6.4%.
Finally, as regards the urban landscape, houses, towns and villages, farms with associated infrastructure, together occupy about 4% of the territory.
Figure 2.5.1. shows different categories of land-use for the study area.
19
2.6 FAUNAL FRAMEWORK
The wildlife component that characterizes the study area is varied and complex. Following numerous studies have been counted more than 400 different species of vertebrates and invertebrates: Among the mammals are the Oaken mouse (Eliomys quercinus), the Porcupine (Hystrix cristata), the Hare (Lepus corsicanus), the Weasel (Mustela nivalis), the Martens (Martes
martes), the Greater horseshoe bat (Rhinolophus ferrumequinum), the Lesser mouse-eared bat
(Myotis blythii).
The bird class is well represented by the species linked to forest environments such as the Jay (Coracias garrulus), the Pigeon (Columba palumbus), the Serin (Serinus canarius), the Blackbird (Turdus merula). In more open areas is present the Hoopoe (Upupa epops). Have also been reported the Goldfinches (Carduelis carduelis), the Dove (Streptopelia turtur), the Cuckoo (Cuculus
canorus), the Magpie (Pica pica), the Common Moorhen (Gallinula chloropus), the Grey wagtail
(Motacilla cinerea), the White wagtail (Motacilla alba). Among diurne raptors have been reported the Common buzzard (Buteo buteo), the Kestrels (Falco tinnunculus), the Marsh harrier (Circus
aeruginosus); among nocturne raptors is typical the Owl (Strix aluco), which feeds on small
rodents, the Little owl (Athene noctua), the Barn owl (Tyto alba), the Scops owl (Otus scops). Although the coastal marshes have been dried up by drainage, it is often possible to observe in small ponds that form in ground depressions specimens of migratory birds from nearby Africa: the Knight of Italy (Himantopus himantopus), the Gray heron (Ardea cinerea ), the Little egret (Egretta
garzetta), the Mallard (Anas platyrhynchos), the Garganey (Anas querquedula), the Shelduck
(Tadorna tadorna), the Common sandpiper (Tringa glareola), the Kingfisher (Alcedo atthis), the Bee-eater (Merops apiaster).
As representative of reptiles are to report the Leopard snake (Zamenis situla), the Green whip snake (Hierophis viridiflavus), the Grass snake (Natrix natrix) and the Wagler lizard (Podarcis
wagleriana).
Among amphibians is important the presence of Painted frog (Discoglossus pictus).
Among fishes, when the river conditions were definitely in better ecological conditions, were Tench, Eels and South European Toothcarp. At the mouth of the river to fight malaria at the beginning of the century, was introduced Gambusia affinis, a small fish that feed on the larvae of mosquitoes.
Representatives of invertebrate fauna are less garish but nevertheless of considerable ecological and biogeographical interest. All classes of invertebrates are well represented, particularly insects: among Orthoptera is important to indicate the presence of Brachytrupes megacephalus as species of high conservation interest, protected under the “Habitats” CE Directive.
20
21
3 MATERIALS AND METHODS
3.1 SAMPLING METHODThe survey was based on sampling with pit-fall traps. This method, used for many years in researches on ground macro-arthropods, while not being able to provide a complete view of faunal coenosis investigated, has the great advantage of providing comparative qualitative and quantitative data. In addition, the diffusion of its use allows comparisons with the results of a large number of searches.
Within the R.N.O. Pino d’Aleppo were selected 5 researching stations, corresponding to different types of environment: 4 agro-ecosystems (Olive grove, Citrus grove, Arable land with Carob trees, Vineyard) and 1 natural environment (P. halepensis - Q. calliprinos thicket); figure 3.1.1 shows the location of these stations.
Fig. 3.1.1 – Position of researching stations (Bleu: Citrus grove; Green: P. halepensis- Q. calliprinos Thicket; Orange: Olive grove; Brown: Vineyard; Yellow: Arable-land with Carob trees).
For the collection of specimens were used pit-fall traps, consisting of plastic cups with 8.5 cm superior diameter and 11 cm profundity, filled for two-thirds of a saturated aqueous solution of sodium chloride and vinegar, worked into the ground (fig. 3.1.2) and spaced at least 10 meters from each other.
For each station were placed five traps, whose control with removal of material has been conducted about every 30 days.
To evaluate the biocenotic structure of the various stations the total duration of sampling was one year (11 sampling sessions), from June 2009 to June 2010.
22
Fig. 3.1.2 – Pit-fall traps.
With regard to the method of pit-fall traps, it is important to remember that some significant
distortions of the densities estimation of species are linked to the sampling method itself (SABELLA
&ZANETTI, 1991; ZANETTI, 1992):
a) Since catches a function of mobility and amplitude of species movements, small ones are likely to be underestimated compared to those of large size, so the data should be considered in some way related to the biomass of the populations of different species.
b) Species may be attracted or repelled from the trap in different degrees and therefore the method of sampling involves a selection of species. This represents an insurmountable limit.
c) Estimates of the densities of different species can be related very differently to the real populations density.
d) Density estimations of species linked to temporary microhabitats may have very significant changes that do not correspond to real changes in the density of the population.
These considerations lead to remember that, as with any other method of investigation, experimental data deliver us images of communities that are more or less strongly distorted.
3.2 BRIEF DESCRIPTION OF SAMPLING STATIONS
Within the perimeter of the Reserve were thus identified 5 sampling stations, with different geographic and vegetation characteristics. The stations are described below, specifying:
1. Geographical location according to Gauss-Boaga coordinates; 2. Extension of the patch of vegetation types;
3. Mean altitude; 4. Exposure;
5. Type of substrate;
23
Fig. 3.2.1 – Legend for CLC Land-use code (from PdG del SIC ITA080003 Vallata del fiume Ippari).
7. Vegetation typology according to the Corine Biotopes V level code (legend in fig 3.2.2);
Fig. 3.2.2 – Legend for CB Vegetation code (from PdG del SIC ITA080003 Vallata del fiume Ippari).
8. Canopy coverage degree, according the following table (Tab.3.2.1.);
Habitat density Image Description
Canopy 0-25% None or very few canopy trees.
Canopy 26-50% Up to half the quadrant is covered by the
canopy.
Canopy 51-75% Over half the quadrant is covered by the
canopy.
Canopy 76–100% Most of the quadrant is covered by canopy.
Tab. 3.2.1 – Canopy coverage degree classes.
9. Short description of environmental context;
24
STATION OL (OLIVE-GROVE)
Geographical coordinates (Gauss Boaga): x: 2.475.430; y: 4.082.560 Patch extension: 29 ha
Mean altitude: 41 m Exposure: E-NE
Type of substrate: yellow sand, gravel and calcarenite Land-use (Corine Land Cover code): 223 (fig. 3.2.3)
Vegetation typology (Corine Biotopes code): 83.11 (fig. 3.2.3)
Canopy coverage: 26-50%
Short description of the environmental context: Olive groves, together with citrus, represent the
prevalent type of tree cultivation in the area. The patch is part of an environmental mosaic made up of other cultivated land (extensive arable land and tree crops) and areas of maquis or woodland. In general the presence of olive groves, like the carob groves, provides a more harmonious aspect to the agricultural-rural landscape, which better integrates with the more and more scarce natural formations.
Fig. 3.2.3 – Land-use and Vegetation classes for the surrounding area of station Ol (red dot: position of the station). Modality of farming: Traditional conducting; sown with field bean after the olive harvest and milling in the spring.
25
STATION AC:ARABLE-LAND WITH CAROB TREES
Geographical coordinates (Gauss Boaga): x: 2.479.360; y: 4.084.870 Patch extension: 28 ha
Mean altitude: 144 m Exposure: N-NW
Type of substrate: yellow sand, gravel and calcarenite
Land-use (Corine Land Cover code): 2224 (fig. 3.2.4)
Vegetation typology (Corine Biotopes code): 83.13C (fig. 3.2.4) Canopy coverage: 26-50%
Short description of the environmental context: These areas are planted with crops but carob
trees are present, arranged in irregularly spread, which also enrich the landscape aspects of the territory. From the ecological point of view, the fact that the operations of plowing save the immediate vicinity of the trees (in some cases reaching up to 2-3 meters away from the trunk) it is possible to consider these and the portion of the surrounding soil as “islands” where there are still micro-environments suitable for the arthropod fauna and not only: there is for example the possibility of formation of litter from fallen leaves on the ground.
Fig. 3.2.4 – Land-use and Vegetation classes for the surrounding area of station AC (red dot: position of the station) Modality of farming: Annual sown with cereals and milling after harvesting (lack of more precise information).
26
STATION CI (CITRUS-GROVE)
Geographical coordinates (Gauss Boaga): x: 2.473.750; y: 4.082.640 Patch extension: 28 ha
Mean altitude: 12 m
Exposure: S-SE
Type of substrate: clays and river deposition
Land-use (Corine Land Cover code): 2226 (fig. 3.2.5)
Vegetation typology (Corine Biotopes code): 83.16 (fig. 3.2.5) Canopy coverage: 51-75%
Short description of the environmental context: Citrus groves, together with cereal and horticultural crops, characterize the area in object. In particular it is an orange grove near the Ippari river placed in a matrix with a high prevalence of farming.
Fig. 3.2.5 – Land-use and Vegetation classes for the surrounding area of station Ci (red dot: position of the station) Modality of farming: Treatment with organic fertilizer; sown with field bean after orange
harvesting and milling of in the spring. During the months of drought is ensured a supply of water by means of a tubes system almost capillary.
27
STATION VY:VINEYARD
Geographical coordinates (Gauss Boaga): x: 2.479.100; y: 4.085.140 Patch extension: 6 ha
Mean altitude: 131 m
Exposure: W-NW
Type of substrate: yellow sand, gravel and calcarenite Land-use (Corine Land Cover code): 221 (fig. 3.2.6)
Vegetation typology (Corine Biotopes code): 83.21(fig. 3.2.6) Canopy coverage: 26-50%
Short description of the environmental context: The patch is part of a matrix with a medium environmental overall value, which sees the presence of natural maquis and pine forest areas but also agricultural areas with wooded crops and olive groves. With regard to the vineyards in the area is to be highlighted that cultivation in pergola of vines is now giving way to the tents and greenhouse cultivation.
Fig. 3.2.6 – Land-use and Vegetation classes for the surrounding area of station Vy (red dot: position of the station) Modality of farming: Information not available.
28
STATION TK:P. HALEPENSIS –Q. CALLIPRINOS THICKET
Geographical coordinates (Gauss Boaga): x: 2.474620; y: 4.082.890 Patch extension: 25 ha
Mean altitude: 35 m Exposure: N-NE
Type of substrate: yellow sand, gravel and calcarenite Land-use (Corine Land Cover code): 31211 (fig. 3.2.7)
Vegetation typology (Corine Biotopes code): 42.8461 (fig. 3.2.7)
Canopy coverage: 76-100%
Short description of the environmental context: Residue of Aleppo pine forest inserted into an
environmental matrix heavily populated by the presence of cultivated areas (orchards and herbaceous crops) wide and continuous that isolate natural areas now reduced to maquis and scrub. It has to be emphasized that the Aleppo pine formations have been identified in the EC Directive 92/43 “Habitat” such habitats to protect because of their considerable reduction.
29
3.3 METHOD OF DATA STANDARDIZATION
It appeared appropriate and necessary to standardize the results for a uniform comparison between the stations, eliminating the factors of variability represented by the efficiency of traps (number of “active” traps for sampling) and the number of effective days for each sample: is then proceeded to calculate the Density of Activity (DA) (BRANDMAYR et alii 2005) for each family, as the ratio
between the total number of individuals captured during each sampling session and the number of traps found still working, multiplied for the session’s days, everything multiplied by 10; this result has applied an additional correction factor (CF) consisting of the ratio between the total of individuals and the DA, thus obtaining the Standard Capture Density (CSD) (ADORNO 1995)
DA = [nb.ind. / (nb.trap * dd)] * 10 FC = nb.TOT.ind. / DA
CSD = [nb.ind. / (nb.trap * dd)] * 10 * FC
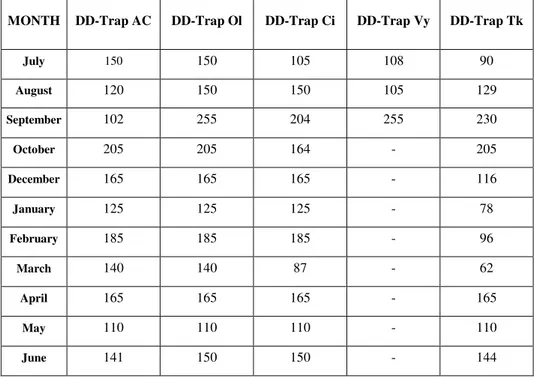
In the table below (tab. 3.3.1) provides an overview of the entire sample relative to the total number of trap-days / sampling session for the various stations.
MONTH DD-Trap AC DD-Trap Ol DD-Trap Ci DD-Trap Vy DD-Trap Tk
July 150 150 105 108 90 August 120 150 150 105 129 September 102 255 204 255 230 October 205 205 164 - 205 December 165 165 165 - 116 January 125 125 125 - 78 February 185 185 185 - 96 March 140 140 87 - 62 April 165 165 165 - 165 May 110 110 110 - 110 June 141 150 150 - 144
30
3.4 METHODS OF EVALUATION FOR THE QUALITY AND QUANTITY COMPARISON
The analysis and comparisons were made both on Coleoptera Families that on the complex of species of Carabidae, Staphylinidae and Tenebrionidae. The indices of diversity and similarity (in MAGURRAN 1988) have been elaborated with the software PRIMER 6.
3.4.1SPECIES RICHNESS AND DIVERSITY INDICES
Margalef’s index (d)
This index measures the richness of taxa (in this case families or species) of the stations, calculated as follows:
d = (S-1)/lnN
where:
S = number of taxa
N = total amount of specimens collected in the station
The reference interval for this index, which considers a medium to good level in terms of richness, is between 2 and 5, where for values below 2 is considered a low diversity.
Shannon’s index (H’)
In order to assess the level of biodiversity of the stations, we used the Shannon index calculated as follows:
where:
s = number of taxa;
pj = Nj / N (relative abundance);
Nj = number of specimens belonging to a certain taxon in the station; N = total amount of specimens in the station.
This is an index that is determined by the number of species and the distribution of their relative abundances in the station. It is strongly influenced by the mean abundances (CHEMINI 1991).
The Shannon’s index assumes the interval between 1 and 3.5 as medium values of biodiversity.
Simpson’s index (D)
For the evaluation of α-diversity was used Simpson’s index, also known as index of species richness, which is often used in conjunction with the previous index. It has been calculated using the following formula:
where:
S = number of taxa;
N = total amount of specimens;
n = number of specimens of a certain taxon. D can assume values comprised between 0 and 1.
31
3.4.2EVENNESS AND DOMINANCE INDICES
Pielou’s index (J)
Evenness was estimated using the Pielou’s index calculated using the following formula:
where:
H’ = Shannon’s index;
S = number of taxa present in the community. In general J varies between 0 and 1.
Simpson’s Dominance index (λ):
Dominance was estimated using the following formula:
λ = ∑Pj
where Pj = Nj/N (relative abundance)
with: Nj = number of specimens of each taxon in the station; N = total amount of specimens in the station.
Te reference interval for that index is between 0 and 1.
3.4.3SIMILARITY INDEX
Sørensen’s index
The Sørensen similarity coefficient is used to measure the level of similarity between two samples. The formula used is as follows:
where:
A = total number of taxa from the first sample; B = total number of taxa from the second sample;
C = number of species in common between the two samples compared.
This is a quality index that considers the number of taxa in relation to the sample; the values vary between 0 and 1.
Bray-Curtis index
The Bray-Curtis index or coefficient of similarity (a semi-quantitative index) estimates the similarity between pairs of samples taking into account not only the presence / absence, but also the abundances of individual taxa. This was calculated using the formula:
BC =
100
2min y
(
ij, y
ik)
i=1 p∑
y
ij+ y
ik(
)
i=1 p∑
where:32 p = total number of taxa
i = taxon
yij = abundance of the taxon (i) in the first sample (j)
yik = abundance of the taxon (i) in the second sample (k).
This index takes the value 0 if the two samples have no taxa in common, and is equal to 100 if the two samples are identical.
3.4.4MULTIVARIATE ANALYSIS OF COMMUNITIES
In order to highlight similarities and differences between the traps and the stations have been used also the multivariate analysis of communities using the methodology of Non-Metric Multidimensional Scaling (NMDS).
This technique is considered by CLARKE &WARWICK (2001), at least from the conceptual point of
view, the easier to apply; it keeps a clear and direct link with the original data. It is also very flexible as it requires no assumptions about the form of the data distribution.
This methodology has been applied both to Families and species of Coleoptera, after a square-root transformation of abundance data of each taxon. The data thus treated were then used to obtain a Bray-Curtis similarity matrix. Referring to that it was possible to construct a series of plots that allow to show the similarities between the various units of sampling (traps and stations). Each point on the graphs represents a single sampling unit, whose position is determined by all the taxa and the number of specimens collected for each of them.
In this way, homogeneous groups can be observed between the sampling units. Since the graphs projected a multidimensional space in two-dimensions or three-dimensions, the technique provides a measure of “stress” or the “forcing” of the plot. CLARKE & WARWICK (2001) suggest not to
consider plots with stress values higher than 0,18 as being unrepresentative.
This sorting technique has been associated with a specific test, ANalysis Of Similarity (ANOSIM), which provides a measure of the significance of differences between the groups identified a priori (CLARKE & WARWICK 2001) The test results is a value, called R, which reflects the difference
observed between the distances of the points belonging to each of the groups compared, with respect to the distance of the points belonging to other groups:
R = rb-rw/1/4 [n (n-1)]
where:
rb= mean diversity within the group;
rw= mean diversity with the other groups;
n= total number of sample units.
The value of R (R observed) can vary between -1 and 1 and assumes the value 0 when the null hypothesis (H0: no difference between the sampling units) is true, and takes the value 1 when all
replies of a certain sampling unit are more similar together than to all other replicas of the sampling units. Values less than zero, represent the opposite case.
The ANOSIM test, using a predetermined number of times, recalculates the value of R randomly permuting membership group of each replication. In this way it is obtained a distribution of R simulated with which to compare the value of R observed.
The null hypothesis is rejected when R observed falls outside the distribution of the R simulated: the higher the R observed value is away from that of R simulated values, the more likely that the clusters on the plot of the representations are not random.
Together with the calculation of R is produced an estimation of the significance that allows to evaluate the possibility of making a mistake in interpreting R.
It was also estimated the statistical significance of differences between stations using the Parwise tests, based on the value of R observed between pairs of stations.