11 June 2021
Picascia, S., Romano, A., & Teobaldi, M. (2017). THE AIRIFICATION OF CITIES. MAKING SENSE OF THE IMPACT OF PEER TO PEER SHORT TERM LETTING ON URBAN FUNCTIONS AND ECONOMY. In Proceedings of the Annual Congress of the Association of European Schools of Planning (pp.2212-2223).
This is the peer reviewd version of the followng article:
Terms of use: Open Access
(Article begins on next page)
The terms and conditions for the reuse of this version of the manuscript are specified in the publishing policy. Works made available under a Creative Commons license can be used according to the terms and conditions of said license. For all terms of use and more information see the publisher's website.
Availability:
This version is available http://hdl.handle.net/11365/1018294 since 2017-11-03T10:18:03Z Original:
The airification of cities
1:
making sense of the impact of peer to peer short term letting on urban functions and economy
Stefano Picascia, Antonello Romano and Michela Teobaldi
21
INTRODUCTION
The emerging sharing economy is an extremely interesting phenomenon in the context of major cities, impacting them on several dimensions, ranging from social to economic, from cultural to environmental. “The sharing economy is an emerging economic-technological phenomenon that is fueled by developments in information and communications technology (ICT), growing consumer awareness, proliferation of collaborative web communities as well as social commerce/sharing” (Botsman & Rogers, 2010), (Kaplan & Haenlein, 2010), (Wang & Zhang, 2012), (Hamari et al., 2015). The concept of sharing economy is very simple: it allows to rent out anything that is under-utilized or not used at all. The contact between supplier and customer is established through an online platform. Sharing economy platforms, in the last few years, have become very popular and changed our consumption patterns (Quattrone et al., 2016). On the one side, suppliers can short-term rent their goods (or services); on the other side, consumers can rent goods or services at a lower cost than a traditional provider (Zervas and Proserpio, 2014). Airbnb, a peer-to-peer accommodation website, is one of the most successful sharing economy platforms. Airbnb is a platform where people can offer for short term, discover and book houses all over the world, from a pc or smartphones and tablets. The company was founded in 2008 and by now (May 2017) it lists over 3 million properties in over 191 countries, over 65.000 cities, accommodating 150 millions of guests. Spaces rented on Airbnb vary from a couch in someone’s living room to an entire island (Wortham, 2011), but generally there are few typologies of accommodation: private or shared room and entire houses. The host may live in the property at the time of the rental or not. Airbnb claims that 57% of listings are entire apartments or homes, 41% are private rooms and 2% are shared rooms (Guttentag, 2015). Airbnb has been adopted on a massive scale worldwide and also in Italy: in 2015 the country had the third largest number of Airbnb listings in the world, with 83.000 hosts and 3.6 millions of visits per year, according to data published by Airbnb Italia. A press event in Rome (2016) saw the participation of the Italian minister of Culture who spoke with great enthusiasm of the affordances of the platform and the great benefits that it supposedly brings to urban economy. Nevertheless, in typical Italian fashion, there has been very little debate over the long term consequences of a relatively new phenomenon, especially one associated with novelty, enterpreneurialism and “new” technologies, and the only intervention that the government has deemed necessary has been that of imposing a tax on homes rented through the platform. However 1 Cite as: Picascia, S., Romano, A. and Teobaldi, M. (2017), The airification of cities: making sense of the impact
of peer to peer short term letting on urban functions and economy, Proceedings of the Annual Congress of the Association
of European Schools of Planning, Lisbon 11-14 July 2017
2 LADEST – University of Siena, via Mattioli 10, Siena, Italy {stefano.picascia,antonello.romano}@unisi.it; [email protected]
questions about the impact of an upsurge of short term rentals (‘STR’ onwards) over the delicate environment of Italian historical urban centres, as an example, have hardly been asked. Italians also seem to be ignoring the controversy that Airbnb’s fast rise has generated around the world, with accusations of driving up rents, depleting the residential housing market and, as is the case in Barcelona, turning entire neighbourhoods into 24h party zones, to the bewilderment of residents. Currently, in Florence and Venice just like in Barcelona, the risk to turn the historic centres into “cathedrals of consumption” where what had been grown naturally is replaced with a superficial and tourist-oriented veneer (Thani and Heenan, 2016) – is a very present one. The consequence of this process might be, at best, the loss of authenticity of such places (Zukin, 2009). In this context, the present contribution provides a more in-depth insight on the mechanics of Airbnb in Italy, focusing on two dimensions of the phenomenon, related to (1) the spatial distribution of STRs; (2) the economic impact of Airbnb on city centres and residential rents. After a brief recollection of the academic production on Airbnb (section 2), we describe our data and method of analysis (section 3); in Section 4 we present the spatial patterns of Airbnb supply and demand across 13 towns and cities in Italy, focusing on three archetypical patterns; we then hypothesize on the possible drivers of the Airbnb offer and suggest a possible way to assess whether Airbnb supply could be driven by an economic advantage of STR over long term letting (Section 5). In Section 6 we discuss the way the benefits of the sharing economy are… shared. Finally, we conclude by presenting a possible alternative way of regulating Airbnb.
2
RELATED WORK
While the topic of the sharing economy in general is widely analysed, the phenomenon of Airbnb in particular, despite having arisen interest in recent times, hasn’t been investigating so much. It has been noted that legal issues are the most examined, for example Quattrone et al. (2016) focus on the regulation of Airbnb. They notice that the platform is either completely allowed or totally banned by municipalities, underlining the lack of regulations in any case. The authors suggest possible innovative policies that the city of London could implement, based on a stringent analysis of spatial and economic patterns of accommodation supply and demand. Similar focus is provided by Lee (2016) who employs legal and statistical analysis to explore how short term rental affects the price and the supply of housing rental in Los Angeles, and how municipalities and policy makers could regulate the phenomenon. Furthermore Guttentag (2016) examines the rise of Airbnb through the lens of disruptive innovation theory and investigates, again, certain regulatory issues related to Airbnb, considering the current tax flow and possible interventions. He also analyses the potential of Airbnb to disrupt the residential accommodation sector, and the impacts - both positive and negative - that Airbnb may have on cities. McNamara (2015) examined the same topic: she first analyses the development of the community marketplace and the perception of Airbnb within society, afterwards she concentrates on regulatory issues that Airbnb arises, how proponents and critics react to them, and advances some proposals to regulate the platform. A different outlook is provided by Edelman et al. (2014). They examine a diverse aspect of Airbnb, racial discrimination among landlords. The authors confronted a large dataset of pictures of all New York City hosts on Airbnb with the corresponding prices and user feedback. They found out that non-black hosts are able to charge about 12% more than black ones for comparable properties, highlighting the existence of a form of racial discrimination in online marketplaces.
In the context of hospitality Zervas et al. (2015) focused on Airbnb as a touristic phenomenon. They analysed the ratings of over 600.000 properties listed on Airbnb worldwide and compared them with the ratings of about half a million hotels listed on Tripadvisor. Ikkala et al. (2015) explore Airbnb presenting a qualitative study of hospitality. They consider the motivation of hosts to monetize network hospitality. They found out that hosts are motivated to monetize network hospitality both for economic advantage and social interaction. The authors discuss the implications of their findings on the fields of social network analysis and sharing economy. Another study on hospitality (Zervas et al., 2014) focuses on the impact of Airbnb on the hospitality industry in the state of Texas. The authors collected all Airbnb listings in Texas and information on all Texas hotels to estimate the impact of Airbnb on hotel revenues. They found out that such impact is distributed unevenly across the industry, but generally lower-end hotels are those most affected. Finally, they simulated certain regulatory interventions, such as limiting Airbnb hosts to one single listing, and argued that this intervention alone would greatly reduce Airbnb’s impact on hotel revenues. Yannopoulus et al. (2013) use a different approach, examining brand identity construction of user-generated brands (UGBs) through a visual analysis. They explore Airbnb and Couchsurfing to underline the peculiarities of identity construction and visual representation of UGBs. They found authenticity, access to the private sphere, a more human dimension, and meaningful inter-personal discourses, to be the distinctive features of UGBs. Dudas G., et al. (2017) use additional indicators (distance, attractiveness) and a 3-band raster layer visualisation method to map the spatiality of Airbnb in Budapest. Celata e. al. (2016) offer a comparative analysis of the main sharing platforms in the accommodation domain, looking at the relationship between trust, reciprocity and belonging across different sharing economy platforms. The rise of Airbnb has recently started generating some interest in the field of urban planning. Gurran and Phibbs (2017) looked at the impact of Airbnb in Australian cities and the implications for the local housing markets.
These works do an excellent job in defining diverse critical aspects of the phenomenon of Airbnb, some of them do also concentrate on the spatial distribution of the phenomenon and the economic impact of Airbnb. There have been no systematic investigations of the impact of Airbnb in Italy, we believe data from this platform can be extremely useful to explore dynamics related to the changes of Italian city centres.
3
METHODOLOGY AND DATA SOURCES
The data employed in this investigation were obtained scraping the Airbnb website at two different points in time
in 2016 and 2017. We implemented a crawler3 and collected all the listings existing on the website in the second weeks of
February 2016 and February 2017 relative to 13 Italian cities (Bari, Bologna, Catania, Firenze, Genova, Matera, Milano, Napoli, Roma, Siena, Torino, Venezia, Verona). Specifically, for each property listed in the considered cities, we collected the data resumed in the table below.
3 The crawler was based on code released online in 2014 by Tom Slee (http://tomslee.com) and Murray Cox (http://insideairbnb.com)
Table 1 - Data collected for each Airbnb listing Code Description
uid host id
ppn price per night bd number of bedrooms
r2015 number of reviews posted in the year 2015 r2016 number of reviews posted in the year 2016
lat latitude
lon longitude
We estimated the gross revenues (R) generated in 2015 and 2016 by each listing according to the formula
Ry=(ry∗1.30)∗ppn∗3
(with y=2015 or 2016). We adjust the estimation assuming a 30% of stays without acorresponding review (as Airbnb itself seems to maintain4) and an average stay of three nights (following the approach of
insideAirbnb.com). For entries listing an entire apartment/house we also estimated the size in square meters of the property offered according to the mapping in Table 2.
Table 2 – Estimation of property size based on listed number of bedrooms
bd 0 1 2 3 4 5 >5
size in m2 35 50 65 80 95 120 180
To the purpose of comparing the STR market with the regular long term rental market we obtained official data on average rental prices from the Italian Revenues Agency (Agenzia delle Entrate). The dataset made available to us includes the average monthly price paid per square metre in each “OMI Area” of the Country. OMI Areas are defined as areas with homogeneous market conditions, with larger cities generally being subdivided in at least 50 OMIs. OMI Data allow us to compare revenues generated via STR with the revenues that the same property would generate if offered on the long-term market. We discuss our results in Section 5. Finally, data from the 2011 Census (ISTAT, 2011) were employed to account for resident population changes and number of individual dwellings existing in each census area of the cities considered (housing stock). In the following we try to analyse the dynamics of supply and demand of Airbnb accommodation. We consider the number of reviews that a property has received as the most immediate indicator of the demand for that property. Similarly, we group listings and the corresponding reviews geographically, to assess the areas in cities that are high and low in demand.
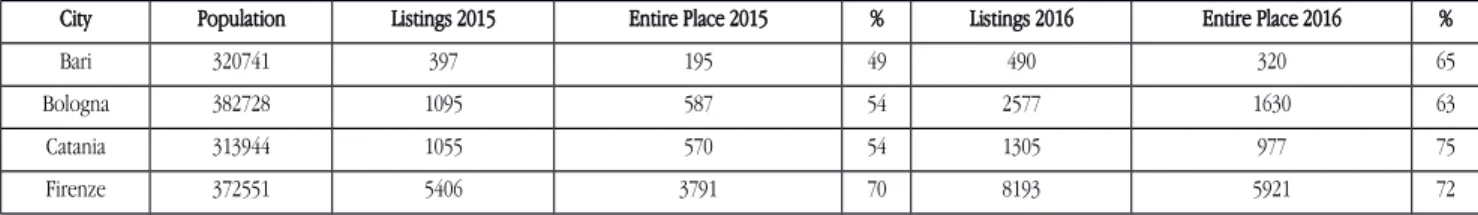
Table 3: Airbnb listings by city 2015 – 2016.
City Population Listings 2015 Entire Place 2015 % Listings 2016 Entire Place 2016 %
Bari 320741 397 195 49 490 320 65
Bologna 382728 1095 587 54 2577 1630 63
Catania 313944 1055 570 54 1305 977 75
Firenze 372551 5406 3791 70 8193 5921 72
Genova 596206 852 442 52 1039 704 68 Matera 62334 373 198 53 415 331 80 Milano 1262447 9491 6178 65 13159 9074 69 Napoli 1011955 1271 681 54 4058 2300 57 Roma 2668729 15044 9270 62 21687 13422 62 Siena 59593 482 255 53 600 447 75 Torino 894365 1160 653 56 3202 2276 71 Venezia 272443 3186 2466 77 5637 4168 74 Verona 267216 1018 612 60 1531 1209 79
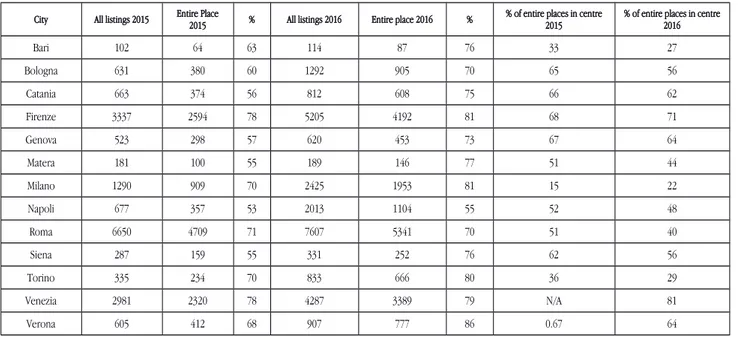
Table 4: All listings and entire places in historic centres. The last two columns show the proportion of all “entire places” listed in historic centres.
City All listings 2015 Entire Place2015 % All listings 2016 Entire place 2016 % % of entire places in centre2015 % of entire places in centre2016
Bari 102 64 63 114 87 76 33 27 Bologna 631 380 60 1292 905 70 65 56 Catania 663 374 56 812 608 75 66 62 Firenze 3337 2594 78 5205 4192 81 68 71 Genova 523 298 57 620 453 73 67 64 Matera 181 100 55 189 146 77 51 44 Milano 1290 909 70 2425 1953 81 15 22 Napoli 677 357 53 2013 1104 55 52 48 Roma 6650 4709 71 7607 5341 70 51 40 Siena 287 159 55 331 252 76 62 56 Torino 335 234 70 833 666 80 36 29 Venezia 2981 2320 78 4287 3389 79 N/A 81 Verona 605 412 68 907 777 86 0.67 64
Table 5: Proportion of the housing stock in historic centres listed on Airbnb as “entire place” in 2015 and 2016
City % Housing stock 2015 % Housing stock 2016 Variation 2015-2016
Bari 0.80% 1.00% 25.0% Bologna 1.00% 2.40% 140.0% Catania 1.40% 2.20% 57.1% Firenze 11.10% 17.90% 61.3% Genova 0.60% 1.00% 66.7% Matera 17.30% 25.30% 46.2% Milano 1.70% 3.60% 111.8% Napoli 1.00% 3.10% 210.0% Roma 7.10% 8.00% 12.7% Siena 2.50% 4.00% 60.0% Torino 1.00% 2.80% 180.0% Venezia 6.10% 8.90% 45.9% Verona 2.20% 4.10% 86.4%
4
SPATIAL DYNAMICS OF SUPPLY AND DEMAND: THE AIRIFICATION OF HISTORICAL CENTRES
The three tables above (Tables 3,4,5) summarise the data that we gathered. Confronting year 2015 and 2016 some considerations can be drawn:
The absolute majority of Airbnb listings consists of entire homes/apartments, over private and shared rooms. This is
true for all the cities considered, regardless of size and number of listings (Table 1).
This trend seems to be reinforcing over the years, as more entire properties have been listed in 2016 than 2015: the
proportion of entire homes over the total number of listings increases in all cities (Table 2).
Within historical cores (Table 2) the trend is even more pronounced: the proportion of entire homes over the total
number of listings is higher in the centres than elsewhere in all the cities considered. This proportion increased further between 2015 and 2016.
The proportion of entire places listed in historical cores vs. the total number of entire places is decreasing in many
cities. This signals that the Airbnb habit is spreading to areas of towns and cities other than historic centres (last two columns of Table 2).
The proportion of the housing stock devoted to STR in historic centres is increasing and, in some places, has
reached levels unseen in the world: 18% in Florence, 25% in Matera, 8% in the vast historical core of Rome (Table 3).
In most cities considered, the supply of Airbnb accommodation is concentrated in or around the historical cores. This is understandable, as most attractions in Italian cities are of historical and artistic nature, and tend to be concentrated in the centre. However, the scale of STR concentration in historic centres is, to the best of our knowledge, unmatched in the world.
A 7% of all housing units in districts such as Venice Beach and Abbott-Kinney Boulevard in Los Angeles listed on Airbnb rose
alarms among the local authorities5 . This number is more than doubled in places like Florence (18%), while in cities such as
Rome and Venice Airbnb accounts for more than 8% of all housing units of their historic centres. A staggering one in four homes in the Sassi area, the historic core of Matera, Italian city of culture 2019, are offered on Airbnb.
This particularly high number is very significant, especially in relation to a multi-decade old phenomenon that researchers have pointed out – the touristization and social desertification of Italian historical centres. Population has been lost, and city residents increasingly tend to perceive these areas with a certain detachment, as no longer belonging to their daily experience of the city (Rossi, 2003). This is a phenomenon that pre-dates Airbnb by far, but the availability of Airbnb data allows us to effectively visualize part of the dynamics at play. The three larger cities frequently recurring in the touristization discourse - Florence, Venice, Rome – all have a proportion of their centres’ housing stock on Airbnb above 8%. This figure could be considered a sort of canary value for the disneyfication (Dennett and Song, 2016) of the centre. Cities approaching it should seriously reflect on whether touristization and disneyfication are desirable conditions for their historical centre. However, the data show that not everywhere Airbnb accommodation is predominant towards the historical cores. On the
contrary, the distribution of the Airbnb offer and demand is fairly variable among cities. Figures below show the distribution
of offer and demand in Florence, Rome and Milan, exemplifying three recurring patterns.
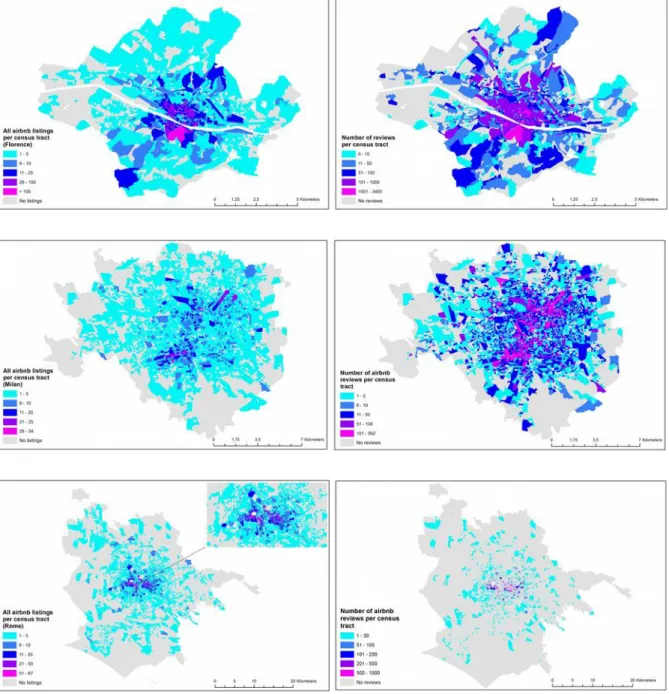
Fig. 1
–
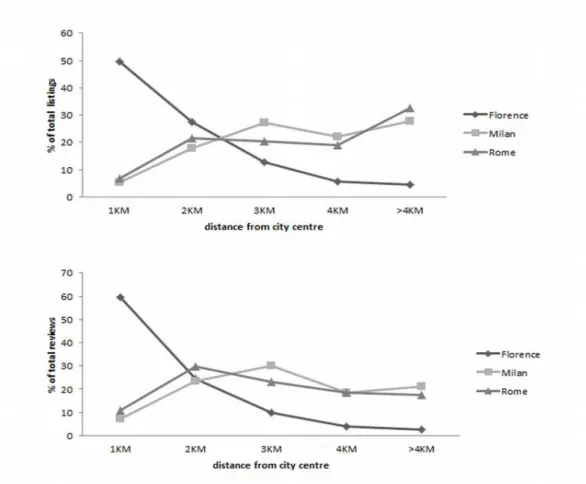
Distribution of offer (left) and demand (right) in Florence (top), Milan (middle), and Rome (2016).Florence epitomizes the typical art city with an enormous concentration of the offer of STRs within the medieval walls of the historic centre, where 63.5% of the total listings are located (2016). As mentioned, 18% of entire housing stock of the city centre of Florence is listed on Airbnb (as entire homes) and the proportion has been increasing steadily over the last years. On the demand side, however, the figure shows that the listings outside of the historical centre are also capable of attracting
a certain demand, likely thanks to the reduced prices, which we discuss further. In Florence (Fig.2)both offer and demand
decay in parallel as a function of the distance from the town centre (identified with the location of the Town Hall);
Milan displays an entirely different pattern, with a much more sprawling distribution of Airbnb properties. Here the STR phenomenon started outside of the historical centre: the fashionable districts of Isola and Navigli have been the areas with
the highest concentration of Airbnb listings. In this regard Milan is more remindful of European capitals like London and Berlin, with recognizable and attractive districts outside of the centre. Despite an 88% increase in the offering of entire homes in 2016 vs. 2015, the old centre is still relatively blank compared to the neighbouring districts. Note how the historic centre of Milan is represented as a sort of depression in the Airbnbscapes diagram (Figure 3).
Rome shows a pattern with elements of both Florence and Milan. In the Capital most of the offering is concentrated in the central Municipio I - which includes most of the great archaeological sites and the historic districts of Monti, Trastevere, Testaccio. Here the Airbnb offering of entire homes accounts for 8% of the entire housing stock, but Rome also shows hot spots outside of the centre: in proximity to the Vatican, in the student district of San Lorenzo, east of the central railway station, and in the residential district of San Giovanni, immediately to the south of the centre.
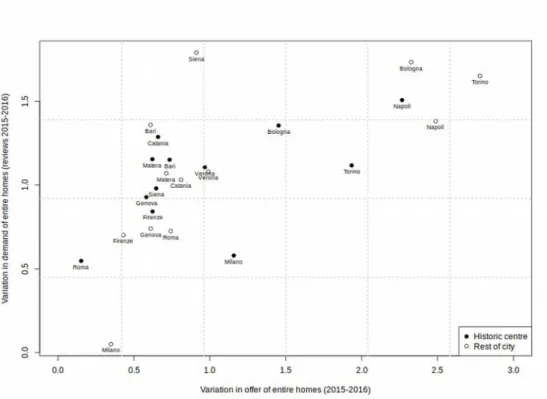
An interesting trend that our data show is that, in the last couple of years, the phenomenon of renting out entire homes on Airbnb is extending far beyond historical centres. Between 2015 and 2016 the number of homes on offer outside of historical cores has increased faster than that within historical cores. In most cities this increase in offer seems to have met some demand: we plotted the variations in offer and demand between 2015 and 2016 within and without historical centres (Figure 4). While in cities like Rome and Naples the centre keeps being more attractive, producing a higher number of new reviews for every home added, there are places, like Siena, where an increase in the offer of accommodation outside of the central core generates an increase in demand disproportionally higher.
5
DRIVERS OF AIRBNB SUPPLY
Critics of Airbnb often point out that the readily available opportunity of offering a property on the the STR market, often tax-free, has the extremely unpleasant side effect of depriving the long term rental market. A hotelization effect seems to be at play in several cities across the world (Lee, 2016). We asked ourselves whether our data would support such claim for the cities in our study.
What are, in other words, the drivers of Airbnb provision? We obviously looked into tourism, but we also asked ourselves whether landlords offering their property on Airbnb and not on the long term rental market may be driven by economic considerations.
5.1
TOURISM
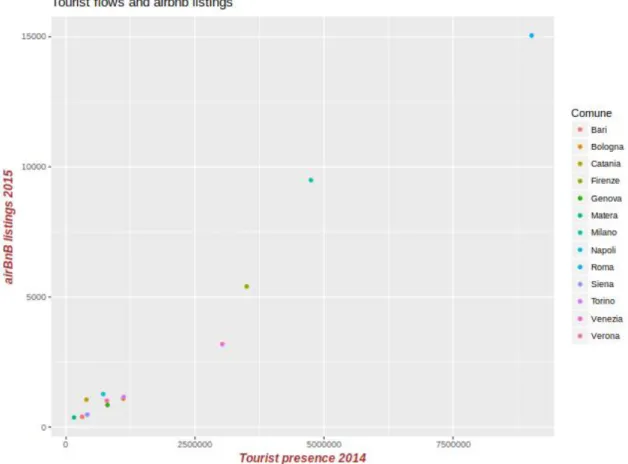
The offer of Airbnb accommodation across the studied cities correlates almost perfectly ( r=0.95 , Figure 5) with
tourist presence in the same cities. Tourist flows seems to be the best single predictor of the volume of Airbnb offering across cities.
.
Fig 3. – Density of Airbnb listings (2016)
Fig. 5 – Tourist flows and Airbnb listings
Fig. 6 – Airbnb index 2015 plotted against the 2015-2016 variation in the proportion of the housing stock listed on Airbnb (historic centres only). There is an almost perfect correlation, bar two outliers, Bari and Genoa.
Apart from the somewhat obvious relationship with tourist flows, we were interested in exploring whether the dynamics of the Airbnb offering could be explained in terms of the economic advantage that STR may enjoy over regular long term rental contracts. This is a crucial point, since the risk of tourist rentals depleting the housing market is a very realistic one, often very high in the agenda of local administrations across the world.
To assess whether the provision of entire homes on Airbnb could be, at least partially, driven by the economic advantage over normal rent we estimated the revenue that each home listed on Airbnb would generate if offered on the regular long-term rental market. Such estimation was performed on the basis of rental market data described in Section 3. The ratio
between Airbnb revenues (the estimated revenues of every entire home offered in a given area,
pN
) and the estimatedlong term rental revenues ( RH - derived estimating the size of a property according to the mapping in Section 3) forms
the basis of an “Airbnb index” that we produced. The index also incudes a value proxying for the saturation of the offer and
one for that of the demand: we considered the number of listings not receiving any review in the year ( E ) as a good
indicator of the lack of demand in a certain area, whereas the density ( d ) of listings per square km counts as an indicator
of saturation in the offer. The resulting index
i=
pN
RH
÷ E ÷ d
is normalized in the 0-1 interval. Its correlation with theincrease in the proportion of the housing stock of historical centres listed on Airbnb is shown in Figure 6. The correlation is
quite high (although not as high as that with tourism),
r=0.73
, meaning that where the index relative to the previousyear is higher, the increase in homes devoted to STR in the next period is also higher. Two strong outliers are there, Genoa and Bari. Without them the r jumps to 0.97, matching almost perfectly. This result leads us to believe that the factors considered - an economic advantage versus long term letting, the density of existing listings, and the existence of some demand in the previous period - are good predictors of the number of new listings that we can expect in a given area. Ideally, the index could also serve as the basis to forecast the possible evolution of the system. The cities with the highest index for year 2016 are Bari and, at a distance, Siena and Genoa. For year 2017 we would expect a great increase in the proportion of the housing stock ending up on Airbnb in the centres of these cities, since the conditions seem to be there for further expansion.
6
THE INEQUALITY OF AIRBNB
Somewhat contrarily to the rhetoric generally attached to the notion of "sharing", we found the Airbnb ecosystem to be a profoundly unequal one. In terms of income generated on the platform, the inequalities are twofold: an "inequality proper" between hosts, and a spatial inequality between centre and periphery of cities.
6.1
INCOME INEQUALITY BETWEEN HOSTS
Since its inception Airbnb has seen a profound change in the nature and demographic of participants. The original intended audience of young people renting out a spare room in their flats is long gone as the main income generator for the platform. As we have shown, as of today, entire flats make up, by a good margin, the majority of listings in all the cities considered. At the same time, among those who list entire homes for STR, hosts listing multiple properties seem to have increased substantially. We looked at how incomes from Airbnb are spread across the thousands of hosts that list entire homes on the website, suspecting that revenues wouldn’t be shared in a particularly inclusive way between participants.
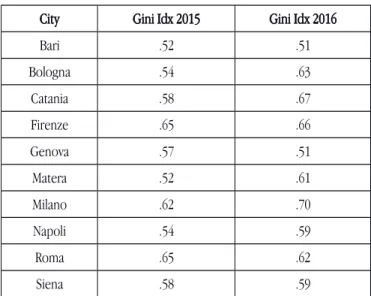
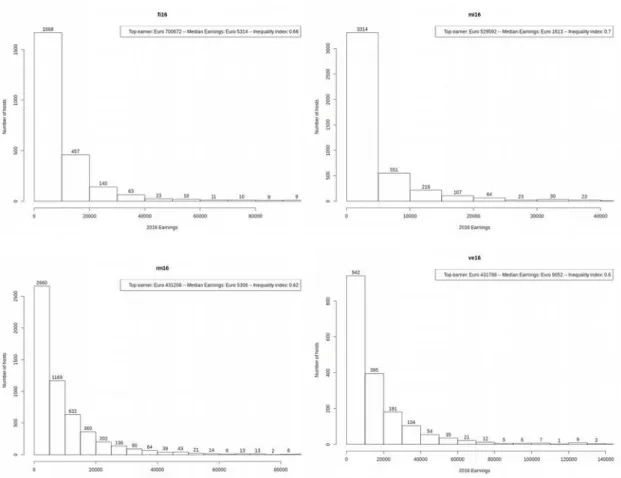
Table 6 shows the inequality of the distribution of Airbnb revenues for the 13 cities considered, in the form of the Gini index, a commonly used measure of inequality. Figure 7 plots the distribution of Airbnb revenues among hosts in four of the considered cities. Inequality is extremely high in all the cities, and has increased between 2015 and 2016 in ten of the thirteen cities examined. In most cities a handful of operators listing several properties are capable of amassing more than two thirds of the total revenues generated on the website. To what extent this phenomenon is due to businesses operating as agencies listing third-party properties for STR should probably be the subject of further investigation. However, for comparison, we note that the inequality (Gini) index of Airbnb revenues in all the cities considered – ranging from 51 in Genoa and Bari and 70 in Milan - substantially exceeds the nationwide Gini income inequality index (36). This suggests that the supposed benefits of the platforms are appropriated very disproportionately by a small number of users.
6.2
SPATIAL INCOME INEQUALITY
If revenues differ substantially among hosts, they also differ widely among different areas of the same city. Figure 8 below shows how the average earnings from a property listed on Airbnb decays as the distance from the centre of town increases. This dynamic is consistent with that highlighted in other countries: Gibbs et al. (2017) note that each additional five kilometers away from City Hall were associated with price decreases ranging from 4.0% (Ottawa) to 20.7% (Montreal). Our analysis confirms the function of distance to centrality (we also measured distances from the City Hall) in the tree cities observed. This confirms that a disproportionally high share of Airbnb earnings flows towards the central areas of cities.
Table 6. – Inequality index of Airbnb revenues between hosts.
City Gini Idx 2015 Gini Idx 2016
Bari .52 .51 Bologna .54 .63 Catania .58 .67 Firenze .65 .66 Genova .57 .51 Matera .52 .61 Milano .62 .70 Napoli .54 .59 Roma .65 .62 Siena .58 .59
Torino .54 .61
Venezia .57 .60
Verona .54 .57
Fig. 7 - Distribution of Airbnb revenues between hosts, 2016. Florence (top left); Milan (top right); Rome (bottom left); Venice.
Fig. 8 – Average Airbnb revenues by distance from the centre of town in Florence, Milan and Rome. Note how earnings in the centre are substantially higher than elsewhere.
7
CONCLUSIONS: REGULATING SHORT TERM RENTALS
As other “sharing economy” platforms such as Uber, Airbnb has spread unchecked and unregulated for almost ten years. Protests and criticism arose around the world, especially on the part of residents and businesses in the hospitality industry, the latter accusing Airbnb of unfair competition. The Italian Government has ignored the matter for most of the decade, deciding to intervene and “regulate” online accommodation platforms only in 2017, when Italy had already become the country with one of the highest numbers of Airbnb listings in the world. A flat rate tax of 21%, operational from 1 June 2017, was introduced on all rentals of less than 30 days. It is interesting that, in the view of Italian policymakers, the need to
regulate a phenomenon often instinctively translates into the mere taxing of that phenomenon; more often than not, with a
flat-rate tax. What outcomes is a 21% flat-rate tax going to have on a phenomenon that we have shown to be extremely complex and unequal? In our view, it is safe to assume that hosts in the long tail – the many collecting a very small share of Airbnb revenues – will be disproportionally affected. The same is true of hosts listing properties outside of the very profitable historic centres. The risk of such taxation, then, is, on the one hand, of favouring the growing hotelization of historic centres, where the profitability of staying on Airbnb would persist, even after the tax. On the other hand, it could further increase inequality, because many small hosts with only one listing could withdraw from the platform, not finding it advantageous enough to stay. The net result would be an even more unequal system, with an even higher concentration of the offer towards the delicate and already compromised environment of the historic centres. We believe that a less short sighted intervention could have exploited the opportunities offered by Airbnb to the benefit of local economies, instead of simply penalising those that participate. Quattrone et al. (2016), for instance, suggest a dynamic, data-driven attribution of “sharing rights” to hosts, based on the saturation of different areas of a city. In section 5 we showed that the offer of Airbnb accommodation, to a certain extent, generates its own demand. A city administration, therefore, could decide to encourage the provision of Airbnb accommodation in areas less popular and saturated – with a different tax regime, or with variable restrictions in licensing - driving tourists to those areas, thus benefiting local neighbourhood economies, instead of overcrowding the “usual suspect” areas: historic centres.
BIBLIOGRAPHIC REFERENCES
Botsman, R., & Rogers, R. (2010). What’s mine is yours. The rise of collaborative consumption.
Celata, F., Hendrickson, C. Y., & Sanna, V. S. (2017). The sharing economy as community marketplace? Trust, reciprocity and belonging in peer-to-peer accommodation platforms. Cambridge Journal of Regions, Economy and Society.
Dennett, Adam and Song, Hanqun (2016) Why tourists thirst for authenticity – and how they can find it. The Conversation. ISSN 2044-5032
Dudás, G., Boros, L., Kovalcsik, T., & Kovalcsik, B. (2017). The visualisation of the spatiality of Airbnb in Budapest using 3-band raster represeantation. Geographia Technica, 12(1), 23-30.
Edelman, B. G., & Luca, M. (2014). Digital discrimination: The case of Airbnb. com.
Gibbs, C., Guttentag, D., Gretzel, U., Morton, J., & Goodwill, A. (2017). Pricing in the sharing economy: a hedonic pricing model applied to Airbnb listings. Journal of Travel & Tourism Marketing, 1-11.
Gurran N and Phibbs P (2017), How Should Urban Planners Respond to Airbnb?, Journal of the American Planning
Association, Vol. 83, No. 1
Guttentag, D. (2015). Airbnb: disruptive innovation and the rise of an informal tourism accommodation sector. Current issues in Tourism, 18(12), 1192-1217.
Hamari, J., Sjöklint, M., & Ukkonen, A. (2015). The sharing economy: Why people participate in collaborative consumption. Journal of the Association for Information Science and Technology.
Ikkala, T., & Lampinen, A. (2015, February). Monetizing network hospitality: Hospitality and sociability in the context of Airbnb. In Proceedings of the 18th ACM conference on computer supported cooperative work & social computing (pp. 1033-1044). ACM.
Istituto Nazionale di Statistica, XV Censimento generale della popolazione e delle abitazioni, Roma 2011
Yannopoulou, N., Moufahim, M., & Bian, X. (2013). User-generated brands and social media: Couchsurfing and Airbnb. Contemporary Management Research, 9(1), 85.
Lee, D. (2016). How Airbnb Short-Term Rentals Exacerbate Los Angeles's Affordable Housing Crisis: Analysis and Policy Recommendations. Harvard Law and Policy Review, 10, 229.
McNamara, B. (2015). Airbnb: a not-so-safe resting place. J. on Telecomm. & High Tech. L., 13, 149.
Quattrone, G., Proserpio, D., Quercia, D., Capra, L., & Musolesi, M. (2016). Who Benefits from the Sharing Economy of Airbnb?. In Proceedings of the 25th International Conference on World Wide Web (pp. 1385-1394). International World Wide Web Conferences Steering Committee.
Rossi, U (2003). La città molteplice: il processo di cambiamento urbano nel centro storico di Napoli, Archivio di studi urbani
e regionali, n.77.
Thani, S., & Heenan, T. (2016). The ball may be round but football is becoming increasingly Arabic: oil money and the rise of the new football order. Soccer & Society, 1-15.
Kaplan, A. M., & Haenlein, M. (2010). Users of the world, unite! The challenges and opportunities of Social Media. Business horizons, 53(1), 59-68.
Zervas, G., Proserpio, D., & Byers, J. W. (2014). The rise of the sharing economy: Estimating the impact of Airbnb on the hotel industry. Journal of Marketing Research.
Wortham, J. (2011, July 25). Room to rent, via the web. The New York Times. Retrieved from
http://www.nytimes.com/2011/07/25/technology/matching-travelers-with-rooms-via-the-web.html