The economic resources that would be necessary to obtain a significant reduction of the seismic risk in the whole Italian country are considerably greater than the ones that can be made available in the short term. Thus, a satisfactory prevention plan can only be developed in a very long time (at least several decades). However, one must be aware that the effectiveness of such oper-ation will strongly depend on how the resources are gradually distributed in space and time over the Italian territory. If, for instance, each annual contribution were homogeneously distributed all over the Italian seismic zones, the reduction of seismic risk achieved in each single zone would be very poor for a long period. Al-ternatively, one could initially concentrate the available resources in limited zones where the interventions may be considered more urgent. For instance, this kind of choice has been adopted for distributing some funds in the aftermath of the 2009, L’Aquila earthquake (Legge 24 Giugno 2009, n. 77). In that case, it was decided to privileging the zones where the seismic hazard pro-vided by the current probabilistic maps [1,2] is highest. The result of such choice is reported in Table 1, where it is possible to see that some regions (the ones hit by the strongest historical earthquakes: Calabria, Campa-nia, and Sicilia) have been assigned much more (up to about 20 times) funds with respect to the other regions. However, in our opinion, the above criterion is ques-tionable, since the fact that a given zone experienced major historical shocks does not imply that prevention
in such zone is more urgent than in other zones. For in-stance, one could note that the most financed regions (Calabria, Campania and Sicilia) have not been inter-ested by recent strong shocks, whereas the regions that hosted the last 9 strong shocks (Abruzzo 2009, Emilia-Romagna 2012 and central Italy 2016-17) have only ob-tained a medium size financial support.
Thus, we argue that a much more efficient preven-tion plan could be organized if reliable informapreven-tion would be available about where the next strong shocks in Italy may most probably occur. Many attempts at ob-taining such information have been made in the past [3-5] but the scarce correspondence that has so far oc-curred between the proposed predictions and the real distribution of seismicity has considerably discouraged such kind of investigations. However, one must con-sider that those disappointing results can be imputed to the fact that the methodology so far adopted is based on statistical analyses, i.e. an approach which is based on assumptions in clear contrast with the real nature of earthquakes [6]. Since it is well known that earth-quakes are deterministic phenomena, closely con-nected with the progressive development of crustal deformations, any attempt at recognizing the future paths of seismicity in the study area can provide reli-able results only if it is carried out by an adequate de-terministic approach, based on a profound knowledge of the ongoing tectonic context. This kind of approach has been described in some publications [7-9].
Correspondence to: Enzo Mantovani
Dipartimento di Scienze Fisiche della Terra e dell’Ambiente, Università degli Studi di Siena Via Laterina 8, 53100 Siena, Italy
Tel- Fax: +39.0577.233826 E-mail: [email protected]
B
EST STRATEGY FOR THE DEVELOPMENT OF A SEISMIC PREVENTION PLANEnzo Mantovani,
1Marcello Viti,
1Daniele Babbucci,
1Caterina Tamburelli,
1Nicola Cenni
21Dipartimento di Scienze Fisiche, della Terra e dell’Ambiente, Università di Siena; 2Dipartimento di Fisica e Astronomia, Università di Bologna, Italy
Abstract. An effective mitigation of seismic risk in Italy can hardly be obtained without a tentative recognition of few priority
zones, where the limited resources available in the short term can be concentrated. A reliable recognition of the zones where the probability of major earthquakes is highest must be carried out by a deterministic approach, exploiting the profound knowledge acquired about the present seismotectonic context in the zones involved. Some years ago, this kind of procedure led us to identify the central-northern Apennines (i.e. the zone hit by the recent major earthquakes, 2016 and 2017) as the Italian area most prone to next strong shocks. The reliability of the methodology here proposed is also supported by the fact that the implications of the adopted tectonic setting can provide plausible and coherent explanations for the spatio-temporal distribution of major earthquakes in the central Mediterranean area in the last six centuries.
Key words: Seismic Hazard, Prevention, Seismotectonics.
Non-commercial
In this note, we report a synthesis of the proposed procedure, in particular we describe the mechanism that it is supposed to control the spatio-temporal dis-tribution of seismicity in the central Mediterranean re-gion and the way by which such knowledge can allow the recognition of the Italian zones most prone to the next strong earthquakes in Italy.
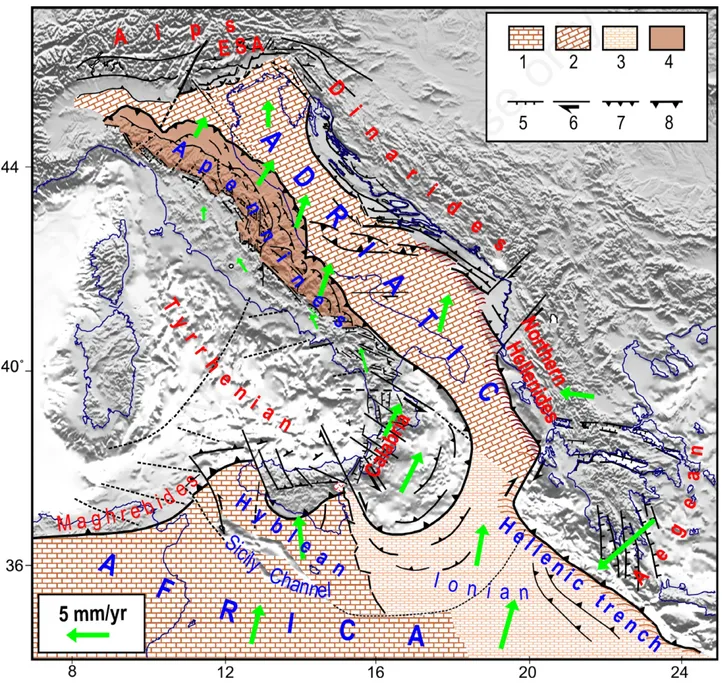
The ongoing tectonic context in the central Mediter-ranean area is sketched in Figure 1[10]. As argued in sev-eral papers [10-12], tectonic activity in the study area is mainly driven by the convergence of the confining plates, in particular by the motions of Africa and the Anatolian-Aegean-Balkan system with respect to Eurasia.
Such boundary conditions are mainly accommo-dated by the motion of the Adriatic plate (Adria), which is allowed by the decoupling earthquakes that occur along the orogenic zones which surround that plate (Figure 2) [8,9]. The motion of Adria is supposed to be very slow during quiescent periods, whereas it locally accelerates during co-seismic and post-seismic phases, in response to major decoupling earthquakes along the plate boundaries.
Taking into account the above tectonic context and
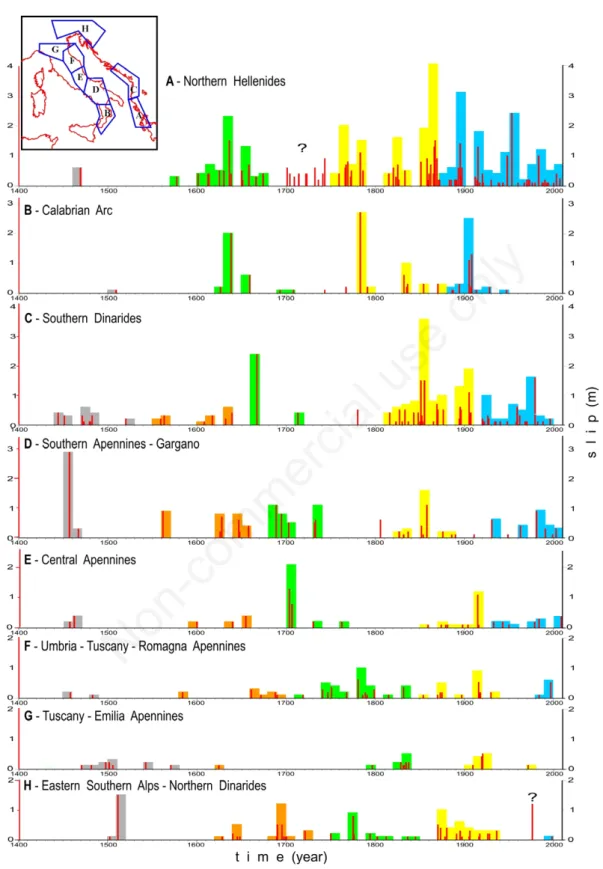
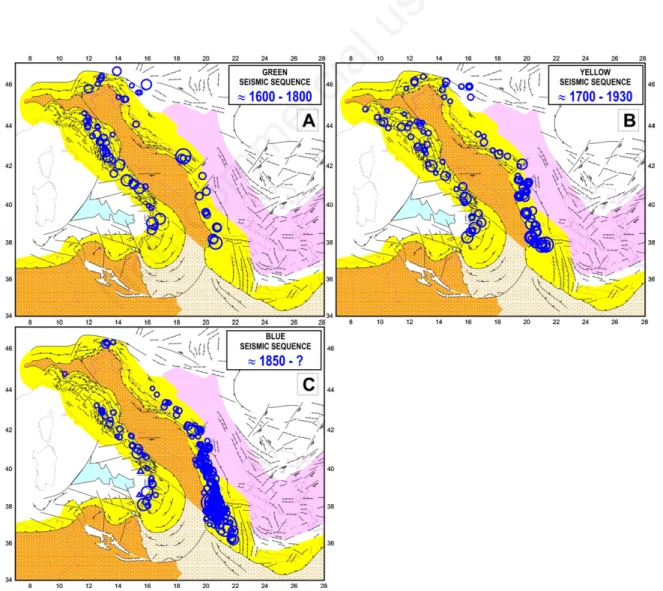
the fact that the seismic activation of a periAdriatic sec-tor may influence the tectonic load and thus the prob-ability of strong shocks in the other boundary zones, one could expect to observe regularities in the spatio-temporal distribution of seismicity along the periAdri-atic zones. To check the reliability of this hypothesis, we have analysed the time patterns of seismic activity in the main periAdriatic zones since 1400 A.D. (Figure 3). These patterns point out that in the zones consid-ered seismicity is mostly discontinuous over time, with periods of high activity separated by almost quiescent phases.
Furthermore, one could tentatively recognize a pro-gressive northward migration of seismic crises, along the eastern (Northern Hellenides and Dinarides) and western (Apennines and Calabria) boundaries of Adria, up to reach the northernmost boundary of Adria (East-ern South(East-ern Alps and North(East-ernmost Dinarides), as ten-tatively evidenced by the coloured strips. The features of the proposed seismic sequences suggest that each northward step of Adria (roughly 1-2 metres) takes about two centuries to achieve a full development.
The first two possible seismic sequences are
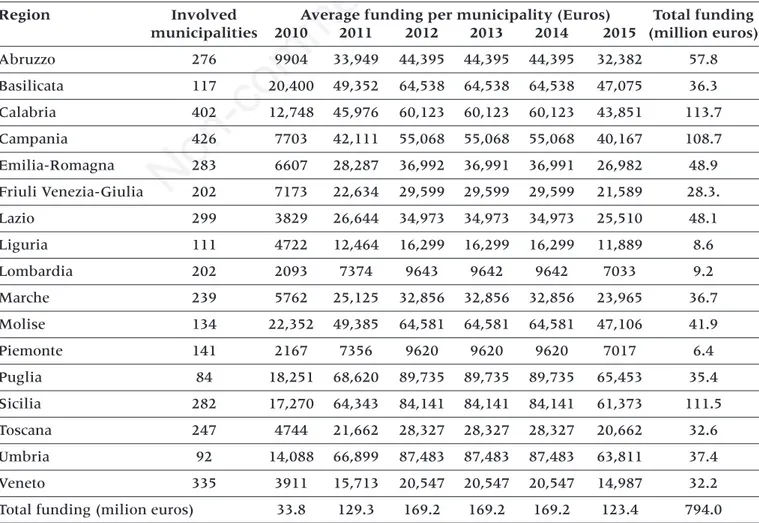
identi-Table 1. Funds assigned to the Italian regions for restoration of buldings (Legge 24 Giugno 2009, n. 77), in the period 2010- 2015.
Region Involved Average funding per municipality (Euros) Total funding municipalities 2010 2011 2012 2013 2014 2015 (million euros) Abruzzo 276 9904 33,949 44,395 44,395 44,395 32,382 57.8 Basilicata 117 20,400 49,352 64,538 64,538 64,538 47,075 36.3 Calabria 402 12,748 45,976 60,123 60,123 60,123 43,851 113.7 Campania 426 7703 42,111 55,068 55,068 55,068 40,167 108.7 Emilia-Romagna 283 6607 28,287 36,992 36,991 36,991 26,982 48.9 Friuli Venezia-Giulia 202 7173 22,634 29,599 29,599 29,599 21,589 28.3. Lazio 299 3829 26,644 34,973 34,973 34,973 25,510 48.1 Liguria 111 4722 12,464 16,299 16,299 16,299 11,889 8.6 Lombardia 202 2093 7374 9643 9642 9642 7033 9.2 Marche 239 5762 25,125 32,856 32,856 32,856 23,965 36.7 Molise 134 22,352 49,385 64,581 64,581 64,581 47,106 41.9 Piemonte 141 2167 7356 9620 9620 9620 7017 6.4 Puglia 84 18,251 68,620 89,735 89,735 89,735 65,453 35.4 Sicilia 282 17,270 64,343 84,141 84,141 84,141 61,373 111.5 Toscana 247 4744 21,662 28,327 28,327 28,327 20,662 32.6 Umbria 92 14,088 66,899 87,483 87,483 87,483 63,811 37.4 Veneto 335 3911 15,713 20,547 20,547 20,547 14,987 32.2 Total funding (milion euros) 33.8 129.3 169.2 169.2 169.2 123.4 794.0
Non-commercial
fied by the grey and orange strips, even though their starting phases in the southernmost periAdriatic sec-tors are not very clear.
The first presumably complete sequence (green in Figure 3) may have been triggered by a considerable increase of seismic activity in the Northern Hellenides sector during the first decades of the XVII century. This triggering crisis was followed by a significant increase of seismic activity in almost all other periAdriatic zones, up to reach the northern front of Adria in the second half of the XVIII century (Figure 3). In this last zone, major seismic activity lasted up to about the end
of the XVIII century and then underwent a drastic re-duction for a relatively long period, until 1870.
A drastic increase of seismic activity in the North-ern Hellenides in the last decades of the XVIII century may have determined the beginning of a new seismic sequence (yellow in Figure 3). Other seismic periods occurred in the same zone up to the middle of the XIX century. This sequence continued to develop with several major events in the Albania, Southern Dinar-ides and Southern Apennines. In the Central Apen-nines, a relatively long period of moderate seismic activity was interrupted by a very strong shock in the
Figure 1. Sketch of the tectonic/kinematic setting in the central Mediterranean region. 1,2) African and Adriatic continental
do-mains; 3) Ionian oceanic domain; 4) outer sector of the Apennine belt dragged and stressed by the Adriatic plate; 5-7) major ex-tensional, transcurrent and compressional tectonic features; 8) outer front of Neogenic belts. Green arrows indicate the proposed kinematic pattern with respect to Eurasia [12,15]. ESA, Eastern Southern Alps.
Non-commercial
1915 (Fucino, M=7.0), which was followed by several strong earthquakes in the Northern Apennines in the period 1916-1930.
The last presumed seismic sequence (blue in Figure 3) was triggered by a phase of very high seismic activ-ity in the Northern Hellenides around the end of the XIX century. As in previous cases the above crisis was accompanied by strong earthquakes in Calabria (1905 M=6.9, 1908 M=7.2).
Then, in the first 8 decades of 1900, significant seis-mic activity occurred in the southern sectors of the Di-narides and Apennines, while very scarce seismic activity affected the northern periAdriatic regions, with one major seismic crisis in the Eastern Alps (1976, M=6.5, 6.0) and a shock (1971, M=5.7) in the north-ernmost Apennines. This major difference between the ongoing seismic sequence (blue in Figure 3) and the preceding sequences (green and yellow in Figure 3) is
better evidenced by the spatial distribution of major earthquakes (Figure 4).
The seismicity patterns shown in Figures 3 and 4 may suggest that after the 1980 the probability of major earthquakes in the central and northern Apennines was higher than in other Italian seismic zones. This prediction is based on the assumption that the ten-dency of seismic activity to migrate northward along in the periAdriatiac zones is systematic. Unfortunately, the limited length of the known seismic history that can be tentatively taken as reliable and complete (since 1400 A.D.) only allows the recognition of few migrat-ing periAdriatic seismic sequences. However, it must be considered that the reliability of our assumption is also supported by the fact that the observed behaviour of seismicity is based on a physically plausible tectonic interpretation, supported by a huge amount of evi-dence from all branches of Earth Sciences [7,10-17].
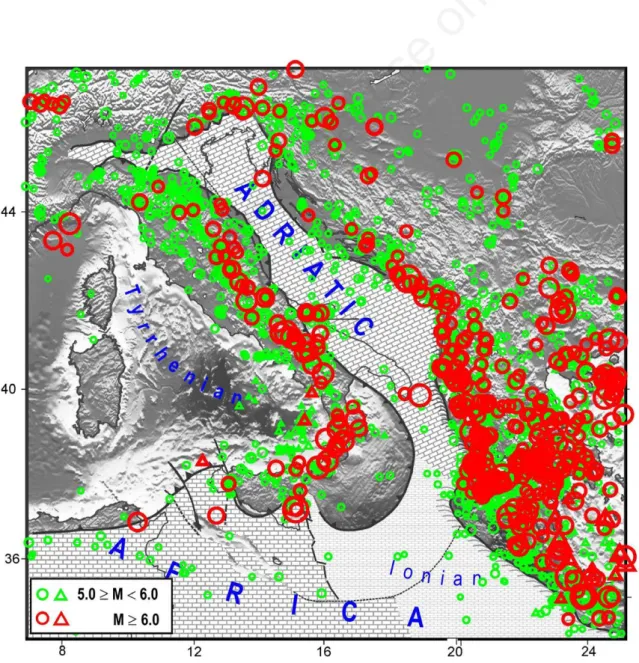
Figure 2. Distribution of major seismicity in the central Mediterranean area. Circles and triangles respectively indicate the
shal-low and deep (h>60 km) earthquakes that have occurred between 1400 and 2009. Seismicity data from [8,9].
Non-commercial
Figure 3. Time patterns of seismic slip associated with major shallow seismicity (h≤30 km and M ≥ 5.5) that has occurred in
the main periAdriatic seismic zones between 1400 and 2009. The geometries of the zones considered are shown in the inset. Red bars in the diagrams indicate the total seismic slip (metres) occurred during the related year, computed by the relation log10u= −4.8 + 0.69M, where u is the average seismic slip on the fault (in metres) and M is the earthquake magnitude [13]. Vertical coloured bands indicate the sum of seismic slips over decades. Colours tentatively evidence the seismic sequences during which major decoupling earthquakes have undergone a progressive migration from the southern to the northern pe-riAdriatic zones (see text for comments). Seismicity data from [8,9].
Non-commercial
35 Furthermore, one should consider that
notwith-standing possible ambiguities in the identification of the priority seismic zones, the strategy of privileging seismic risk reduction in few priority zones would any-way be convenient. In case the next shock does not occur in one of the zones identified (eventuality that cannot be excluded, given the complexity of the prob-lem involved) the negative consequences of such fail-ure would be not very important for the epicentral zone, where an almost negligible improvement of safety would have been allowed by an homogeneous distribution of resources. Instead, in case the next earthquake occurs in one of the proposed priority zones, the practical advantages would be remarkable, since the significant improvement of safety obtained for such zone could allow an appreciable reduction of casualties and damages.
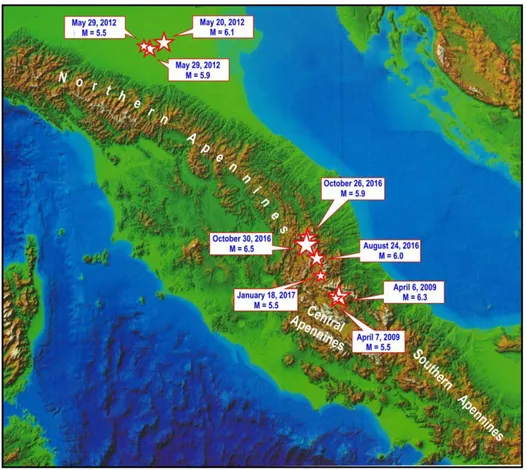
Anyway, an important support to the reliability of the approach here proposed is given by the fact that the last 9 strong (M≥5.5) shocks in Italy (Figure 5) have occurred in the central and northern Apennines, i.e. the zone recognized as most dangerous.
A detailed description of the evidence and argu-ments that led us to advance the above prediction is re-ported in some recent publications [7-9].
It is opportune to point out that no information can actually be provided about when the priority zones here recognized may be hit by major earthquakes. The only purpose of our attempt is favouring the best man-agement of public resources devoted to seismic risk mitigation in Italy and to inform the people living in the proposed priority zones. This last awareness may at least stimulate the restoration of the most vulnerable buildings in the zones involved and, more in general, all the operations that can improve the resistance of buildings to seismic shaking [18,19].
CONCLUSIONS
An efficient mitigation of seismic risk in Italy can hardly be achieved without a tentative recognition of few priority zones, where the very limited resources now available can be concentrated. The only doubts
Figure 4. Distribution of the earthquakes with M≥5.5 that occurred during the last three migrating sequences evidenced in
Figure 3.
Non-commercial
about the feasibility of such strategy are due to the pos-sibility that the proposed recognition is unreliable. So, it is opportune to make some considerations about the possible uncertainties that may affect the results of the procedure here adopted.
First of all, it must be pointed out that the proce-dure here proposed is based on the most reliable ap-proach, i.e. the one that takes into account the deterministic nature of earthquakes and hinges on the concept that the spatio-temporal distribution of major shocks is closely related with the short-term develop-ment of tectonic processes. The geodynamic/tectonic context here adopted is the one that best accounts for the huge amount of evidence now available about the recent evolution of the central Mediterranean area, as described in several publications (cited earlier). Fur-thermore, the reliability of such model is supported by the fact that its implications can provide plausible and coherent explanations for the distribution of the strong earthquakes that have occurred in the peri-Adriatic regions since 1400 A.D. [8,9]. The fact that the zones recognized as the most prone to next earth-quakes have effectively hosted the last 9 strong shocks in Italy considerably encourages to rely on the pro-posed approach.
REFERENCES
1. Gruppo di Lavoro MPS. Redazione della mappa di pericolosità sis-mica prevista dall’Ordinanza PCM 3274 del 20 marzo 2003. Rap-porto conclusivo per il Dip.to della Protezione Civile, INGV. 2004. Milano-Roma, pp. 1-65. Available from: http://zonesismiche.mi. ingv.it/.
2. Stucchi M, Meletti C, Montaldo V, et al. Seismic hazard assessment (2003-2009) for the Italian Building Code. Bull Seismol Soc Am 2011;101:1885-911.
3. Marzocchi W. Earthquake forecasting in Italy, before and after the Umbria-Marche seismic sequence 1997. A review of earthquake oc-currence modeling at different spatio-temporal magnitude scales. Ann Geophysics 2008;51:405-16.
4. Marzocchi W, Amato A, Akinci A, et al. A ten-year earthquake oc-currence model for Italy. Bull Seism Soc Am 2012;102:1195-213. 5. Schorlemmer D, Christophersen A, Rovida A, et al. Setting up an
earthquake forecast experiment in Italy. Ann Geophysics 2010:53:1-9.
6. Mantovani E, Viti M, Babbucci D, et al. Middle term prediction of earthquakes in Italy: some remarks on empirical and deterministic approaches. Boll Geofis Teor Appl 2012;53:89-111.
7. Viti M, Mantovani E, Babbucci D, et al. Belt-parallel shortening in the Northern Apennines and seismotectonic implications. Int J Geosciences 2015;6:938-61.
8. Mantovani E, Viti M, Babbucci D, et al. Recognition of periAdriatic seismic zones most prone to next major earthquakes: insights from a deterministic approach. In: D’Amico S, ed. Earthquakes and their
Figure 5. Distribution of major seismicity (M≥5.5) in the Italian area between 2009 and January 2017.
Non-commercial
impact on society. Springer Natural Hazard. Switzerland: Springer International Publishing 2016:43-80.
9. Mantovani E, Viti M, Babbucci D, et al, eds. Tentative recognition of the Italian seismic zones most prone to next strong earthquakes (as a tool for reduction of seismic risk). Messina: Mistral Service S.a.S.; 2016.
10. Mantovani E, Babbucci D, Tamburelli C, Viti M. A review on the driving mechanism of the Tyrrhenian-Apennines system: implica-tions for the present seismotectonic setting in the Central-Northern Apennines. Tectonophysics 2009;476:22-40.
11. Mantovani E, Viti M, Babbucci D, et al. Generation of back-arc basins as side effect of shortening processes: examples from the Cen-tral Mediterranean. Int J Geosciences 2014;5:1062-79.
12. Viti M, Mantovani E, Babbucci D, Tamburelli C. Plate kinematics and geodynamics in the Central Mediterranean. J Geodynamics 2011;51:190-204.
13. Wells DL, Coppersmith KJ. New empirical relationships among magnitude, rupture length, rupture width, rupture area and
sur-face displacement. Bull Seism Soc Am 1994;84:974-1002. 14. Mantovani E, Viti M, Babbucci D, et al. Present tectonic setting
and spatio-temporal distribution of seismicity in the Apennine belt. Int J Geosciences 2015;6:429-54.
15. Mantovani E, Viti M, Cenni N, et al. Present velocity field in the Italian region by GPS data: geodynamic/tectonic implications. Int J Geosciences 2015;6:1285-316.
16. Mantovani E, Viti M, Cenni N, et al. Seismotectonics and present seismic hazard in the Tuscany-Romagna-Marche-Umbria Apen-nines (Italy). J Geodynamics 2015;89:1-14.
17. Viti M, Mantovani E, Cenni N, Vannucchi, A. Post-seismic relax-ation: An example of earthquake triggering in the Apennine belt (1915-1920). J Geodynamics 2012;61:57-67.
18. Booth E, ed. Progettazione Sismica di Edifici. Roma: EPC Editore; 2015.
19. Elnashai AS, Di Sarno L, eds. Fundamentals of earthquake engi-neering. London: John Wiley & Sons, Ltd; 2008.