2020-10-26T09:03:56Z
Acceptance in OA@INAF
Alone on a wide wide sea. The origin of SECCO 1, an isolated star-forming gas
þÿcloud in the Virgo cluster* !
Title
BELLAZZINI, Michele; Armillotta, L.; Perina, S.; MAGRINI, LAURA; CRESCI,
GIOVANNI; et al.
Authors
10.1093/mnras/sty467
DOI
http://hdl.handle.net/20.500.12386/27986
Handle
MONTHLY NOTICES OF THE ROYAL ASTRONOMICAL SOCIETY
Journal
476
Number
Alone on a wide wide sea. The origin of SECCO 1, an
isolated star-forming gas cloud in the Virgo cluster
?
†‡
M. Bellazzini
1§
, L. Armillotta
2S. Perina
3, L. Magrini
4, G. Cresci
4, G.Beccari
5,
G. Battaglia
6,14, F. Fraternali
7,15, P.T. de Zeeuw
8,9, N.F. Martin
10,11, F. Calura
1,
R. Ibata
10, L. Coccato
5, V. Testa
12, M. Correnti
131 INAF - Osservatorio di Astrofisica e Scienza dello Spazio di Bologna, Via Gobetti 93/3, 40129 Bologna, Italy
2Research School of Astronomy and Astrophysics - The Australian National University, Canberra, ACT, 2611, Australia 3 INAF - Osservatorio Astronomico di Torino, Via Osservatorio 30, 10025 Pino Torinese, Italy
4INAF - Osservatorio Astrofisico di Arcetri, Largo E. Fermi 5, 50125 Firenze, Italy
5European Southern Observatory, Karl-Schwarzschild-Strasse 2, 85748 Garching bei M¨unchen, Germany 6Instituto de Astrofisica de Canarias, 38205 La Laguna, Tenerife, Spain
7Kapteyn Astronomical Institute, University of Groningen, Postbus 800, 9700 AV, Groningen, The Netherlands 8Leiden Observatory, Leiden University, Postbus 9513, 2300 RA, Leiden, The Netherlands
9Max Planck Institut f¨ur extraterrestrische Physik, Giessenbachstrasse, 85748 Garching, Germany 10Universit´e de Strasbourg, CNRS, UMR 7550, F-67000 Strasbourg, France
11Max-Planck-Institut f¨ur Astronomie, K¨onigstuhl 17, D-69117 Heidelberg, Germany 12INAF - Osservatorio Astronomico di Roma, via Frascati 33, 00040 Monteporzio, Italy 13Space Telescope Science Institute, Baltimore, MD 21218
14Universidad de La Laguna, Dpto. Astrofisica, E-38206 La Laguna, Tenerife, Spain
15Dipartimento di Fisica & Astronomia, Universit`a degli Studi di Bologna, Viale Berti Pichat, 6/2, I - 40127 Bologna, Italy
Accepted for publication on February 15, 2018
ABSTRACT
SECCO 1 is an extremely dark, low-mass (M?' 105M ), star-forming stellar system
lying in the Low Velocity Cloud (LVC) substructure of the Virgo cluster of galaxies, and hosting several Hii regions. Here we review our knowledge of this remarkable sys-tem, and present the results of (a) additional analysis of our panoramic spectroscopic observations with MUSE, (b) the combined analysis of Hubble Space Telescope and MUSE data, and (c) new narrow-band observations obtained with OSIRIS@GTC to search for additional Hii regions in the surroundings of the system. We provide new
ev-idence supporting an age as young as <∼ 4 Myr for the stars that are currently ionising
the gas in SECCO 1. We identify only one new promising candidate Hii region pos-sibly associated with SECCO 1, thus confirming the extreme isolation of the system. We also identify three additional candidate pressure-supported dark clouds in Virgo among the targets of the SECCO survey. Various possible hypotheses for the nature and origin of SECCO 1 are considered and discussed, also with the help of dedicated hydrodynamical simulations showing that a hydrogen cloud with the characteristics of
SECCO 1 can likely survive for >∼ 1 Gyr while traveling within the LVC Intra Cluster
Medium.
Key words: ISM: Hii regions — galaxies: dwarf — galaxies: star formation —
galaxies: clusters: individual: Virgo cluster — galaxies: interactions
? Based on data obtained with the European Southern
Observa-tory Very Large Telescope, Paranal, Chile, under the Programme 295.B-5013.
† Based on observations made with the NASA/ESA Hubble Space Telescope, obtained at the Space Telescope Science Insti-tute, which is operated by the Association of Universities for
Re-search in Astronomy, Inc., under NASA contract NAS 5-26555. These observations are associated with program GTO-13735. ‡ Based on observations made with the GTC, installed in the Spanish Observatorio del Roque de los Muchachos of the Instituto de Astrofsica de Canarias, in the island of La Palma.
§ E-mail: [email protected]
1 INTRODUCTION
SECCO 1 is a faint star-forming stellar system that was discovered by Bellazzini et al. (2015a,b, B15a and B15b, hereafter) in a survey (SECCO1; B15a) aimed at searching for stellar counterparts of Ultra Compact High Velocity Hi clouds (UCHVC), selected from the ALFALFA(Adams et al. 2013) radio survey.
In B15b we proved the physical association of the small group of blue compact sources originally identified in B15a with the UCHVC HVC 274.68+74.0, from the sample of
Adams et al.(2013), and we obtained a first estimate of the oxygen abundance, that appeared anomalously high for a dwarf galaxy as faint as SECCO 1. SubsequentlySand et al.
(2015, S15, hereafter) reported on the independent discovery of the same system, confirming the results of B15b. These authors identified a smaller system with similar appearance lying just ∼ 20 apart (see also Beccari et al. 2016, Be16, hereafter). In the following we will refer to the two pieces of SECCO 1 as the Main Body (MB) and the Secondary Body (SB), according toBeccari et al. (2017a, Be17a, hereafter). Both B15b and S15 agree that SECCO 1 lies within the Virgo cluster of galaxies. In particular, it probably belongs to a substructure of the cluster known as low-velocity cloud (LVC,Boselli et al. 2014), whose central galaxy is the spi-ral NGC 4216. The Hubble Space Telescope photometry of SECCO 1 obtained bySand et al.(2017, S17, hereafter) is consistent with this conclusion.
High spatial resolution Hi observations byAdams et al.
(2015, A15, hereafter) split the original HVC 274.68+74.0 into two smaller clouds: AGC 226067, centered on MB, and AGC 229490, off-set by ' 0.50with respect to SB. Assuming a distance D=17.0 Mpc for the LVC (followingBoselli et al. 2014), the total Hi mass associated to SECCO 1 is MHI∼
2×10⁷M . On the other hand, the total stellar mass derived with two independent methods from HST data by Be17a and S17 is M?<∼ 1.6 × 10⁵M , thus implying a Hi-to-stellar
mass ratio of MHI
M? >
∼ 100, fully in the range of almost-dark galaxies (Cannon et al. 2015)2.
Finally, in Be17a, we presented the results of panoramic optical spectroscopy of SECCO1 MB and SB obtained with the integral-field spectrograph MUSE@VLT (Bacon et al. 2014). The MUSE data-cube allowed us to identify many individual Hii regions in both MB and SB, measuring their radial velocity and metallicity. We found that MB and SB not only have very similar systemic velocities but also the same oxygen abundance, thus demonstrating that the two systems have a common origin.
In particular, all the Hii regions in which we could obtain a reliable estimate of the oxygen abundance have the same abundance (from strong-lines indicators) within the observational uncertainties. The mean metallicity is h12 + (O/H)i = 8.38 ± 0.10, confirming the earlier estimate
1 http://www.bo.astro.it/secco 2 Note that S17 provide an M
V estimate that is 0.9 mag brighter
than that by B17a, but, given the large uncertainties, this cor-responds to a 2σ difference. We feel more confident on the B17a estimate since there, while summing the light of SECCO 1, we were able to exclude the contribution from unrelated sources that we unambiguously identified, based on their velocity, thanks to the MUSE spectra.
by B15b, a value typical of galaxies as massive as the Large Magellanic Cloud or M33. The anomalously high metallic-ity, for the small stellar mass, strongly suggests that the gas that is presently converted into stars in SECCO 1 was chemically enriched in a much larger galaxy, from which it was torn apart by tidal or ram-pressure interaction with the harsh Virgo environment. The apparent lack of a stellar population older than a few tens of Myr provides additional support to this hypothesis (Be17a, S17). The star formation was (independently) found by Be17a,b3 and by S17 to have
a rate typical of star-forming dwarfs with total luminosity comparable to SECCO 1 (James et al. 2015, see Table 1, below).
While star formation is known to occur in ram-pressure stripped gas clouds in galaxy clusters (see, e.g.,Gerhard et al. 2002;Yoshida et al 2012; Kenney et al. 2014;Hester et al. 2010; Fumagalli et al. 2011, 2014; Fossati et al. 2016, and references therein) and in the surrounding of interact-ing galaxies (see, e.g.,Ryan-Weber et al. 2004), this usually happens in relatively close proximity to the stripped galax-ies. SECCO 1 is by far the most isolated case ever observed (S17, Be17a), as the closer plausible progenitor proposed up to now (the M86 subgroup, S17) lies at more than 350 kpc (but see below). This implies that, if indeed SECCO 1 is a gas cloud stripped from that group, it must have travelled within the hot Intra Cluster Medium (ICM) for about 1 Gyr before the ignition of the current star formation episode (Be17a, S17). Hence SECCO 1 is of special interest to un-derstand the behaviour of such long-lived quiescent stripped clouds that may be present in large numbers within galaxy clusters (Burkhart & Loeb 2016).
In Table 1 we provide a summary of the main phys-ical properties of SECCO 1, adopting the distance D = 17.0 Mpc, following A15, Be17a and S17. This is the dis-tance to SECCO 1 that we always adopt in this paper.
In Be17a we presented the observational framework for this intriguing stellar system. Here we discuss and investi-gate in detail its origin and evolution, with the support of dedicated hydrodynamical simulations. Sect.2is devoted to describe the reduction of the HST images of SECCO 1 al-ready presented by S17, and of the deep narrow-band Hα im-ages that we obtained with OSIRIS@GRANTECAN (GTC). In Sect.3we present additional results from the MUSE data, in particular on the effect of the ionisation on the estimate of metallicity and on the nature of ionising sources. In Sect4
we analyse the stellar content of SECCO 1, coupling the con-straints from HST and MUSE data. In Sect.5we present the results of the GTC Hα imaging. In Sect.6we put SECCO 1 in the context of dwarf galaxies and of stripped gas clouds, discussing the pros and cons of various evolutionary paths. In Sect. 7 we present the results of 2D and 3D hydrody-namical simulations aimed at establishing the lifetime and evolution of a pressure-supported Hi gas cloud similar to SECCO 1 travelling into the ICM. In Sect.8we discuss the conditions for the occurrence of star formation in Hi clouds similar to SECCO 1 and we identify three new candidate dark gas clouds that may be wandering within the Virgo
3 The SFR originally reported in B17a was flawed by a
triv-ial computation error that has been corrected in Beccari et al. (2017b).
ICM like SECCO 1. Finally, in Sect. 9 we summarise our results.
2 DATA ANALYSIS
In this section we briefly report on the reduction of the HST images of SECCO 1 obtained by S17, that will be discussed in Sect.4, and of the acquisition and reduction of narrow-band Hα imaging, whose results are presented in Sect.5.
2.1 HST photometry
S17 present a detailed analysis of Hubble Space Telescope (HST) Advanced Camera for Surveys (ACS) Wide Field Camera (WFC) F606W and F814W images of SECCO 1 (GO 13735 program, P.I.: D.J. Sand).
We reduced and analysed independently the S17 dataset to have a deeper insight on the stellar populations in SECCO 1 by combining the HST-ACS and MUSE data. Positions and photometry of individual stars were obtained with the ACS module of the point spread function (PSF) fit-ting package DOLPHOT v.2.0Dolphin(2000), as described, for example, in Bellazzini et al. (2011b). We adopted a threshold of 2.5σ above the background for the source detec-tion. Photometry was performed on the individual images corrected for charge transfer efficiency (FLC files), adopt-ing the F814W drizzled distortion-corrected image (DRC file) as the reference for source identification. In the follow-ing we will use magnitudes in the ACS-WFC VEGAMAG system and the analysis will be limited to the best quality sources, selected by having quality flag=1, sharpness param-eter |sharp| < 0.2 for F814W≤ 26.5 and −0.4 < sharp < 0.2 for F814W> 26.5, crowding parameter crowd < 1.0, good-ness of fit parameter chi < 2.0, and photometric errors in both passbands ≤ 0.5 mag. The resulting CMD is discussed in Sect.4.
2.2 GTC Hα imaging
S17 report that there is no evidence of further pieces of SECCO 1 within the field sampled by their ACS images. However the ACS-WFC field is relatively small and the most interesting (and easy to find) kind of sources to be searched for in the surroundings of SECCO 1 are Hii regions, isolated or in groups, that can be associated to the system. Indeed, e.g., ram pressure stripping episodes are expected to pro-duce star-forming blobs in large numbers (see Kapferer et al. 2009, and the discussion in Sect.6, below).
To look for these sources we obtained Hα imaging of a ' 7.80× 7.80
field centered on SECCO1 MB with the OSIRIS4 camera mounted on the 10.4m Gran Telescopio CANARIAS (GTC), at the Observatory Roque de los Muchachos, in La Palma, Spain (program GTC42-16A, P.I.: G. Battaglia). We used the OSIRIS tunable filters (Gonz´alez et al. 2014) f657/35, sampling Hα rest-frame (FWHM' 35 nm), and f680/43, sampling an adjacent portion of the continuum (FWHM' 43.2 nm). We obtained a total of twenty-one texp = 600 s images per filter, applying a dithering of a
4 http://www.gtc.iac.es/instruments/osiris/osiris.php
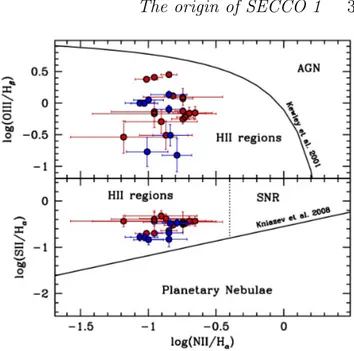
Figure 1. Classification diagnostic diagrams for all the SECCO 1 sources identified in Be17a for which reliable estimate of the flux for the relevant lines could be obtained, followingKniazev et al. (2008). Red filled circles are sources residing in MB, blue filled cir-cles lie in SB. The threshold curves are fromKewley et al.(2001, upper panel), and fromKniazev et al.(2008, lower panel). The dotted line in the lower panel marks the lower limit in log(Nii/Hα) of the locus occupied by Supernova Remnants. The upper(lower) panel includes 24(23) of the 38 sources identified by Be17a.
few arcsec between each individual image, in various service mode visits from January to March 2017. The typical seeing was around ∼ 1.000.
All the images were corrected for flat-field and bias and the sky was subtracted, also removing the sky ring patterns that are typical of this observing mode of OSIRIS (Gonz´alez et al. 2014). Then all the images were combined into one single stacked f657/35 image and one single stacked f680/42 image. We used Sextractor (Bertin & Arnouts 1996) to iden-tify sources with peak intensity >∼ 10σ above the backgroun-dand to measure their magnitudes (magHα and magcont)
in both images. The output catalogs were combined using codes from the Catapack suite5. Then, in a plot magHαvs.
color (magHα - magcont), we identified the sources having
an excess in magHα - magcont larger than three times the
standard deviation in a broad range around their Hα lumi-nosity. In this way we obtained a catalog of a handful of candidate Hα emitters, including already-known SECCO 1 sources as well as several sources which are detected only in Hα and not in continuum images. The analysis of this catalog is described in Sect.5.
3 MORE FROM MUSE: IONISATION, KINEMATICS AND IONISING SOURCES As a first step in our review of the properties of SECCO 1, we present some additional analysis of the MUSE data
pre-5 By P. Montegriffo, http://davide2.bo.astro.it/~
Table 1. Physical properties of SECCO 1 (assuming D=17.0 Mpc)
parameter MB SB Total note
RAJ 2000 12:21:54.0 12:21:55.7 from the ACS-WFC F606W imagea
DecJ 2000 +13:27:36.8 +13:29:02.3 from the ACS-WFC F606W imagea
LV[LV, ] 1.2 +0.5 −0.4× 10⁶ 4.4 +2.6 −1.6× 10⁵ 1.6 +0.6 −0.4× 10⁶ from Be17a
M?[M ] <∼ 1.2 × 10⁵ <∼ 0.4 × 10⁵ <∼ 1.6 × 10⁵ upper limit from integrated light (Be17a)
M?[M ] 7.3+3.0−2.4× 10⁴ 2.7 +1.6
−1.0× 10⁴ 1.0 +0.4
−0.3× 10⁵ from integrated light (Be17a)b
M?[M ] 5.4 ± 1.3 × 10⁴ from CMD analysis (S17)
MHI[M ] 1.5 × 10⁷ 3.6 × 10⁶ 1.9 × 10⁷ from A15c
Radial size?[kpc] 1.2 1.2 radius enclosing all the Hα emission (Be17a)
rHI[kpc] 3.7 < 1.6 Hi radius from A15
V? h [km s
−1] −153.2 ± 1.4 −126.5 ± 2.5 heliocentric radial velocity (stars, Be17a)
VHI h [km s
−1] −142 −123
heliocentric radial velocity (Hi, A15) σ? Vh [km s −1] 3.5 ± 2.1 2.7 ± 5 from Be17a σHI Vh [km s −1] 9 ± 3 4 ± 2 from A15
h12 + log(O/H)i 8.37 ± 0.11 8.39 ± 0.11 8.38 ± 0.11 from Be17a,b
SFR [M yr−1] 0.7 ± 0.2 × 10⁻³ from Hα flux (Be17a,b)d
SFR [M yr−1] 1.1 × 10⁻³ from CMD analysis (S17)
Dp(MB-SB) [kpc] 7.3 proj. distance between MB and SB
Dp(stars-Hi) [kpc] ' 0.0 ' 2.5 proj. distance between stars and gas cloud
Dp(MB-NGC4299) [kpc] 582 proj. distance from proposed parent system (Be17a)
Dp(MB-M86) [kpc] 346 proj. distance from proposed parent system (S17)
Dp(MB-IC3142) [kpc] 255 proj. distance from proposed parent system (this work) aGeometric centers of the distribution of sources, estimated by eye. For MB this is slightly different than that adopted in B17a that
referred to the center of the main northern clump of sources. To establish the geometric center of SB we used the distribution of Hii regions on the MUSE datacube as a guideline.
badopting M/L
V=0.061 from the solar-scaled BASTI model (Percival et al. 2009) with age=30 Myr and [Fe/H]=-0.66. cThe Hii AGC229490 cloud is off-set by 0.50 from SB.
dThe reported uncertainty combines the error on the integrated Hα flux and the uncertainty associated to the adopted
calibration (Kennicutt 1998). Varying the assumed distance by ±3.0 Mpc changes the SFR by ' ±0.2 × 10⁻³M yr−1.
sented in Be17a (see this paper for all the details on the ob-servational material and data reduction). In Fig.1we show the position of the individual sources identified in Be17a in the diagnostic diagrams that are generally used to dis-criminate Hii regions from Active Galactic Nuclei (AGN), Supernova remnants (SNR) and Planetary Nebulae, based on line flux ratios. According to these diagnostic diagrams, all the considered sources are unambiguously classified as Hii regions.
Given the star formation history inferred by S17 we ex-pect that at least some massive stars (conventionally those with mi ≥ 8.0 M ) have already exploded as type II
Su-pernova (SNII). We use the fraction of the total mass con-tributed by massive stars in the stellar mass ranges 8.0–40 M and 40–100 M , computed by Romano et al. (2005) for several different Initial Mass Functions (IMFsSalpeter 1955; Tinsley 1980;Scalo 1986,1998; Kroupa et al. 1993;
Chabrier 2003), to estimate the quantity of SNe exploded in SECCO 1, adopting M?= 1.0 × 10⁵ M from Tab.1. The
mass of stars with m = 8−40 M ranges from a a minimum of about 5500 M with the IMF ofScalo(1986) to a maxi-mum of 1.8×10⁴
M with the IMF ofTinsley(1980). Stars in the range m = 40 − 100 M contribute about 300 M
(Tinsley 1980) to ∼ 6000 M (Chabrier 2003) to the total stellar mass budget of the system. Since, according to the
Marigo et al.(2017) stellar models of the proper metallicity (Z=0.006), the lifetime of a 40 M star is ' 5.0 Myr and that of a 8 M star is ' 40.0 Myr, we can conclude that, if the IMF of SECCO 1 is comprised within the range of
cases considered here and independently of the detailed star formation history, several SNII explosions should have oc-curred in this system. Is this consistent with the fact that we do not see signatures of shocks in the spectra of the ionised regions of SECCO 1? Considering that in the spiral galaxy M33,Asvarov(2014) computed a number of about 1000 ex-pected alive (i.e., observable) Supernova remnants (SNR), we can just scale that number by the stellar mass ratios of the two galaxies (∼10−4), to roughly estimate the number of expected SNRs in SECCO1, obtaining only 0.1 SNRs. This number is indeed compatible with the non detection of SNRs in our observations.
3.1 Kinematics, metallicity and ionisation of the diffuse gas
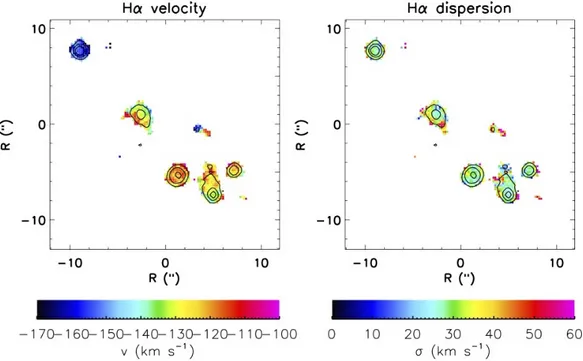
In Fig. 2 and Fig. 3 we show the Hα velocity map (left panel) and velocity dispersion map (right panel), corrected for the intrinsic instrumental broadening for MB and SB, respectively. The maps show only the spaxels with S/N > 3 in the Hα line, whose parameters are derived by fitting a single Gaussian to every spaxel.
This view is complementary to the analysis of the indi-vidual Hii regions presented in Be17a, as it traces also the properties of diffuse ionised gas that is present in SECCO 1. Not surprisingly, the systemic velocity of the diffuse gas fol-lows the same velocity field as individual sources. The ve-locity dispersion of the gas within the nebulae (not shown
Figure 2. Kinematic maps for the Main Body. The Hα velocity (left panel) and velocity dispersion (right panel) are shown for all the spaxels with S/N > 3 after a Gaussian kernel smoothing of 3 pixels (0.600). Hα contours are overplotted for reference, corresponding to
0.3, 0.8, 2, 6 erg s−1cm−2˚A−1respectively.
Figure 3. Kinematic maps and Hα contours for the Secondary Body. The arrangement and the meaning of the symbols are the same as in Fig.2.
in Be17a) is very uniform over the body of the system, with mean values typical of Hii regions.
As discussed in Be17a (and already noted in B15b), some of the sources (in particular MB25, MB59 and MB61) show much stronger [OIII] emission than the others (specif-ically, higher [OIII]/Hβ ratios). This may be due to a dif-ferent metallicity or to a difdif-ferent degree of ionisation. To
investigate the actual origin of the anomalous [OIII] emis-sion in these regions we use the diagnostic diagram proposed byDopita et al.(2016, D16 hereafter), that provides an es-timate of both the ionisation parameter U and the oxygen abundance 12+log(O/H) from a combination of rest-frame optical strong line ratios.
Figure 4. The spatially resolved emission line diagnostic by Dopita et al. (2016) for spaxels in the SECCO Main Body with S/N> 3.0 in all the emission lines involved. The diagnostic diagram is shown in the left panel, where each point correspond to a MUSE spaxel. The metallicity scale (increasing towards the upper part of the plot) and ionisation parameter scale (increasing towards the right part) are shown on the different grids, corresponding to different values of the ISM pressure. The spaxels whose metallicity in the Dopita et al. (2016) scale is 12 + log(O/H) < 8.25 are plotted as green filled circles, those with 12 + log(O/H) > 8.6 as magenta filled circles, while the spaxels with log U> −3.0 are shown as blue filled circles, independently of their oxygen abundance. The same spaxels are over-plotted with the same color code on the Hα map in the right panel.
where the different grids shows the variation of metallicity and log U for different values of ISM pressure. The spaxels with S/N > 3.0 in all the lines involved ([OIII], Hα, Hβ, [NII] and [SII] doublet) are shown as points on the grid, col-ored according to their position in the diagram (outliers in log U in blue, spaxels in the high-metallicity tail in magenta, those in the low metallicity tail in green; all the others in black). The position of the blue, green and magenta spaxels is superposed to the Hα emission map in the right panel of Fig.4. The high-ionisation blue points are all clustered at the position of the sources with the anomalosuly high [OIII] emission, strongly suggesting that the larger [OIII]/Hβ ra-tio is not due to variara-tion in metallicity, but to a higher ionisation parameter at these locations. The spaxels tracing metallicities lower than 12+log(O/H)< 8.25 (green points) appear to correspond to diffuse gas between the detected Hii regions, where the mixing of metals diffused by stellar winds and supernova explosions within each nebula is prob-ably less effective. In any case, the metallicity variations are ±0.25 dex across the whole system, comparable to the uncertainties. Finally, if we limit the analysis to the spax-els with S/N > 5.0 in all the involved lines, all the magenta dots and most of the green ones (in particular, all those hav-ing 12+log(O/H)≤ 8.06) disappear, showhav-ing that the tails of the metallicity distribution are populated by the noisier spaxels6. The high degree of chemical homogeneity of the
6 Note that in Be17a the contribution of all the spaxels
associ-ated to a given source were integrassoci-ated together, providing source spectra with much higher S/N and, consequently, more robust metallicity estimates for the individual Hii regions.
system found in Be17a is confirmed using metallicity esti-mates from the D16 diagram. Fully analogous conclusions hold for SB. We do not show the D16 diagram for SB be-cause in that piece of SECCO 1 there is no source displaying an anomalously high [OIII] emission.
3.2 Spectroscopic constraints on the age of the youngest stellar population
To ionise an Hii region we need O or B stars.Dors et al.
(2017) found that most extragalactic Hii regions are ionised by stars in the Teff range 37-40 kK, with an average value
of 38.5 kK, corresponding to a MS lifetime shorter than 4 Myr (Pecaut & Mamajek 2013). This suggests that also in SECCO 1 the ionising stars can belong to a very young population that may be difficult to unambiguously identify and characterise in a sparsely populated CMD. Note that 4 Myr is the age of the youngest isocrone in the PARSEC7 set (Marigo et al. 2017) that we use in Sect.4. To investi-gate this issue we attempt to constrain the temperature and, consequently, the age of the stars powering the HII nebulae in SECCO 1, using our MUSE spectra.
The effective temperature (Teff) of the ionising stars of
a nearby Hii region can be estimated through direct observa-tion and spectral classificaobserva-tion (see e.g.Walborn et al. 2014;
Evans et al. 2015;Lamb et al. 2015). For more distant stars, we have an indirect estimate of Teff based on the analysis
of the emission lines of the nebular gas as proposed origi-nally byZanstra(1931) and later byOsterbrock & Ferland
Table 2. Temperature and Spectral Type of ionising stars
Name He I 5786 Hβ HeIHβ Tef f STa
unit erg cm−2s−1 erg cm−2s−1 K
MB25 7.1±1.7E-18 1.07±0.02E-16 0.07±0.02 35000±2000 O7.5V
MB26 8.1±2.3E-18 5.00±0.02E-17 0.16±0.05 53000±17000b,c O2V
MB27 1.1±2.6E-17 9.13±0.02E-17 0.12±0.03 40000±3000 O5.5V
MB30 9.5±2.1E-18 6.86±0.02E-17 0.14±0.04 47000±10000c O2V
MB56 9.3±2.2E-18 8.00±0.02E-17 0.12±0.03 40000±3000 O5.5V
MB61 1.2±0.2E-17 8.65±0.02E-17 0.14±0.03 42000±2000 O4V
SB2 5.2±1.6E-18 6.21±0.02E-17 0.08±0.03 36000±2000 O7V
SB45 5.4±1.8E-18 6.08±0.02E-17 0.09±0.03 37000±3000 O6.5V
aSpectral types are fromPecaut & Mamajek(2013) for T
ef f≤46000 K, while we associate the spectral type O2V
to stars with Tef f>46000 K. bT
ef f of this star is extrapolated from the relation given in Fig. 9 ofKennicutt et al.(2000, lower continuous curve),
since the relation is valid only for Tef f <50000. cThe large errors on the T
ef f for these stars are due to the flattening of the relation between HeIHβ and Tef f for HeIHβ > 0.12.
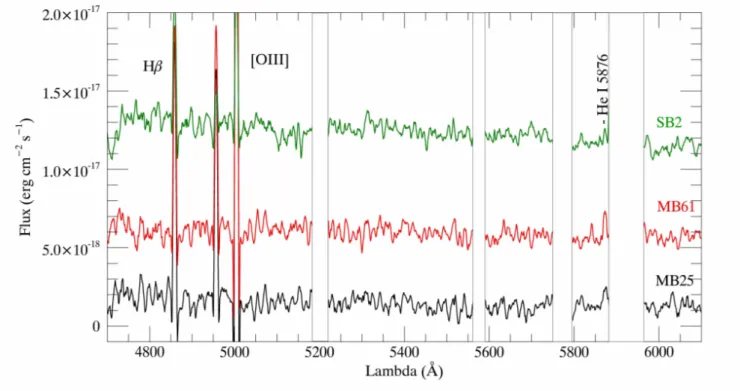
Figure 5. MUSE spectra (from B17a) of three Hii regions listed in Tab.2, representative of the quality of the whole sample (in terms of flux in the HeI5786 line). The spectra of the sources with the highest and the lowest HeI5786 fluxes (MB61 and SB2, respectively) are plotted, as well as an intermediate case (MB25). The spectral range shown include the lines used to estimate the temperature of the ionising stars. Arbitrary shifts in flux are applied to the spectra of MB61 and SB2 to make the plot readable. Blank vertical bands mask regions of the spectra badly affected by the residual of strong sky lines.
(2006). In particular, we have used the ratio between the Hei 5876˚A line and Hβ which gives an estimate of the effective temperature nearly independent of the ionising parameters (see, e.g., Fig. 9 ofKennicutt et al. 2000).
In Tab.2we summarise our results for all the B17a Hii regions where the Hei line can be reliably measured from our MUSE data. In Fig.5we show the relevant portion of the MUSE spectrum for a representative sample of the sources listed in Tab.2. The table reports the observed fluxes of the
Hβ and of the Hei lines, their ratios, the corresponding Teff,
and an indicative spectral classification. All stars belong to the O spectral type, being all hotter than > 35 kK. This means that they are more massive than 20 M and indeed younger than ' 4 Myr. The main conclusion is that star-formation occurred very recently in SECCO 1, in fact it may be currently ongoing.
Figure 6. Color magnitude diagrams from HST/ACS photometry of circular regions of radius=2000centered, from left to right, on the center of the main body of SECCO 1, on the center of the secondary body of SECCO 1, on the center of the Virgo dwarf spheroidal Dw J122147+132853, and on a region devoid of resolved stellar systems (Control Field). The polygonal contour at F814W≤ 27.0 and F606W-F814W' 1.0 approximately encloses the intra cluster population of RGB stars as sampled byWilliams et al.(2007), the thick vertical segment at F606W-F814W= 0.4 is the ridge line of the blue intra cluster population from the same source (the difference in E(B-V) between the two lines of sights is < 0.03 mag and it has been neglected). Blue circles are sources cross-identified in the list of Hii regions in B17a; those having a skeletal triangle inscribed are recognised as more extended than individual point-sources by DOLPHOT. To superpose the PARSEC isochrones (grey curves) we adopted D=17 Mpc and E(B − V ) = 0.048.
4 HST+MUSE: THE STELLAR CONTENT OF SECCO 1
Using synthetic CMDs from stellar models, S17 concluded that the CMD they obtained from HST data is compati-ble with continuous star formation between 50 and 7 Myr ago. They found no evidence of older stars associated to SECCO 1 in their CMD and they established that the ob-served diffuse light can be accounted for by the unresolved low-mass counterpart of the 7-50 Myr old population. Unfor-tunately, the actual upper limit that S17 were able to put on the total mass in old stars is very weak, M?< 6 × 10⁵ M ,
i.e., the data are still compatible with the presence of an old stellar population comparable to or even larger than the young component, in mass.
Here we re-analyse the stellar content of SECCO 1 in the light of the results obtained with MUSE, using the in-dependent photometry we obtained from the S17 data, as described in Sect.2.1. In Fig.6we show the CMD of four circular regions of the ACS-WFC field with radius=2000, cor-responding to ' 1.6 kpc at D=17.0 Mpc. The first two
re-gions are centred on SECCO 1 MB and SB, respectively. The third is centred on a dwarf spheroidal galaxy lying in the Virgo cluster that was serendipitously included in the ACS-WFC images of SECCO 1, Dw J122147+132853 after S178.
The fourth region samples a portion of the field far away from any resolved stellar system, as a Control Field (CF) providing an idea of the properties of the back/foreground population that should contaminate the CMDs of SECCO 1. The CMD of the Control Field seems populated by the typical intra cluster (IC) population of Virgo, consisting of a Red Giant Branch (RGB, stars with age >∼ 1 − 2 Gyr) and a broad vertical plume of younger blue stars (see, e.g.Williams et al. 2007, discussion and references therein). We used the deep CMD of Virgo IC stars by Williams et al. (2007) to
8 In the left panel of Fig. 14 by Be16 Dw J122147+132853 can
be seen ' 11000to the West of SECCO 1 SB. It looks similar to
other small LSB Virgo dwarfs identified in that paper but we do not include it in the Be16 list because it is partially superimposed on a distant disk galaxy, making its classification ambiguous.
Figure 7. Upper panels: Hα emitting sources from Be17a hav-ing a counterpart in our catalog from HST photometry are plot-ted as blue circles over two portions of the F606W ACS im-age of SECCO 1-MB (left panel) and of SECCO 1-SB (right panel). Lower panels: Hα intensity contours over-plotted on the same image, with the same scale. The contour levels are, from the outermost to the innermost: 0.5, 1.0, 2.0, 4.0, 8.0, 16.0 ×10⁻¹⁸ erg cm2 s−1. In all the panels North is up and East
to the left.
derive the mean locus of IC blue stars (plotted here as a thick vertical segment) and the thick polygonal contour ap-proximately enclosing the IC RGB population near the RGB Tip. Note that, according toWilliams et al.(2007), the in-tra cluster RGB stars in their sample span the metallicity range −2.3 ≤ [M/H] ≤ 0.0. The limiting magnitude of our photometry is a strong function of color and runs nearly par-allel to the right side of the polygonal contour. Hence the reddest stars of the IC RGB population are not seen here because they are beyond our detection limit. This implies that a population of metal-rich (Z >∼ 0.004) RGB stars as-sociated with SECCO 1 may have gone undetected because the photometry is too shallow.
On the other hand, it is easy to see that the RGB stars dominating the CMD of the Dw J122147+132853 dSph are, in average, bluer than their IC counterparts, suggesting that the mean metallicity of the dSph is lower than that of the old IC population in this specific line of sight. Note that the clear detection of the RGB Tip of Dw J122147+132853 around F814W∼ 27.0 allows us to unambiguously locate it at the distance of the Virgo cluster. Since the dSph appears to contain only old stars, its CMD can be considered as an additional Control Field for F814W< 26.5.
The CMDs of both MB and SB show an obvious ex-cess of blue stars (F606W-F814W< 0.0) and of red stars brighter than F814W= 25.5 with respect to the dSph field
and the CF. These stars are the characteristic population of SECCO 1, as witnessed also by the significant fraction of them being cross-identified with peaks of Hα emission found by B17a in the MUSE images (blue circles). The identifica-tion of sources associated with Hii regions in the CMD of Fig.6is an important development with respect to the anal-ysis by S17, with implications on the interpretation of the diagram (see below). The position of the MUSE sources in the ACS image is illustrated in the upper panels of Fig.7, while in the lower panels of the same figure we over-plotted the Hα intensity contours. There are several interesting con-siderations regarding the CMDs of Fig.6:
(i) We confirm the conclusion by Be16, Be17a and S17 that no trace of excess RGB population is seen around SECCO 1. Unfortunately, the GO-13735 images are so shallow that only the very tip of the RGB of metal-poor/intermediate populations at D' 17.0 Mpc can be (barely) reached, while the tip of metal-rich populations is below the detection threshold. Deeper photometry would allow to draw much firmer conclusions on this crucial is-sue. However, based on lack of detection also in diffuse light (S17), in the following, as a working hypothesis, we will as-sume that the star formation in SECCO 1 started <∼ 50 Myr ago.
(ii) The apparent lack of an RGB associated with SECCO 1 prevents a robust estimate of the distance of the system, that remains quite uncertain. For example a distance as large as D=30 Mpc, as unlikely as it may ap-pear, cannot be firmly excluded with the existing photomet-ric data. The luminosity of the O stars associated with the Hii regions broadly imply D >∼ 10 Mpc (see Sect.3.2). The strong deviation from the Hubble flow at distances larger than ' 3 Mpc (see, e.g. McConnachie 2012) remains the most robust argument for SECCO 1 to belong to the Virgo cluster (see B15b) and to the LVC, in particular (S15, B17a, S17).
(iii) We tentatively fit the CMD of SECCO 1 with two isochrones from the most recent PARSEC set (Marigo et al. 2017), with the mean metallicity of SECCO 1, as measured by Be17a, assuming D= 17.0 Mpc. The isochrones of age 4 Myr (light grey) and 35 Myr (dark grey) appear to nicely bracket the stellar population that can be unambiguously associated to SECCO 1. The comparison with the dSph and CF CMDs suggests that there is no compelling evidence for a significant population older than '35 Myr (but see S17). We confirm that there is no obvious difference in stellar pop-ulation between MB and SB (S17).
(iv) Reines et al.(2010) showed that the spectrum of the ionised gas can strongly affect the broadband photometry of massive stars within Hii regions. Both the continuum and strong emission lines can have a sizeable impact (note, e.g., that the F606W passband fully encloses both the [OIII] and Hα lines, that are seen to vary by a considerable amount from region to region in SECCO 1, see Be17a). Hence inter-preting the position in the CMD of stars associated with Hii regions (large blue circles in Fig.6) with stellar isochrones may lead to misleading conclusions. This kind of effect is likely at the origin of the fact that some stars associated with Hii regions have colors F 606W − F 814W ∼ 1.0, typi-cal of stars with Tef f∼ 4000 K, while the observed nebular
tempera-Figure 8. The newly identified candidate Hα emitter in the surroundings of SECCO 1. Left panel: GALEX NUV image (with a Gaussian smoothing of 3 px size applied) with the source (100038 / GALEX J122208.9+132962) labeled. A nearby bright star is also identified for reference, as well as SECCO 1 SB. Right panel: continuum-subtracted Hα image from our GTC-OSIRIS observations. In addition to 100038 and SB, here we labelled the possible companion source 100046. Note that there are sources (outside SB) that have a significant residual in the Hα image but have no counterpart at all in GALEX (and vice versa). In both images North is up and East to the left.
Table 3. Additional candidate Hii regions possibly associated to SECCO 1
ID GALEX ID RAJ 2000 DecJ 2000 magN U V ga ra Hα fluxb
deg deg mag mag mag 10−18erg cm−2s−1
100038 J122208.9+132952 185.5373356 13.4980710 23.64 ± 0.42 22.430 ± 0.076 22.133 ± 0.041 ' 210
100046 185.5365535 13.5015474 23.543 ± 0.087 22.994 ± 0.008 ' 140
aSextractor Kron magnitudes (MAG AUTO) from the deep images ofBellazzini et al.(2015a). bAssuming the same distance of SECCO 1, D=17.0 Mpc.
ture (Tef f>∼ 30000 K, see Sect.3.2). Since some contribution
from nebular spectra may affect also the stars not directly associated with a Hα peak detected in the MUSE data-cubes (due, e.g., to diffuse emission, see Fig.7), the overall CMD of SECCO 1 must be interpreted with some caution.
(v) We have marked with a skeletal triangle symbol the MUSE sources that are recognised by DOLPHOT as signif-icantly more extended than point sources of the same mag-nitude, according to the sharpness parameter. Most of them are fainter than F814W=26.5 while most of the brightest MUSE sources appear as normal stars. This implies that, in general, sources associated with Hii regions of SECCO 1 are unresolved in the available ACS images (i.e. are point-like) and blending is the most likely reason why many of the faintest sources appear slightly extended.
5 Hα IMAGING: SEARCHING FOR ADDITIONAL PIECES
It is likely that some of the candidate Hα-emitting sources selected in Sect.2.2from the GTC images are not related to SECCO 1. Background galaxies that happen to have strong emission in the wavelength window of the f657/35 filter are an obvious example. Since SECCO 1 sources are clearly seen also in GALEX NUV images from the GII survey, we cided to validate our candidates by asking that they are
de-tected also in these images. Indeed we found a source with strong Hα excess that is detected in the GALEX NUV im-age enclosing SECCO 1, ' 3.30 to the East-North-East of SB, as shown in Fig.8. The source (ID number 100038 in our catalog) is seen as extended both in the OSIRIS images and in the deep g,r images of the original SECCO survey (Bellazzini et al. 2015a). It has a nearby point-like compan-ion (100046) with significant Hα excess. Despite the lack of a GALEX counterpart we include also this source in the list of candidate additional Hii regions possibly associated with SECCO 1 (Tab.3) because of its extreme proximity to 100038 (12.700).
We derived a rough estimate of the Hα flux of 100038 and 100046 by comparison with SECCO 1 SB sources that have been measured in Be17a, assuming that the newly found candidates lie at the same distance. The derived fluxes are similar to those of confirmed SECCO 1 sources (Be17a). It is important to note that 100038 and 100046 lie just be-yond the circle of radius 4.00 centred on the centre of the OSIRIS field of view that is safe from any contamination of other interference orders and should be considered as the ac-tual operative field of view of OSIRIS tunable filters. More-over, all the known SECCO 1 sources that are seen in the OSIRIS images are not detected or very weak in the contin-uum images, while the contincontin-uum flux of the two candidates identified here is clearly detected. Still, especially given the
GALEX detection of 100038, they remain good candidate Hii regions.
While a spectroscopic follow-up is needed to ascertain the nature of 100038 and 100046, as well as other Hα sources lacking a GALEX counterpart, the overall result of our search for additional star forming regions associated to SECCO 1 is largely negative. In particular, we did not found any reliable candidate in the region suggested by Be16 as possibly hosting additional SECCO 1 sources (see their Fig. 14; the region is partially vignetted by the gap between the two chips of OSIRIS). The operative OSIRIS field sam-ples a projected circular area with radius ' 20 kpc around SECCO 1 at the distance of D=17 Mpc, still only one can-didate with properties analogous to known SECCO 1 pieces has been found.
6 THE NATURE OF SECCO 1
In Fig. 9 we show SECCO 1 MB and SB in the MV vs.
log(rh) relation for dwarf galaxies in the Local Volume (from McConnachie 2012) and in the baryonic Tully-Fisher rela-tion (seeTaylor et al 2013;Lelli et al. 2016;Iorio et al. 2017, and references therein). Only MB is included in the last dia-gram since only for this component A15 provide an estimate of Vrot based on the velocity gradient seen in Hi (see also
Be17a). The two diagrams show that, taking the observ-ables at face value, the structural and dynamical properties of SECCO 1 are in the range of those expected for a dwarf galaxy of the same baryonic mass.
On the other hand, the velocity field of the overall sys-tem (gas + stars), and the off-set in position between SB and AGC 229490 suggest that it is unlikely that the system is in dynamical equilibrium (see also Sect.7, below). If con-firmed, also the lack of an underlying old population would argue against the hypothesis that SECCO 1 is an ordinary, albeit very dark, dwarf galaxy (seeBekki 2015, for a theo-retical framework for the evolution of almost-dark galaxies similar to SECCO 1).
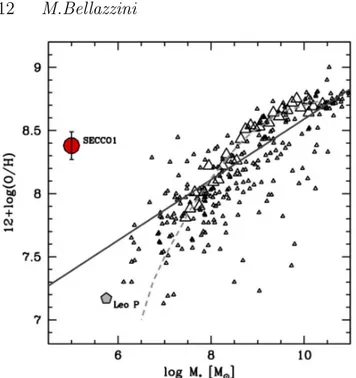
However, the strongest, and likely ultimate, argument against this hypothesis is provided by Fig10, which displays how far SECCO 1 is from the stellar mass - metallicity re-lation of normal galaxies (see B15a, Be17a, S17). It is clear that such a high (and extremely homogeneous) metallicity cannot arise from chemical evolution within a stellar sys-tem of such low mass. The stripping of some pre-enriched gas from, e.g., the disc of a spiral galaxy appears as the most likely origin for the system, as it would fit both the high metallicity and the (possible) lack of an old stellar population. There is no obvious way of distinguishing be-tween a tidal stripping or a ram pressure stripping event for the origin of SECCO 1. Indeed, as noted by B17a, the location of SECCO 1 in Fig. 10is typical of tidal galaxies (see, e.g.Sweet et al. 2014;Duc et al. 2014, and references therein). However, star-forming knots similar to SECCO 1 are sometime seen to originate in ram pressure stripping episodes within galaxy clusters (fireballs, see, e.g.,Yoshida et al 2012;Fumagalli et al. 2011;Kenney et al. 2014, refer-ences and discussion therein) and are predicted to occur in hydrodynamical simulations (Kapferer et al. 2009).
Figure 9. Upper panel: SECCO 1 MB and SB (large red filled circles) in the integrated absolute V magnitude vs. log of the half-light radius diagram. Small empty circles are dwarf galaxies in the Local Group fromMcConnachie(2012). As a proxy for the half-light radius for MB and SB we adopted half of the radial size reported (and defined) in Tab. 1. Lower panel: baryonic Tully-Fisher relation. Open squares are from Lelli et al. (2016) and filled squares fromIorio et al.(2017); the grey line is the best-fit for the accurate distances sample byLelli et al. (2016). The baryonic mass of SECCO 1 MB (large red filled circle) has been computed by summing the Hi mass corrected for the contribution of helium to the total gas mass according toLelli et al. (2016); the rotation velocity is from A15 that provide an estimate of this quantity only for MB.
6.1 Comparison with fireballs
Yoshida et al(2012) andHester et al.(2010); Fumagalli et al.(2011);Kenney et al.(2014) provide very detailed analy-ses of star-forming knots within Hα tails likely arising from strong ram-pressure stripping events in galaxy clusters. All these authors refers to these compact UV and Hα emitting blobs as fireballs. The similarities of SECCO 1 with fireballs was already briefly noted in B15a; here we make a more thorough comparison.
Yoshida et al(2012) show that fireballs have emission line-ratios typical of Hii regions and the same metallicity as the gas in the parent galaxy. They have typical sizes similar to SECCO 1 (1-2 kpc, but with rh ' 200 − 300 pc) and
similar or larger stellar masses (e.g., those considered by
Fumagalli et al. 2011, have 3.9 × 10⁴ M ≤ M? ≤ 5.0 ×
105
M ). Typical mean ages seem larger than SECCO 1, in the range ∼ 80 − 400 Myr, but (g-r) colors are similar to SECCO 1 and the presence of Hii regions imply very recent / ongoing star formation.Fumagalli et al.(2011) report a star formation rate of 10−3− 10−4
M yr−1, again pretty similar to SECCO 1.Kenney et al.(2014) report on the detection of a single unresolved Hi cloud with mass 3.7 × 10⁷ M , not clearly associated with an individual fireball but having
Figure 10. SECCO 1 as a whole into the stellar mass - metallicity relation. Small triangles are the z' 0 sample ofHunt et l.(2016), large triangles are fromAndrews & Martini(2013), the light grey long-dashed curve is the best-fit to the same data (from direct-method oxigen abundance estimates) extrapolated to low masses, from the same source. The dark grey continuous line is the stellar mass - metallicity relation from planetary nebulae byGon¸calves et al.(2014). SECCO 1 is represented as a large red filled circle.
systemic velocity similar to several Hii regions in the ram-pressure tail of IC 3418.
While many intrinsic properties of fireballs are quite similar to those of SECCO 1, there is also at least one re-markable differences. Fireballs are found within a few tens of kpc from their parent galaxy, within obvious cometary tail structures, and they ignited the star-formation as soon as they were stripped. On the other hand the cloud that formed SECCO 1 traveled for a long time away from its parent galaxy and it is currently forming star in conditions of extreme isolation.
6.2 Candidate parent galaxies
B17a proposed the interacting galaxy pair formed by NGC 4299 (Vh = +258 km s−1) and NGC 4294 (Vh =
+369 km s−1) (Chung et al. 2009) as a possible site of origin for the gas cloud that is now SECCO 1 9. The gas distri-bution of these galaxies shows signs of the effects of both ram-pressure and tides and their velocities are compatible with the range of LVC galaxies, but they are more than 500 kpc apart from SECCO 1, in projection (see Tab. 1). S17 noted that the M 86 (Vh= −183 km s−1) group is also
member of the Virgo LVC and it is located at ' 350 kpc, in projection, from SECCO 1. Galaxy-galaxy interactions are
9 All the parameters of candidate parent galaxies reported
in this section are taken from the SIMBAD database http://simbad.u-strasbg.fr.
Figure 11. Deep g-band image of the interacting group of dwarfs suggested as candidate site of origin of SECCO 1, from the Next Generation Virgo cluster Survey (Ferrarese et al. 2012). North is up and East is to the left. Density contours at arbitrary intensity levels have been drawn to put in evidence low surface brightness substructures, like the prominent tidal tail of VCC 322 or the very low SB dwarf to the West-South-West of VCC 334 (labelled). The white arrow shows the direction from VCC 322 towards SECCO 1 MB.
clearly ongoing and, in particular, M 86 is likely interact-ing with NGC 4438 (Vh = +98 km s−1) and both seems to
be undergoing ram-pressure stripping, with a short X-ray and Hα emitting tail generically pointing in the direction of SECCO 1. We note that in the surroundings of the same group an extended Hi tail is probably being stripped from NGC 4388 (Vh= +2555 km s−1) by its interaction with M 86
in a direction nearly perpendicular to that toward SECCO 1 (Oosterloo & van Gorkom 2005), showing that this environ-ment is particularly active as a source of stripped Hi clouds. In Fig.11we present a new promising candidate site for the origin of SECCO 1, the group of dwarf galaxies VCC 322 (Vh = −438 km s−1), VCC 319 (Vh = −209 km s−1) and
VCC 334 (Vh= −213 km s−1)10. These have velocities
typ-ical of LVC members and are likely mutually bound and interacting. Two of them are gas-rich and star-forming (VCC 322 and VCC 334) while the other is red and with no Hi detected. Their absolute integrated r magnitudes are all enclosed between Mr= −15.9 and -16.1. The stellar masses,
derived as inBellazzini et al. (2017) adopting the color vs. mass-to-light relations byRoediger & Courteau(2015), are M?' 9.0 × 10⁷ M , 3.8 × 10⁸ M , and 8.3 × 10⁷ M for
10 The NGSV image shown in Fig. 11reveal the presence of a
very low surface brightness amorphous galaxy located ' 7000to
the West-South-West of VCC 334. This may be an additional member of the group.
VCC 322, VCC 319, and VCC 334, respectively. In projected distance they are closer to SECCO 1 than the candidates de-scribed above (' 250 kpc, see Tab.1).
However, the feature that makes them particularly promising as candidate parents for SECCO 1 is their chem-ical composition. Both VCC 322 and VCC 334 have good spectra in the range 3800˚A <∼ λ<∼ 9200˚A from the Sloan Digital Sky Survey - Data Release 12 (Alams et al. 2015) with measured fluxes for several strong emission lines11. We estimated the oxygen abundance of these two galaxies in the same way as we did for SECCO 1 in Be17a, averaging the results of the indicators N2 and O3N2 from Pettini & Pagel(2004). For both galaxies we obtain 12 + log(O/H) = 8.3 ± 0.2, i.e. the same abundance of SECCO 1, within the uncertainties (that here include observational errors and un-certainties in the calibrations of the relations between oxy-gen abundances and strong-line indicators), and consistent with the range of abundances of galaxies with that stellar mass, albeit slightly on the high side, possibly suggesting that they indeed lost some mass in the past. Adopting the linear stellar mass - metallicity relation byGon¸calves et al.
(2014), shown in Fig. 10, 12 + log(O/H) = 8.10, 8.09, and 8.25 is obtained for VCC 322, VCC 334, and VCC 319, re-spectively.
A close two/three body encounter may have produced the required stripping episode. It is tantalising to imagine that the same episode transformed VCC 319 into the passive gas-less system that we see today.
7 HYDRODYNAMICAL SIMULATIONS OF A PRESSURE-SUPPORTED CLOUD
B17a estimated that if the gas cloud that gave rise to SECCO 1 detached from the interacting galaxy pair NGC 4299 + NGC 4294, it should have travelled for at least ∼ 1.2 Gyr within the LVC ICM to reach its current position, given the projected distance to the pair and the radial ve-locity difference. Analogous computations imply travel times > 1.0 Gyr also from the other proposed parent galaxies or galaxy groups. Hence, the extreme isolation of SECCO 1 implies that the system has survived within its environment for a long time before the onset of star formation. Is this occurrence realistic? Are such kind of clouds expected to have lifetimes longer than 1 Gyr? To attempt an answer to the last question we performed a two-dimensional high-resolution hydrodynamical simulation of a cold gas cloud travelling through a hot and low-density ambient medium, with the typical features of the LVC ICM.
7.1 Simulation set up
The simulation was carried out with the ATHENA code (Stone et al. 2008), using a two-dimensional Cartesian geom-etry and a fixed grid with size 40 kpc × 40 kpc and spatial resolution 5 pc × 5 pc. We included a module for the clas-sical thermal conduction (Spitzer 1956) with an efficiency
11 See
dr12.sdss.org/spectrumDetail?plateid=1766&mjd=53468&fiber=56 and dr12.sdss.org/spectrumDetail?plateid=1766&mjd=53468&fiber=50 for VCC 322 and
VCC 334, respectively.
of 10% (accounting for the presence of tangled magnetic fields) and a module for radiative gas cooling and heating in the presence of collisional ionisation, and photoionisation from an uniform UV background at redshift z = 0. Cooling and heating rates have been obtained through the CLOUDY spectral synthesis code (Ferland et al. 2013) and the spec-trum of the background radiation field has been taken from
Haardt & Madau(2012). The temperature cutoff for radia-tive cooling is 103 K, then molecular cooling is not included in our simulation. For further details on the hydrodynam-ical treatment of thermal physics we refer toArmillotta et al.(2016,2017). Moreover, we used an adaptive and mov-ing grid that follows the cloud durmov-ing its own motion. We neglected the presence of an external gravitational poten-tial and self-gravity inside the cloud (we justify the latter assumption in Sec.7.2).
The parameters of the simulation are listed in Table4. The temperature of the hot gas, Thot = 5 × 10⁶ K, was
calculated through the following formula:
Thot=
3σ2rµhotmp
2kB
, (1)
where µhot ' 0.59 is the mean molecular weight of the hot
gas, mp the proton mass, kB the Boltzmann constant and
σr∼ 208 km s−1is the radial velocity dispersion of the ICM
in LVC (Boselli et al. 2014). The hot gas metallicity was set to 0.1 Z , according to the metallicity of the ICM at
1.1 Mpc from the center of the Virgo cluster (Urban et al. 2011), where 1.1 Mpc is the projection on the sky of the physical distance between NGC4216, the central galaxy of LVC, and M87, the central galaxy of Cluster A. Finally, the numerical density of hot gas was set to 2.5×10⁻⁵cm−3. This value was derived from the total mass (dark and baryonic matter) density in LVC. For this calculation, we assumed that the hot gas density distribution follows the dark matter density profile given byNavarro et al.(1996):
ρ(r) = ρcr ∆vir 3 cvir f (cvir) r3s r(r + rs)2 , (2)
where ρcr is the critical density of the Universe and ∆vir is
the virial overdensity provided by the dissipationless spheri-cal top-hat collapse. In the ΛCDM cosmologispheri-cal model with Ωm = 0.3 the value of ∆vir is ∼ 340 at z = 0 (Bryan & Norman 1998). Moreover, cviris the concentration
parame-ter associated to the mass, Mvir, contained within the virial
radius, rvir, rs ≡ rvir/cvir is a scale radius and f (cvir) a
function of cvir (seeDuffy et al. 2008, for definitions of cvir
and f (cvir) at redshift z = 0). The virial mass of LVC,
Mvir ∼ 1.2 × 10¹³ M , has been estimated through the
virial theorem:
Mvir=
3rvirσr2
G (3)
where G is the gravitational constant and the virial radius, rvir, is defined as the radius of a sphere within which the
av-erage mass density is ∆virρcr. By using Eq.2, we calculated
the total mass density, ρ(r), at 430 kpc from the center of LVC, where 430 kpc is the projection on the sky of the phys-ical distance of SECCO 1 from the central galaxy of LVC. The mass density of hot gas was estimated by multiplying
Table 4. Initial parameters of the simulation: hot gas temperature Thot, hot gas density nhot, hot gas metallicity Zhot, cloud temperature
Tcl, cloud density ncl, cloud metallicity Zcl, cloud radius Rcl, cloud velocity vcl.
Thot nhot Zhot Tcl ncl Zcl Rcl Mcl vcl
(K) (cm−3) (Z
) (K) (cm−3) (Z ) (kpc) (M ) ( km s−1)
5 × 10⁶ 2.5 × 10⁻⁵ 0.1 5 × 10³ 2.6 × 10⁻² 0.5 3.7 9.4 × 10⁷ 200
Figure 12. Temperature (top panels) and number density (bottom panels) snapshots of the simulation at t=250 Myr (left panels), t=500 Myr (middle panels) and t=1 Gyr (right panels) for the 2D simulation.
ρ(r = 430 kpc) by the universal baryon fraction (∼ 0.17, e.g.,Komatsu et al. 2009) by the expected fraction of hot gas (∼ 0.3,Dai et al. 2010).
For the cloud temperature we adopted a value of 5000 K, according to the mean temperature of the diffuse Hi (e.g., Wolfire et al. 2003; Roy et al. 2013). The cloud metallicity was set to 0.5 Z , following B17a. The cloud
velocity with respect to the surrounding medium is set at 200 km s−1, similar to the velocity dispersion of the LVC (Boselli et al. 2014). The cloud radius is 3.7 kpc (A15). We note that the cloud is fully resolved since its radius is almost three orders of magnitude larger than the res-olution of our spatial grid. From the radius and the to-tal Hi mass, we derived the Hi numerical density of the cloud, ncl,HI ' 2.9 × 10⁻³ cm−3. To calculate the total
numerical density, ncl, we divided ncl,HI by µcl' 0.71, the
mean molecular weight of the cloud, and XHI/A ' 0.16,
the mass abundance of Hi with respect to all elements at T = 5000 K and Z = 0.5 Z . Both these values have
been obtained through our CLOUDY modelling. We found ncl' 2.6 × 10⁻² cm−3. We note that this value of density
almost corresponds to the density required for the cloud to be in pressure equilibrium with the ambient medium. Given this density and including the contribution of neutral and ionized hydrogen, helium and metals, the total mass of the cloud is Mcl= 9.4 × 10⁷ M . The simulation ran for 1 Gyr.
7.2 Results
Figures 12 and 13 display the results of our simulation. Fig.12shows the temperature (top panel) and number den-sity (bottom panel) distributions on the grid at different simulation times. The cloud evolution proceeds quite slowly during 1 Gyr. Until 250 Myr, the initial spherical cloud is
Figure 13. Evolution of the cold gas (T < 2 × 10⁴ K) fraction
as a function of time in the 2D simulation.
completely intact, and all its features (temperature, density and radius) remain nearly constant. The only difference is the presence of a parabolic layer around the cloud, charac-terized by temperatures that slowly increase from the cloud to the ambient temperature. This effect is explained by the presence of thermal conduction, which smooths the temper-ature gradients at the interface between cold and hot gas, leading the gas cloud to evaporate. After 250 Myr, hydro-dynamical instabilities start to develop at the edge of the cloud, slowly causing its deformation. Moreover, the cloud expands - with an average radius that increases by more than a factor two after 1 Gyr - decreasing its density but keeping its temperature nearly constant. Indeed, in order to preserve pressure equilibrium with the ambient medium, the cloud continuously adapts to the surrounding thermo-dynamical changes. The gas temperature around the cloud decreases both because thermal conduction makes the tem-perature gradient more and more smooth, and because the gas lost from the cloud quickly evaporates creating a wake at intermediate temperature. As a consequence, the cloud density decreases, while its temperature remains constant due to thermal effects, as we discuss later.
Fig.13shows the time evolution of the mass of cold gas at T < 2 × 10⁴K. Above such a temperature, the hydrogen
is generally completely ionised. The loss of cold gas mass from the cloud is negligible, it is ∼ 6% of the initial mass of the cloud after 1 Gyr.
The cloud survival strongly depends on the efficiency of ram pressure exerted by the ambient medium. External ram pressure slows down the cloud during its motion, trig-gering the formation of hydrodynamical instabilities and the subsequent cloud destruction. However, the efficiency of ram pressure decreases with increasing the cloud mass. The time scale associated to this phenomenon is the so-called drag time (e.g.,Fraternali & Binney 2006):
tdrag=
Mcl
vclσρhot
, (4)
where σ ' πRcl2is the cross section of the cloud. In our case,
tdrag∼ 28 Gyr, more than two orders of magnitude larger
than the simulation time. The relatively large mass of the cloud and the low density of the surrounding medium make the ram pressure effect very weak and justify its solid body-like behaviour. The low density of the medium is justified by the fact that the cloud is located at the edges of the LVC halo. Indeed, the distance of the cloud from the center of LVC, 430 kpc, is slightly larger than the virial radius, ∼ 400 kpc (see Eq.3).
The cloud is also stabilised by thermal effects. Ac-cording to our CLOUDY cooling function, T ∼ 6000 K is the equilibrium temperature between radiative cooling and heating at numerical density n ∼ ncl. Moreover, the cloud
evaporation driven by thermal conduction is very slow. Ac-cording to the classical theory, the evaporation time of our cloud is ∼ 24 Gyr (Cowie & McKee 1977, where we consid-ered an efficiency of thermal conduction of 10%), once again two orders of magnitude larger than the simulation time.
In order to evaluate if the presence of self-gravity could affect our results, we calculated the virial ratio of the cloud. The virial ratio is a dimensionless value that measures the gravitational binding of a cloud: clouds with virial ratio lower than 2 are gravitationally bound. For our cloud, the virial ratio is ∼ 4, indicating that the cloud is pressure-supported and globally stable against the collapse. The main effect that the presence of self-gravity could have on the global evolution of the cloud should be to further stabilize it against the formation of hydrodynamical instabilities ( Mur-ray et al. 1993).
Given all the above considerations, we can conclude that gas-clouds similar to SECCO 1 can be long-lived in the LVC environment and can travel nearly intact for hundreds of kpc from the site of their formationBurkhart & Loeb(see also2016). The results of the N-body/hydrodynamical sim-ulations byKapferer et al.(2009, discussed in more detail below) also suggest that cold gas clouds can be long lived in the cluster medium, as ram-pressure stripped gas clumps are still alive at the end of their simulation, 0.5 Gyr after the stripping event. It is also interesting to note that the friction of the ICM has only minor effects. The systemic velocity of the cloud decreases by just ' 8.0 km s−1in the 1 Gyr of our simulation.
7.3 A lower resolution simulation in three dimensions
As an independent validation of the results of our 2D sim-ulation, we ran a lower resolution, three dimensional hy-drodynamic simulation of a cold gas cloud flowing in a hot medium, adopting a very similar set-up. We used a cus-tomised version of the grid-based, Adaptive Mesh Refine-ment (AMR) hydro-code RAMSES (Teyssier 2002). In our three-dimensional Cartesian Grid, the computational box has a volume of L3
box= (40 kpc)3. Since a resolution similar
to that of the 2D simulation is computationally prohibitive, we run a small series of 3D simulations at increasing resolu-tions, starting from the same initial condiresolu-tions, and checked numerical convergence in order to assess the robustness of our results.
Another difference with respect to the 2D setup con-cerns the grid, which in this case is not fixed. We exploit
Figure 14. Temperature (top panels) and number density (bottom panels) snapshots of the simulation at t=250 Myr (left panels), t=500 Myr (middle panels) and t=1 Gyr (right panels) for the 3-D simulation.
Figure 15. Evolution of the cold gas (T < 2 × 10⁴ K)
frac-tion as a funcfrac-tion of time in the 3D simulafrac-tion. The results from simulations with three different values for the maximum resolu-tion are shown, as a convergency test. Dotted-dashed cyan line: levelmax = 7, dashed blue line: levelmax = 8, black contimuous line: levelmax = 9. The corresponding maximum resolution is 312 pc, 156 pc, and 78 pc, respectively.
instead the reduced computational cost of the AMR tech-nique. Initially, the refinement criterium is geometry-based: maximum resolution12 is assigned to a sphere of size ∼ 8 kpc, chosen to be larger than the whole cloud. The result-ing initial grid is nested, with the computational region lo-cated outside the maximum resolution sphere refined at in-termediate resolution; the minimum resolution, ∼ 2.5 kpc, is adopted in the outermost regions of the box. At later times, the refinement strategy is discontinuity based, i.e. resolution is increased in regions presenting a steep density contrast.
As initial conditions, in a reference frame whose origin is placed at the centre of the cold gas cloud, the hot gas is moving along the x-axis at a velocity of 200 km/s. The cold cloud is assumed to be homogeneous and characterised by a uniform temperature, as the external, hotter medium, representing the ICM. The initial parameters characterising both the cloud and the ICM are the same as the ones used in the 2D simulation (Table4).
Also in this case, radiative cooling and heating are taken into account. The cooling function implemented in RAM-SES takes into account both atomic (i.e., due to H and He) and metal cooling (see Few et al. 2014). The contribution from metals at temperatures above 104 K is accounted for through a fit of the difference between the cooling rates cal-culated at solar metallicity and those at zero metallicity us-ing the photoionisation code CLOUDY (Ferland et al. 1998).
12 The maximum resolution can be computed as L box ×
0.5levelmax ∼ 78 pc, where levelmax = 9 is the maximum
At lower temperatures, metal fine-structure cooling rates are fromRosen & Bregman (1995). The effects of a UV back-ground are also taken into account. The RAMSES cooling routine includes functional fits for the photo-heating and photoionisation rates of the Haardt & Madau (1996) ion-izing background spectrum, as formulated inTheuns et al.
(1998). The adopted normalization of the UV flux and the slope of the spectrum are the same as used for the 2D simu-lation. The minimum temperature is set to Tmin= 5000K.
In our 3D simulations, we do not take into account thermal conduction.
Two-dimensional density and temperature maps of the 3D simulations are shown in Fig. 14 at the same time-steps displayed in Fig. 12 for the 2D simulation, to ease a direct comparison. Each map represents a section of the computational domain in the x-y plane.
The lack of thermal conduction makes the cloud much more prone to the effects of Kelvin-Helmholtz instabilities, leading to a faster evolution, with respect to the 2D sim-ulation (as expected according to Armillotta et al. 2016), with significant morphological changes. Throughout the evo-lutionary time considered here, from the initially spherical shape, the cold cloud evolves into a typical umbrella-like or jellyfish-like shape, already seen in previous studies (e.g.,
Marinacci et al. 2011; Kwak et al. 2011; Scannapieco & Br¨uggen 2015).
At t = 0.5 Gyr, the x-y cross section of the cloud has significantly thinned. Cold gas is being continuously ablated from the cloud and mixed with the hotter ICM. As visible in the density and temperature maps, the material present at the upper and lower edges of the cloud appears stretched outwards. The thin, extended filaments driven by the shear instabilities cause the coolest gas to extend for nearly 20 kpc along the y-direction. As a consequence of such effects, the originally cold matter of the cloud undergoes a substantial re-distribution in that, beside being reduced to a thinner shell, the volume occupied by the cold gas also increases along the z-direction. This goes along with a strong decrease of the central density. At this time, The wake of the cloud is still tenuous (n ≤ 10−4cm−3) and hot (T ∼ 106.5 K).
At t= 1 Gyr, the turbulent mixing of the cold and hot layers in the wake has lead to an increase of the filling factor of hot gas at T ∼ 106 K. Although the distribution of the coolest gas is still preserving a substantial degree of symme-try with respect to the x- axis, at this epoch its stretching is extreme. A prominent, elongated bar is visible in the front of the cloud, whereas the average density of the wake has globally increased. Similar protruding structures in the front of cold clouds moving fast in a very hot medium have been found also in previous 2d (Kwak et al. 2011) and 3d ( Scan-napieco & Br¨uggen 2015) hydrodynamic studies, as well as the presence of a few cold cloudlets detaching from the wake. However, Fig.15shows that, notwithstanding the con-siderable morphological evolution, a large fraction (' 75%) of the original cold gas is preserved. Despite the notori-ously greater difficulty in obtaining numerical convergence in AMR simulations than in uniform grid ones (e.g.,Calura et al. 2015and references therein), Fig.15shows also that the cold mass decrease is rather robust with respect to res-olution.
Hence, the results of the 3D simulations confirm that under the conditions chosen in this work, after 1 Gyr the
majority of the initial cloud mass is still cold. The 2D and 3D simulations lead to the same verdict, i.e. the considered gas cloud can survive a travel of 1 Gyr (corresponding to '200 kpc in our simulations) through an ambient mimick-ing the LVC, loosmimick-ing only between 5% and 25% of the origi-nal cold gas. We note also that, convolving the end-state of both simulations with the beam the VLA data by A15, to simulate their observations, the resulting images are broadly compatible with the observed Hi density maps presented by these authors.
8 STAR FORMATION IN STRIPPED CLOUDS Having established that a compact pressure-supported cloud similar to SECCO 1 can probably survive > 1 Gyr long journeys within the Virgo ICMs it remains to be explored what may have triggered the onset of the current episode of star formation just a few tens of Myr ago.
In Fig.16we plot the gaseous components of MB and SB in the size - column density diagram, together with other Hi clumps with or without detected star-formation inside, following Burkhart & Loeb (2016). These authors observe that these pressure-supported clouds are near the critical density threshold to form molecular hydrogen (4-10 M pc−2) and, consequently, are likely on the verge of igniting star formation (indeed, some of them are already forming stars). They suggest that pressure fluctuations and tidal shear may drive the clouds to cross the critical density line, eventually triggering a star formation event.
We note that SECCO 1 MB and SB are not far from the other dark or almost-dark Hi clouds plotted in Fig.16
but lie below the generally accepted critical density lines. However this may be due to the smearing effect of the VLA beam of A15 observations. The two gas clouds associated to SECCO 1 may be fragmented in smaller sub-clumps where the actual density is, in fact, above the threshold. The ex-treme isolation of SECCO 1 makes tidal shear unlikely to have triggered star formation in this case and it is unclear what can cause a significant pressure fluctuation in the sur-roundings of the system. Perhaps, during the travel, the den-sity of the cloud may slowly increase, finally leading to the critical conditions to ignite star formation. This should be investigated with future simulations including self-gravity.
In this context, it is worth considering the relevant results of the thorough study by Kapferer et al. (2009). These authors performed N-body/hydrodynamical simula-tions, with radiative cooling, star formation and stellar feed-back, of the ram pressure stripping of a large disc galaxy in a cluster environment. The final outcome of the simulations varies depending on the relative velocity of the galaxy and the ICM and on the density of the ICM, but, in general they find (a) that the gas stripped from the disc can reach dis-tances of ' 400 kpc from the parent galaxy in just 500 Myr, (b) that star formation occurs at any time in the compact gas cloud that forms in this extended ram pressure wake, and (c) that some of these clouds, at any distance from the parent galaxy along the wake, are still forming stars in the last 50 Myr of the 500 Myr-long simulation, and hence may