R E S E A R C H
Open Access
Genomic analysis of the domestication and
post-Spanish conquest evolution of the
llama and alpaca
Ruiwen Fan
1†, Zhongru Gu
2,3,4†, Xuanmin Guang
5†, Juan Carlos Marín
6†, Valeria Varas
7, Benito A. González
8,
Jane C. Wheeler
9, Yafei Hu
5, Erli Li
5, Xiaohui Sun
5, Xukui Yang
5, Chi Zhang
5, Wenjun Gao
1, Junping He
1,
Kasper Munch
10, Russel Corbett-Detig
11, Mario Barbato
12, Shengkai Pan
2,3, Xiangjiang Zhan
2,3,13*†,
Michael W. Bruford
3,14*†and Changsheng Dong
1*†* Correspondence:[email protected];
†Ruiwen Fan, Zhongru Gu, Xuanmin Guang, and Juan Carlos Marín are joint first authors.
†Xiangjiang Zhan, Michael W Bruford, and Changsheng Dong are joint senior authors.
2
CAS Key Lab of Animal Ecology and Conservation Biology, Institute of Zoology, Chinese Academy of Sciences, Beijing, China 3
Cardiff University– Institute of Zoology Joint Laboratory for Biocomplexity Research, Chinese Academy of Sciences, Beijing, China 1
College of Animal Science and Veterinary Medicine, Shanxi Agricultural University, Taigu, Shanxi, China
Full list of author information is available at the end of the article
Abstract
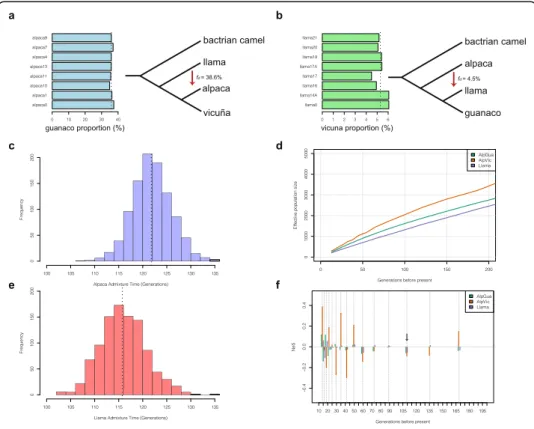
Background: Despite their regional economic importance and being increasingly reared globally, the origins and evolution of the llama and alpaca remain poorly understood. Here we report reference genomes for the llama, and for the guanaco and vicuña (their putative wild progenitors), compare these with the published alpaca genome, and resequence seven individuals of all four species to better understand domestication and introgression between the llama and alpaca. Results: Phylogenomic analysis confirms that the llama was domesticated from the guanaco and the alpaca from the vicuña. Introgression was much higher in the alpaca genome (36%) than the llama (5%) and could be dated close to the time of the Spanish conquest, approximately 500 years ago. Introgression patterns are at their most variable on the X-chromosome of the alpaca, featuring 53 genes known to have deleterious X-linked phenotypes in humans. Strong genome-wide
introgression signatures include olfactory receptor complexes into both species, hypertension resistance into alpaca, and fleece/fiber traits into llama. Genomic signatures of domestication in the llama include male reproductive traits, while in alpaca feature fleece characteristics, olfaction-related and hypoxia adaptation traits. Expression analysis of the introgressed region that is syntenic to human HSA4q21, a gene cluster previously associated with hypertension in humans under hypoxic conditions, shows a previously undocumented role for PRDM8 downregulation as a potential transcriptional regulation mechanism, analogous to that previously reported at high altitude for hypoxia-inducible factor 1α.
Conclusions: The unprecedented introgression signatures within both domestic camelid genomes may reflect post-conquest changes in agriculture and the breakdown of traditional management practices.
Keywords: Introgression, Domestication, Llama, Alpaca, Spanish conquest
© The Author(s). 2020 Open Access This article is licensed under a Creative Commons Attribution 4.0 International License, which permits use, sharing, adaptation, distribution and reproduction in any medium or format, as long as you give appropriate credit to the original author(s) and the source, provide a link to the Creative Commons licence, and indicate if changes were made. The images or other third party material in this article are included in the article's Creative Commons licence, unless indicated otherwise in a credit line to the material. If material is not included in the article's Creative Commons licence and your intended use is not permitted by statutory regulation or exceeds the permitted use, you will need to obtain permission directly from the copyright holder. To view a copy of this licence, visithttp://creativecommons.org/licenses/by/4.0/. The Creative Commons Public Domain Dedication waiver (http://creativecommons.org/publicdomain/zero/1.0/) applies to the data made available in this article, unless otherwise stated in a credit line to the data.
Background
South and Central America encompasses one of the most important cradles of domestica-tion, giving rise to key crop plants and domesticated animals including turkey, guinea pig, and the region’s key domestic herbivores, the llama and alpaca [1]. These South American camelids (SACs) attained central importance in the economy of the Andean region, with the llama used as a pack animal, facilitating the expansion of the Inca Empire [2], and the alpaca selected to produce some of the world’s finest wool [3]. Both putative wild ances-tors (the guanaco and vicuña) remain extant, with SACs classified in two genera, each containing two species: Lama guanicoe (guanaco) and L. glama (llama), and Vicugna vicugna(vicuña) and V. pacos (alpaca) [4,5]. The alpaca has been variously hypothesized as descending from the guanaco, the vicuña, and as a llama/vicuña hybrid, while the llama is generally thought to originate from the guanaco [4]. These hypotheses stem from stud-ies of morphological and behavioral variations in extant animals, while archaeozoological evidence places domestication of the alpaca from the vicuña in the wet puna ecosystem of Peru’s central Andes, 6000–7000 years ago, and domestication of the llama from the gua-naco in the dry punas of southern Peru, Chile, and Argentina [6]. Previous molecular data,
while confirming that the genera Lama and Vicugna are valid and separated 2–3 MYA
(million years ago), have documented extensive hybridization among modern domestic SACs, with microsatellite and mitochondrial DNA analysis suggesting that the llama is descended from the guanaco and the alpaca is descended from the vicuña, and the alpaca has been reclassified from Lama pacos to Vicuna pacos [4,5]. Recent Y-chromosome ana-lysis has recapitulated this result [7]. A genomic perspective on this problem is urgently needed, however, because previous analysis used a few neutral genetic markers, represent-ing only a very small fraction of the genome, and was incapable of accurately assessrepresent-ing genetic diversity, genomic regions under selection and systematically evaluating genome-wide introgression in wild and domestic forms.
We generated de novo genomes and transcriptomes for vicuña, llama, and guanaco, adding to a reference genome previously produced for alpaca [8] and resequenced the genomes of seven further individuals of each species. We aimed to elucidate the follow-ing for the llama and alpaca: (1) their evolutionary origins; (2) the level, origin, distribu-tion of introgression in both species; (3) their demographic history from domesticadistribu-tion to the present day, including the Spanish conquest; and (4) genes selected during do-mestication and potentially as a result of admixture, and their implication for the llama and alpaca’s unique adaptations.
Results
De novo sequencing, assembly, and resequencing
Genomes were sequenced to 129x, 108x, and 102x coverage for L. guanicoe, V. vicugna,
and L. glama, respectively (Additional file 1: Supplementary Text 1a, b and
Add-itional file1: Table S1); all these genomes were assembled by SOAPdenovo [9] and featur-ing contig and scaffold N50 lengths of 91.6 kb and 14.6 Mb for L. guanicoe, 91.1 kb and 6.15 Mb for V. vicugna, and 44.1 kb and 3.2 Mb for L. glama (Additional file1: Table S2a-c). Each species’ blood was used for RNA sequencing and those assembled unigene align-ment showed that the assemblies covered more than 82% of unique genes for each species (Additional file 1: Table S3). Benchmarking Universal Single-Copy Orthologs (BUSCO)
assessment showed that > 93.7% of core genes [10] could be aligned to the SAC genomes (Additional file1: Table S4). The three de novo genomes were all inferred to be ~ 2.6 Gb (Additional file1: Table S5 and Figure S1) and share high synteny with the human and V. pacosreference genomes (coverage rate 87%; Additional file1: Table S6), with a relatively low rate of genomic rearrangement. We identified 21,435 protein-coding genes in the ge-nomes of L. guanicoe, 21,757 in V. vicugna, and 21,460 in L. glama, respectively (Add-itional file1: Table S7a-c). BUSCO assessment showed that the large majority present in the predicted gene sets (over 78%). In total, > 92% of genes was functionally annotated. Repeat sequences were inferred to comprised 33.1% of the genome in L. guanicoe, 32.7% in V. vicugna, and 27.02% in L. glama, lower values than in most mammals [11], although such sequences were difficult to assemble most likely due to the limitations of short-read sequencing. Resequencing of seven individuals per species (Additional file 1: Figure S2; Table S8) yielded an average sequence depth of 16-fold after filtering (31–45 Gb, Add-itional file 1: Table S9). Resequencing uncovered 21.3 million SNPs and a heterozygous SNP rate of 0.0030 for alpaca, 25.2 million and 0.0023 for vicuña, 16.7 million and 0.0018 for guanaco, and 16.1 million and 0.0020 for llama, indicating a higher overall SNP rate for the Vicugna lineage.
Phylogenetic, admixture, and lineage sorting analysis
A neighbor-joining tree based on 5,901,447 SNPs (Fig. 1a upper) showed two major
SAC lineages with 100% bootstrap support, comprising vicuña and alpaca in one group (genus Vicugna) and guanaco and llama in the other (genus Lama). Within Lama, L. g.
guanicoe formed a single group, whereas two L. g. cacsilensis (guanaco 22 and 24)
grouped with L. g. guanicoe, the other two (guanaco138DA and 8) grouped with all llamas. Guanaco 22 and 24 were collected at Paposo and Ovalle, Chile, respectively 7° and 11° latitude further south than guanaco138DA and 8, collected in Putre, northern Chile (Fig.1b; Additional file1: Figure S2). Guanaco 22 and 24 are therefore likely mis-labelled as L. g. cacsilensis since they were collected within the “dry diagonal,” an arid
region and known biogeographic transition zone in the Andean chain [12, 13]. All
llamas grouped with the two north Chilean L. g. cacsilensis, supporting the hypothesis that llamas were domesticated from within the L. g. cacsilensis gene-pool. In contrast, both currently described vicuña subspecies clustered separately, with 100% bootstrap support. V. v. mensalis were sampled in northern Chile and Peru, whereas V. v. vicugna were sampled in Chile and Argentina. Despite clustering within Vicugna, and with 100% bootstrap support, the alpacas did not cluster within either the V. v. mensalis or V. v. vicuna groups, instead forming a set of apparently divergent lineages with longer branch lengths, nested within the broader Vicugna cluster. However, after Local Ances-try Inference (LAI)-assisted removal of all alpaca genomic regions not having signifi-cant vicuña ancestry (Fig. 1a lower, see below), the relative position of alpaca changed to group with V. v. mensalis, consistent with a northern origin of domestication of the alpaca as previously reported [3,7].
Admixture cross-validation analysis showed the optimal grouping to be k = 2 (CV = 0.593, 0.620, 0.657, 0.744 for k = 2, 3, 4, 5 respectively). At k = 2, the results were broadly concordant with the neighbor-joining tree (Fig. 1c), with llama clustering with guanaco and alpaca with vicuña. However, alpaca showed evidence for strong
admixture with approximately 36% of genomic SNPs detected in the genomes of all indi-viduals analyzed clustering with guanaco/llama. At k = 4 (Fig.1c), the signal of admixture in the alpaca was still strongly evident, with the remainder of the genome clustering with V. v. mensalis, in accordance with Fig.1a lower, and evidence of unidirectional admixture from llama to alpaca and from V. v. vicuna into mensalis. In addition, also in support of the neighbor-joining results, L. g. cacsilensis samples guanaco138DA and 8 clustered with all llamas (albeit with some evidence of admixture). Treemix results (Additional file1: Fig-ure S3) confirmed both the close relationship between V. pacos and V. v. mensalis and the unidirectional gene flow between llama and alpaca.
ABBA-BABA analysis produced a significantly positive D value for ((alpaca, vicuña), llama, bactrian) of 0.565 ± 0.006 (two-tailed z-test, P < 0.01), indicating strong genome-wide introgression between llama and alpaca, recapitulating the results of the ADMIX-TURE and Treemix analysis. In contrast, we found a significantly negative D value for ((guanaco, llama), vicuña, bactrian) of − 0.185 ± 0.006 (two-tailed z-test, P < 0.01),
Fig. 1 Evolutionary relationship among South American camelids (SACs). a Neighbor-joining (NJ) trees by using all whole-genome data (top) and by using loci located in alpaca regions of highest vicuña ancestry (bottom). b Map with current distributions of SACs and sample location in this study. Open and solid dots indicate sampled localities of vicuña and guanacos respectively. c Model-based clustering of 32 SACs performed using ADMIXTURE with the number of ancestry kinships (k) set to 2, 3, or 4. Each vertical bar in proportions is corresponding to its proportion of genetic ancestry from each of these ancestral populations. The names of species and samples are shown in top and below of figure respectively
suggesting the introgression from alpaca into llama was significantly lower (t-test, P < 0.001). The introgression proportion identified by using fd analysis was ~ 38.9% from
llama to alpaca and ~ 4.5% in the opposite direction (Fig. 2a, b; Additional file 1: Table S10). Local Ancestry Inference estimates of ancestry proportions for llama and alpaca
were highly concordant with fdand ADMIXTURE results, with approximately 94.5% of
llama ancestry and 36% of alpaca ancestry inferred to have originally originated from guanaco/llama and 5.5% and 64% derived from vicuña/alpaca, respectively (Fig. 2a, b). We identified 290 high probability llama ancestry introgressed windows (top 1%, size = 100 kb) using LAI or fd, comprising 225 and 236 genes, respectively (Fig. 3a;
Add-itional file 1: Table S11). There were 87 windows (comprising 101 genes) detected in
common by both methods (Additional file 1: Table S11), which were investigated for
GO terms (Table 1). Using the same approach, we identified 247 high alpaca ancestry regions using LAI or fd, comprising 335 and 287 genes, respectively (Additional file 1:
Table S11; Figure S4) with 113 regions (192 genes) detected in common
(Add-itional file 1: Table S12), which were also investigated for GO terms. GO analysis
(Table 1) identified regions including olfactory receptor genes, putative blood pressure markers, fleece quality and color genes (bidirectional introgression), and disease resist-ance/susceptibility (unidirectional introgression).
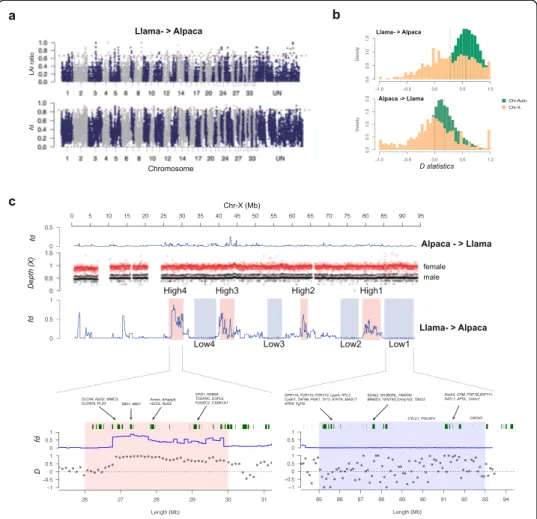
We examined introgression patterns along the X-chromosome in comparison to the autosomes. For segments where we could unambiguously identify contiguous X-chromosomal regions, we found relatively low D and fdvalues (see Fig. 3b) of 0.278 ±
0.414 (s.d) and − 0.001 ± 0.435 for llama to alpaca and alpaca to llama, respectively, compared to 0.560 ± 0.203 and 0.172 ± 0.234 for the autosomes (t-tests for both compari-sons P < 0.001; Fig. 3b) allowing us to infer significantly lower introgression into the X-chromosome, implying an adaptive cost of introgression between llama and alpaca as has been seen in other domestic hybrids [27] or strong ancestral selective sweeps in the re-gion, inhibiting our ability to detect introgression because of low divergence [28]. Inferred introgression was especially variable on the X-chromosome, which, after filtering for puta-tive Y-chromosome and pseudo-autosomal regions (PARs), featured some regions of high introgression (four regions comprising 79 genes) but also regions of almost zero introgres-sion (four regions comprising 116 genes) (Fig.3c). The eight regions contained genes with known deleterious or lethal X-linked effects in humans or mouse (25 genes in low intro-gression regions and 28 in high regions). For example, the deleterious mutations in the
PTCHD1(patched domain containing 1) gene have been described in male patients with
X-linked autism spectrum disorder (ASD) and/or intellectual disability (ID) [29, 30], which further been found that the deficiency of PTCHD1 could also induce excitatory synaptic and cognitive dysfunctions in mouse [31]. Beyond it, eight genes feature domin-ant inheritance, five of unknown or variable inheritance and 12 recessive for low regions and eight, nine, and 11 such genes found in highly introgressed regions (Additional file1: Table S13). Taken together, these results suggest that selection could be limiting hetero-gametic introgression of deleterious variants between Lama and Vicugna in domestic crosses.
Analysis of incomplete lineage sorting (ILS) indicated a higher ILS rate for llama-guanaco-alpaca (0.275) than for llama-guanaco-vicuña (0.157), which in the absence of admixture would be expected to give similar estimates if the alpaca is descended from the vicuña. Within each species trio, the two different ILS topologies would also be
expected to appear in equal proportions in the absence of admixture. However, we found a larger proportion of ((llama, alpaca), guanaco) (0.1480326) compared to ((gua-naco, alpaca), llama) ILS (0.124) and a larger proportion of ((llama, vicuña), guanaco) (0.092) compared to ((guanaco, vicuña), llama) ILS (0.062). This larger proportion of ILS involving llama further suggests admixture between alpaca and llama.
Using LAI admixture tract length analysis, we obtained very similar estimates of ad-mixture time for both domesticated species, with 121.17 generations for alpacas (113.99–130.04 95% CI; Fig. 2c) and 115.13 generations for llamas (107.4–126.02 95% CI; Fig. 2e). The generation length of llamas and alpacas has not been reported, al-though some widely divergent estimates are available for guanaco varying between 3 and 11 years [32,33]. We assumed that domesticated species would have shorter gener-ation lengths than their wild counterparts, a common feature of domesticgener-ation and se-lective breeding and loss of seasonality [27,34]. Given the range of guanaco estimates
Fig. 2 Inferences of admixture proportion and time and demographic history. a Estimated introgression proportions from llama to alpaca by using Local Ancestry Inference (LAI) (left). The X-axis indicates the guanaco-ancestry proportions in each sequenced alpaca individuals (Y-axis; N = 8). The right panel showed the introgression proportions by using ABBA-BABA (fd) method. The arrow showed the introgression
direction from llama to alpaca. b Estimated introgression proportions from alpaca to llama by using LAI (left). The X-axis indicates the vicuna-ancestry proportions in each sequenced llama individuals (Y-axis; N = 8). The right panel showed the introgression proportions by using ABBA-BABA (fd) method. The arrow
showed the introgression direction from alpaca to llama. c Inference of admixture time in alpaca by analyzing the LAI tract length. Dotted line indicates the median value of admixture time. d Change in linkage disequilibrium estimated Ne using SNeP over approximately the last 200 generations (AlpGua: alpaca genome that removed guanaco ancestry sites; AlpVic: alpaca genome that only remain vicuña ancestry sites). e Inference of admixture time in llama by analyzing the LAI tract length. Dotted line indicates the median value of admixture time. f Variation in estimated Ne compared to the overall decline slope, with changes below the 0 value on the Y-axis indicating a steeper decline and above the line indicating a shallower decline. The steeper decline event at 110 generations BP (black arrow) coincides with the date of admixture identified by LAI tract analysis
available, the implications of the LAI results for 3, 4, 5, and 6-year generation lengths (the mean estimate for guanaco being 7 years) are events occurring at 345, 461, 575, and 691 years ago, respectively, for llama and 364, 485, 606, and 727 years ago for al-paca. The most plausible explanation for a contemporaneous single-pulse admixture event occurring for both domestic species in this geographic region within this time-frame is the arrival of the Spanish Conquistadors (starting 1529). If this event explains the admixture tracts within the genomes of the domestic species, we can infer a gener-ation length for both species at approximately 4 years.
Demographic history
PSMC (Pairwise Sequential Markovian Coalescent) showed signatures of a strong demographic expansion from one million years before present (BP) for vicuña and
Fig. 3 Introgression patterns along the X chromosome in comparison to the autosomes. a LAI (top) and fd
statistics (bottom) were used to detect introgressed regions from llama to alpaca. The red dotted lines indicate the 1% threshold. b Comparison of introgression profiles between the inferred X-chromosome and the autosomes (top: llama to alpaca; bottom: alpaca to llama). The black dotted lines indicate the median value of calculated D statistics. c Variation in introgressed signatures (high and low) and genes across the inferred X-chromosome. In the upper panel, the calculated fdstatistics in the X-chromosome were shown.
The sequencing depths of male and female were used to identify the X-chromosome. The red and black dot points indicate the female and male sequencing depth respectively. In the lower panel, genes in the two represent regions (Low1 and High4) were zoomed in. The green rectangles represent the genes and gene symbols are shown above rectangles. The fdand D statistics are shown below the genes
alpaca, while guanaco and llama showed an expansion only after c 400,000 years, having undergone a decline immediately prior to this expansion (Additional file 1: Figure S5). All species showed evidence of a subsequent strong decline from 100,000–200,000 years BP to 25,000 years BP, overlapping with the last two major glacial periods. The alpaca genome showed evidence of a stronger and longer expansion than the vicuña; however, an even more extreme expansion for alpaca (to effective size Ne< 50,000) was also
de-tected in a previous study [8], but this study did not remove admixture tracts prior to analysis, potentially inflating the Neestimates of the simulation [28]. To detect more
re-cent Ne changes, we used MSMC (Multiple Sequence Markovian Coalescent), taking
advantage of a sample of 6 (alpaca and llama) or 8 (vicugna and guanaco) resequenced genomes in this study and found concordant evidence for declines in all four species
from 100,000 to 10,000 years BP. Higher Ne estimates could be inferred for V. v.
vicugna compared to V. v. mensalis, consistent with their larger geographic range, but no such pattern was found for L. g. guanicoe compared to L. g. cacsilensis, with the vari-ance among samples being larger than for Vicugna (Additional file 1: Figure S6). SNeP (SNP linkage disequilibrium-based Ne estimation), the resolution of which enables Ne
trends and their variance to be inferred over the last 200 generations [35,36], showed a consistent signature of further population decline (Fig.2d), with the largest decline de-tected in alpaca, both when only the most highly significant vicuña ancestry portions of the alpaca genome were included (43% of the genome retained) and when only the most highly significant guanaco ancestry portions of the alpaca genome were removed (64% retained). Estimated Nevalues ranged from 2500 (llama) to 3500 (vicuña-ancestry
Table 1 Genes, location, inferred or potential function, and directionality of introgression between llama and alpaca, revealed by Local Ancestry Inference and ABBA-BABA analysis (fd)
Gene Chromosome Function Directionality LAI, fd,
or both Olfactory receptor (OR5)
family
ChrUN Olfaction/dietary choice [14] Llama–
Alpaca
Both Anthrax toxin receptor 2
(ANTXR2)
2 Anthrax resistance/susceptibility [15] Llama–
Alpaca
Both Fibroblast growth factor 5
(FGF5)
2 Longwool/shortwool fleece [16] Llama–
Alpaca
Both
C4orf22 2 ANTXR2,FGF5, C4orf22 region linked to
high blood pressure susceptibility [17]
Llama– Alpaca
Both Atrial natriuretic
peptide-converting enzyme (CORIN)
2 Negatively regulates Agouti, yellow coat
in Hanwoo cattle [18]
Alpaca– Llama
Both
Endothelin 3 (EDN3) 19 Blue-eyed, white coat phenotype in
Waardenburg syndrome of human [19]
Alpaca– Llama
Both Olfactory receptor (OR2)
family
ChrUN Olfaction/dietary choice [14] Alpaca–
Llama
fd Fibroblast growth factor 21
(FGF21)
11 Melanogenesis in alpaca [20] Alpaca–
Llama
Both Agouti signaling protein
(ASIP)
19 Pigmentation [21,22] Alpaca–
Llama
fd
Transgelin (TAGLN) 33 Fiber development in Merino sheep [23] Alpaca–
Llama
fd
GNAS complex 19 Performance traits in cattle (imprinted)
[24]
Alpaca– Llama
Both
Cathepsin Z (CSTZ) 19 Immunoprotection [25,26] Alpaca–
Llama
alpaca), closely resembling those values from 1000 years BP in both species’ MSMC simulations. NeS analysis [36] identified considerable variation in the Nedecline slope,
especially in the recent past (50 generations), but interestingly identified an increase in the rate of decline for both domestic species at approximately 110 generations ago, which coincides closely with the LAI tract-based estimate of time of admixture (Fig.2f).
Selection signatures for domestication and introgressed segments
Combining FST outlier and extended haplotype homozygosity (XP-EHH) analysis, we
analyzed signatures of domestication by directly comparing wild ancestor and domestic descendant pairs (vicuña versus alpaca and guanaco versus llama). For this analysis, we did not use the genome data for which admixture tracts had been removed to enable us
to compare introgression “landmark” signatures with domestication signatures in the
same analysis. For vicuña versus alpaca, mean FSTacross the genome was 0.086 ± 0.153.
For domestication signals in alpaca, we identified 92 and 128 regions, comprising 647 and 817 genes, using FST and XP-EHH, respectively (Additional file1: Table S14–15; Figure
S7). However, only four regions comprising 35 genes showed overlapping peaks between
the two methods (Additional file 1: Table S16). Although overlap between the two
methods was limited, aside from the expected introgressed segments inferred to have originated from llama, putative domestication regions were linked to fecundity/develop-ment of secondary sexual characters, coat color, hypoxia, meat quality, and olfaction [37] (Table2). For guanaco versus llama, the mean FSTacross the genome was 0.064 ± 0.128.
For domestication signals, we identified 141 and 126 regions, comprising 999 and 800 genes, using FSTand XP-EHH, respectively (Additional file 1: Table S17–18; Figure S8).
Fifteen regions comprising 79 genes showed overlapping peaks between the two methods (Additional file1: Table S19). Although overlap between the two methods was again lim-ited, aside from the expected introgressed segments inferred to have originated from al-paca, putative domestication regions were linked to blood pressure control, spatial memory and social behavior, skin and coat color, domestic performance traits, and dietary restriction and appetite [34] (Table2).
Evidence for adaptive introgression
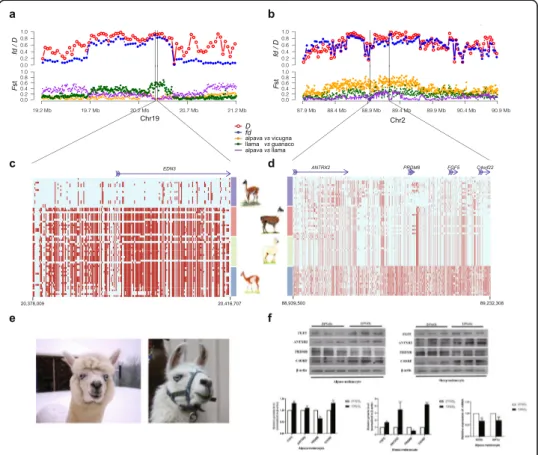
We then attempted to combine an understanding of both introgression and selection identified via the co-detected segments in our domestication analysis by focusing on four introgressed regions (ANTRX2/PRDM8/FGF5/C4orf22 and OR5 family for llama to alpaca, EDN3 and OR2 family for alpaca to llama). We examined phased haplotypes along the inferred introgressed regions to confirm both their ancestry from vicuña or guanaco and the variance in FSTbetween alpaca and llama to establish which segments
showed the strongest signatures of selection (Fig.4a–d).
For the ANTRX2/PRDM8/FGF5/C4orf22, the guanaco origin of the domestic haplo-type is clearly evident, strongly supporting the inference that it was introgressed from the llama into the alpaca (Fig. 4b). Inspection of the FST distribution along the region
shows a highly heterogeneous pattern, with almost no genetic differentiation between llama and alpaca coincident with 3′ end of the C4orf22 gene and downstream (Fig.4b). Further, SNP variation is, represented by genetic diversity (θπ), as expected, highest in
guanaco, followed by llama and with alpaca nearly devoid of SNPs in this region (θπ
-guanaco = 0.17; θπ-llama = 0.13; θπ-alpaca = 0.02), suggesting serial bottlenecks and/or selection occurring first at the domestication stage (guanaco–llama, where FSTand
XP-EHH scores were 0.106 and 0.269, respectively) and second at the introgression stage (llama–alpaca, where LAI and fdscores were 0.912 and 0.867, respectively). In contrast,
for the EDN3 gene, while the alpaca origin of the domestic haplotype is clear (Fig. 4c),
Table 2 Genes, location, inferred or potential function, and origin of domestication signatures in alpaca and llama, revealed by FSToutlier and extended haplotype homozygosity (XP-EHH) analysis
Gene Chromosome Function Origin Domestic
species FST, XP-EHH, or both Anthrax toxin receptor 2 2 Anthrax resistance/susceptibility [15] Introgressed from llama Alpaca Both Fibroblast growth factor 5
2 Longwool/shortwool fleece [16] Introgressed
from llama
Alpaca Both
C4orf22 2 ANTXR2, FGF5, C4orf22 region
linked to high blood pressure susceptibility [17]
Llama–Alpaca Alpaca Both
Luteinizing hormone receptor
ChrUN Fecundity and development of
male secondary sexual characters [38]
Domestication Alpaca Both
Agouti signaling protein
19 Pigmentation [21,22] Domestication Alpaca Both
Hypoxia upregulated 1
33 Cytoprotection under hypoxic
conditions [39]
Domestication Alpaca XP-EHH
Myomesin 1 24 Meat quality in cattle, sheep, and
pigs [40–42]
Domestication Alpaca FST Melanocortin 5
receptor
23 Meat quality [43] Domestication Alpaca Both
Melanocortin 2 (adrenocorticotropic) receptor
24 Circadial rhythm [44] Domestication Alpaca FST
Melanocortin 1 receptor
24 Light fiber color [45] Domestication Alpaca FST
Olfactory receptor (OR5) family
ChrUN Olfaction/dietary choice [14] Introgression from llama
Alpaca FST
Olfactory receptor (OR2) family
ChrUN Olfaction/dietary choice [14] Domestication Alpaca FST
G protein-coupled es-trogen receptor 1
ChrUN Spatial memory and social
behavior [46]
Domestication Llama Both
Premelanosome protein
ChrUN Skin and coat color in wild and domestic mammals [47] Domestication Llama FST Anthrax toxin receptor 2 Anthrax resistance/susceptibility [15]
Domestication Llama Both
Fibroblast growth factor 5
2 Longwool/shortwool fleece [16] Domestication Llama Both
Endothelin 3 19 Blue-eyed, white coat phenotype
in Waardenburg syndrome of human [19] Introgression from alpaca Llama FST Agouti signaling protein 19 Pigmentation [21,22] Introgression from alpaca Llama XP-EHH
GNAS complex 19 Performance traits in cattle
(imprinted) [24] Introgression from alpaca Llama FST Agouti-related neuropeptide
9 Dietary restriction and appetite in
cattle [37]
supporting its vicuña origin, there is no evidence for a loss of diversity between vicuña and alpaca (EDN3 does not feature in either the FSTor XP-EHH candidate list; Fig.4a)
or at the stage of admixture (alpaca–llama, where LAI and fd scores were 0.400 and
0.664, respectively), suggestive of recent artificial selection for this phenotype in the do-mestic forms (white fleece, blue eyes [48]; Fig.4e). In both alpacas and llamas, white in-dividuals with blue eyes are often deaf, the phenotype of which is known to be regulated by KIT [35]. However, in the phenotypically similar Waardenburg syndrome
in humans, these phenotypes are associated with EDN3, SOX10, and EDNRB [19].
While the linkage of these phenotypes to EDN3 in SAC was previously unsuspected, studies have suggested EDN3 is linked to white pelage in wild cats [49] and the co-occurrence of deafness (congenital deafness) and white pigmentation is a common ob-servation in domestic animals [50].
We also found that the number of SAC functional olfactory receptor (OR) genes was substantially lower than for other domestic livestock (approximately 50% of cattle and horse, at 566–602; Additional file 1: Table S20). For OR5, while the wild origin of the haplotype (especially 5′ end) in the guanaco was clear for both domestic forms, a mo-saic pattern of similarity is evident across the family, with no consistent changes in FST
being evident (Additional file 1: Figure S9 left). For OR2, a vicuña origin is clear, but again, no consistent patterns are discernible across the region (Additional file1: Figure S9 right).
Given the extensive admixture detected between llama and alpaca, a wider investiga-tion of introgressed segments was carried out (HoxD cluster, EVX2, OLA1, and a 1.5 Mb region on Chr10 from llama to alpaca, including C2CD3, RAB6C, ATG16L2, and
RNF121; CORIN, FGF21, GNAS, and TAGLN from alpaca to llama; see Additional file1:
Figure S10–12). For HoxD (HoxD3, HoxD4, HoxD10, HoxD12, and HoxD13), EVX2 and
OLA1, we found clear evidence of introgression from llama to alpaca (Additional file1: Figure S10). Mutations in HoxD, EVX2, and OLA1 genes are known to result in
abnor-mal skeleton development [51,52] and introgression of HoxD, EVX2, and OLA1 from
llama to alpaca could therefore influence the development of the alpaca’s larger body size compared with vicuña, as evidenced, for example, by obvious shoulder height dif-ferences [53] (Additional file1: Figure S10–12).
Functional analysis
We found that the coding sequences (CDS) for FGF5 in male and female Suri and Hua-caya alpaca skins were identical except for two T - G substitutions at sites 50 and 346 (Additional file1: Figure S13a). To establish whether FGF5 was expressed differentially in the skin of Suri (longwool) and Huacaya (shortwool) alpaca, quantitative real-time PCR (qPCR) analysis was carried out and showed that FGF5 mRNA showed signifi-cantly elevated expression in Suri alpaca, both for males and females (two-way ANOVA P< 0.001) (Additional file1: Figure S13b), a result replicated in concomitant Western Blot assays (two-way ANOVA P < 0.001) (Additional file 1: Figure S13c, d). Expression profiles for the 20 single-copy genes identified during the introgression and selection signature analysis were compared within alpaca and among the three de novo se-quenced specimens. We found very high expression levels for transgelin (7x higher compared to all other genes) in alpaca and llama skin (expressed at a similar level to
alpaca, although in blood, while being effectively absent from the wild species). This gene was identified as being introgressed from alpaca to llama has been linked to skin and wool follicle development in merino fine-wool sheep [23]. To investigate whether FGF5, ANTXR2, PRDM8, C4orf22 haplotype could be related to hypoxic response, as some evidence has already been found in other mammals [54,55], their expression was investigated in alpaca and sheep melanocytes incubated under normoxic (21% O2) and
hypoxic (13% O2) conditions. While FGF5, ANTXR2, and C4orf22 were more highly
expressed in hypoxic conditions, surprisingly PRDM8 at 13% O2 was significantly less
expressed than at 21% O2in both cell lines. Similarly, mRNA expression of Sry-related
HMG-box-containing transcription factor 6 (SOX6) and its downstream regulated
Fig. 4 Evidence for adaptive introgression and functional analysis. a D and fdstatistics for ((alpaca, vicuña),
llama, Bactrian camel) and the respective FSTvalues for alpaca versus vicuña, llama versus guanaco, and
alpaca versus llama. b D and fdstatistics for ((llama, guanaco), vicuña, Bactrian camel) and the respective FST
values for alpaca versus vicuña, llama versus guanaco, and alpaca versus llama. c EDN3 introgression profile, inferred from alpaca to llama and with origin in vicuña, controlling the blue-eyed, white fleece phenotype now found in both species. The rectangles with red color indicate the same allele with the reference genome, while the light blue rectangles indicate the alternative allele. d ANTRX2, PRDM8, FGF5, and C4orf22 introgression profile, inferred from llama to alpaca and with origin in guanaco, potentially controlling anthrax susceptibility, longwool/shortwool fleece, and blood pressure, now found in both species. e The typical phenotype of blue-eyed alpaca and llama. f Upper: Western Blot result of FGF5, ANTXR2, PRDM8, and C4orf22 in alpaca and sheep melanocytes. Lower: (left and middle) protein expression levels by densitometric analysis of FGF5, ANTXR2, PRDM8, and C4orf22 in alpaca and sheep melanocytes. Protein abundance was normalized relative to the abundance ofβ-actin. Bars represent mean values ± standard error (N = 3). *P < 0.05, **P < 0.01, ***P < 0.001. The experiment was repeated for three times. Lower: (right) qPCR for HIF1α and SOX6. Resulting mRNA abundance for HIF1α and SOX6 was normalized using 18S rRNA. All reactions were performed 4 times. mRNA abundance of HIF1α and SOX6 was significantly decreased at 13% O2compared to 21% (*P < 0.05 and **P < 0.01, respectively)
hypoxia-related gene HIF1α [56] were downregulated at 13% compared to those at 21% O2(Fig.4f).
Discussion
These first genome-scale results for wild and domestic South American camelids con-vincingly support the hypothesis that the alpaca was domesticated from the vicuña and
that the llama was domesticated from the guanaco. Figure 1b shows that despite the
wide spread of alpaca lineages in the Vicugna clade, they group together with 100% bootstrap support, despite the > 30% introgression from llama that was detected. When we recalculated the phylogeny with the introgression segments removed from the al-paca genome (Additional file 1: Figure S14), all individuals grouped together and with V. v. mensalis with 100% bootstrap support, pointing towards this subspecies as the ori-gin of the alpaca. Interestingly, however, all alpaca grouped within a separate clade from mensalis, suggesting that the population of V. v. mensalis that was originally do-mesticated is not covered by our mensalis samples. It remains possible, however, that residual introgression segments which we were unable to reliably detect using LAI have influenced the shape of the phylogeny and could underlie the separation of alpaca from mensalis(Fig. 1a). Figure1aalso reveals that Lama guanicoe cacsilensis is most similar to L. glama, which is recapitulated in Fig. 1c, where the two northern cacsilensis sam-ples group with llama (k = 4). However, while we consider the phylogenetic origins of these domestic species to be resolved, we did not attempt to address how many times each species was domesticated nor the likely precise origins of domestication, which will require greater sampling of extant populations, especially in Peru, combined with an ancient DNA approach.
The level of admixture detected in the genomes of all alpacas sequenced is among the highest detected in a domesticated animal to date: all estimates exceeded 30%. Fig-ure 1a shows the admixture to be pervasive and remarkably consistent across individ-uals, implying that admixture happened in a consistent manner. Although a much smaller proportion of the llama genome is admixed (c 5%), hybridization has clearly been bidirectional. All methods gave similar results but the LAI analysis of admixture tract lengths (Fig.2c, e) allowed us to conclude that a single major event occurred con-temporaneously for both species and is relatively recent, occurring just over 100 gener-ations ago, consistent with the low variance in ancestry components detected [57]. While a precise estimate of the llama and alpaca generation length is not available, esti-mates using data from wild SACs would place the event at 400–600 years ago. The one major event that is known to have occurred during this period was the Spanish con-quest. Within a century of the conquest of Cuzco in 1532, administrative and taxation documents record the “precipitous decline and virtual disappearance of previously ex-tensive herds throughout the Andes”, and while early Spanish writers noted the import-ance of SACs in the Andean pastoral system, they failed to distinguish between the llama and alpaca in their writings [3]. At a time of mass human and SAC mortality and replacement, under a subjugate system that failed to acknowledge the distinctiveness of the two domestic species, and with indigenous records and knowhow in breeding being passed down by oral tradition only, it seems likely that in the years after the conquest, established breeding practices broke down, including the maintenance of species boundaries and fleece types.
The demographic history of SACs since the divergence of Lama and Vicugna c 2.5 M years before present shows evidence for a strong expansion, albeit earlier for the vicuña, with the expansion of the genus Lama coinciding with the Mindel-Riss/Holstein inter-glacial period followed by a decline over the last 200,000 years, which has continued largely to the present day (Additional file1: Figure S5 and S6). The difference between the two genera may reflect their altitudinal partitioning and reliance of the guanaco on multiple Andean habitats, which would have opened up during this interglacial period, potentially allowing the population to expand. These results are interesting in the con-text of recent studies on the genetics of the wild species [57,58] that have shown both a signature of demographic expansion in vicuña and guanaco and a recent demographic decline in vicuña, and our results support the latter conclusion [52]. However, the multi-locus microsatellite data used in these studies did detect a strong bottleneck
2000–3000 years ago, which coincides the period of strongest decline in our MSMC
plots (Additional file 1: Figure S6). We were most interested in understanding fine-scale changes in effective population size in the last 1000 years for the domestic species and SNeP and NeS analysis both confirmed a continuing decline from 200 generations ago to the present day (Fig. 2d), to a current effective size of less than 1000. Interest-ingly, a coincident acceleration in this decline was detected approximately 110 genera-tions ago using NeS (Fig. 2f), very close to the date estimated for the admixture pulse and in line with the recorded decline following the Spanish conquest [3]. So, taken to-gether, the admixture tract and SNeP analysis point to a single event in both species occurring 100–110 generations ago. The most plausible explanation for this decline in population size and the onset of substantial bidirectional introgression in these domes-tic species is the chaos and loss of traditional management pracdomes-tices in Andean com-munities immediately after the conquest.
The phenotypic consequences of the admixture pulse have never been studied, des-pite evidence of its importance. Annotation of the introgressed regions (Table 1) re-vealed several large haplotypes containing a number of genes that could be both separately or coincidentally introgressed. These include a haplotype including the
An-thrax toxin receptor 2 gene (ANTXR2) and fibroblast growth factor 5 (FGF5 -
intro-gressed from llama to alpaca). This haplotype has been implicated in fiber characteristics in alpaca and blood pressure control in humans (Table 1) and Bacillus anthracis is also known to be prevalent in the soil at elevations below 4000 m ASL in the Andes, but to be absent above this altitude [59]. Other genes detected included ol-factory receptor families 2 and 5 (OR2 and OR5), genes linked to dietary choice [14] and coat color. The extent to which this introgression was deliberate or occurred acci-dentally is not known and merits further study, especially using historical records.
Signatures of domestication, identified by comparing the genomes of the domestic species with their wild ancestors (Table 2), as expected highlighted genes involved in coat color variation, sexual and reproductive traits, and dietary choice as well as a num-ber of genes implicated in production traits (both meat and milk) in other livestock species. Interestingly, the alpaca whose wild ancestor, vicuña, lives at high altitudes, showed selection signatures for the hypoxia upregulated gene [39], while llama (whose wild ancestor, the guanaco, lives in small social groups and undertakes seasonal altitud-inal migration) showed a signature for a G-coupled estrogen receptor previously linked
segments described above were also identified as domestication signatures, implying that some are operating in parallel in the two domestic forms.
To further investigate the adaptive or selective value of the most significant intro-gressed segments in this study, we evaluated their sequence diversity in more detail. First, while admixture has been bidirectional, the generally lower levels of introgression in the X-chromosome suggest a potential barrier to hybridization which might have further impacted on effective population size trajectory after the conquest. This phenomenon has been observed in comparisons between taurine and indicine cattles [60], but the ancestors of those two bovine forms are generally thought to have been subspecies, not species from separate genera, for which the cost of introgression is ex-pected to be considerably higher.
Analysis of the sequences that is syntenic to the human HSA4q21 locus comprising
ANTRX2/PRDM8/FGF5/C4orf22 (llama–alpaca), EDN3 (alpaca–llama), and the OR5
and OR2 gene families revealed contrasting patterns of genetic erosion, ranging from the expected serial loss of SNP diversity from wild ancestor to domesticated descendant and then into the introgressed species (see ANTRX2; Fig. 4d), to very little difference detected in SNP diversity across all three species (EDN3), to a complex mosaic of SNP diversity across the OR families though we cannot rule out the possibility that some OR SNPs may be artifacts due to misaligned sequences. Our results thus suggest multiple evolutionary processes at play and the need to examine their evolution on a case-by-case basis. The evolutionary distinctiveness of the wild ancestors of these two domestic forms means that detecting introgression events is feasible; however, understanding their functional significance is less straightforward than, for example, can be carried out within and among livestock breeds within the same species which have an extensive history of QTL investigation, e.g., in cattle [61]. Intriguingly, the HSA4q21 locus has been linked using GWAS, to blood pressure homeostasis in Asians and Europeans. A mouse model has been used to identify the causative gene in humans, which was found to be ANTXR2, whereas blood pressure did not differ between FGF5 knockout and wild-type mice [17,62]. Systematic studies have identified a positive link between
alti-tude (and thus hypoxia) with the frequency of hypertension in humans [63] and
PRDM8 belongs to a family of histone methyltransferases that are known as negative
regulators of transcription. Thus, in contrast to the other upregulated genes in the “HSA4q21” region, the downregulation of PRDM8 at high altitude may confer cytopro-tection by upregulating the expression of other genes in a manner analogous to the hypoxia-inducible factor gene (e.g., HIF2α) [64]. Our qPCR results showed that mRNA expression levels for the genes SOX6 and HIF1α are similarly downregulated. SOX6 is one of the targets of PRDM8 in the retina and its expression is controlled by PRDM8 [65]. The response of HIF1α may therefore be indirect via the expression of the tran-scription factors SOX6 (and/or SOX5 and SOX9), depending on levels of atmospheric oxygen availability [56]. Under hypoxia, mitochondrial O2consumption is inhibited or
intracellular Fe and prolyl hydroxylase domain (PHD) activity increases, which de-creases the expression of HIF1α [56]. Therefore, FGF5, ANTXR2, and C4orf22 may play a key role in regulating hypoxia stress, while PRDM8 is a novel gene associated with hypoxic adaptation, the expression of which may be mirrored by decreased expression of SOX6 and HIF1α. FGF5 was originally reported as a key human oncogene [66], asso-ciated with a number of cancers [67], angiogenesis in human aortic endothelial cells
[68], and trichomegaly in humans [69]. C4orf22 is expressed in human neural progeni-tor cells expressing MEF2CA [70]. Functional analysis of the FGF5 gene in Suri and Huacaya alpacas has previously shown its potential importance in regulating fleece length [71], and preliminary analysis of expression profiles in domestic SACs has shown the potential importance of a novel QTL for fine fiber production in merino sheep
[23]. Further studies should focus on investigating these genes and the QTL they
underpin.
Conclusions
That domesticated South American camelids have undergone genetic erosion is clear from the decline in both species’ effective sizes over the recent 1000 years, and it is plausible that the Spanish conquest and its aftermath have contributed to this substan-tially. However, it is also the case that some of the introgressed segments we have iden-tified have potentially allowed new avenues for selection, for example, for coat color, fiber characteristics, and adaptation to high altitude and harsh environment. Therefore, introgression, which has negative connotations in species management or conservation, but which genome data are showing to be far more pervasive than previously appreci-ated, should be afforded a more nuanced interpretation in domestic species and does not necessarily contribute to genetic erosion.
Methods
Sampling and DNA sequencing
Blood and tissue samples were obtained from eight wild guanacos, vicuñas, and domes-tic llamas and from seven alpacas. Sampling of guanacos and vicuñas represents the en-tire range of geographic distribution of each species (Additional file 1: Table S8). One adult male guanaco from Putre (Chile) and adult female vicuña from Lauca National Park (Chile) were selected for de novo assembly, representing the northern subspecies of wild South American camelids, Lama guanicoe cacsilensis and Vicugna vicugna men-salis, respectively. Llama tissues were obtained from Putre and alpaca from Temuco
(Chile; Additional file 1: Table S8). Genomic DNA was extracted using the Puregene
Tissue Core Kit A (Qiagen). See Additional Material S3 for further information and permit details.
De novo assembly, alignment, and annotation
De novo assembly for L. guanicoe, V. vicugna, and L. glama used Illumina HiSeq 2000 and HiSeq 2500 platforms (see Additional file 1: Supplementary text for full descrip-tion). Paired-end libraries with insert sizes of approximately 170, 500, and 800 bp, and mate pair libraries with insert sizes of 2, 5, 10, 20, and 40 kb were constructed. We gen-erated 335, 285, and 262 Gb of high-quality data for each species, respectively (Add-itional file 1: Table S1). SOAPdenovo (v2.04) [9] was used to assemble the genomes (Additional file1: Table S2). Annotation used a standard combination of ab initio gene prediction, homolog searching, and EST/unigene-based prediction. To aid gene predic-tion and to enable transcript data to be analyzed at the species level, we generated RNA-seq data for blood samples from the vicuña, llama, and guanaco used for de novo sequencing and from skin samples for a set of 17 alpaca samples from China
(Additional file 1: Table S8). Expression patterns were compared within and among species for specific genes by aligning to the guanaco reference gene set using Bowtie2 [72] and then RSEM [73] was used to estimate the Fragments Per Kilobase of transcript
per Million mapped reads (FPKM). For the de novo gene predictions, AUGUSTUS
(v2.5.5) [74] and GENESCAN (v1.0) [75] were used to identify candidate
protein-encoding genes in the masked genome with self-trained model parameters. For homology-based predictions, we used the genomes of B. taurus, C. bactrianus, C. dro-medarius, E. caballus, H. sapiens, M. musculus, and V. pacos. These were mapped to a repeat masked assembly using TBLASTN2.2.23 [76] with an E-value threshold of 1E−5. Subsequently, homologous genome sequences were aligned against the matching pro-teins to define gene models using GENEWISE (v2.2.0) [77]. For the EST-based method,
unigenes were mapped to the genome using BLAT (identity ≥ 90%, coverage ≥ 90%),
and overlaps among the spliced alignments were filtered and linked using PASA [78]. Gene models supported by the three methods were integrated to yield the final
gene-set using GLEAN (Additional file 1: Table S7a–c). To assign functions to the gene
models, we used the SwissProt and TrEMBL protein databases (Uniprot release
2011-01) using BLASTP with an E-value threshold of ≤ 10−5. Domain-based comparisons
were performed and searched to identify conserved domains/families. Functional anno-tation was carried out using Blast2GO [79]. Metabolic pathway annotations were per-formed by sequence comparisons with KEGG proteins (Release 76) using BLASTP.
Resequencing of individuals of four camelid species
Resequencing produced 35–49 Gb of raw data per individual. We removed reads with
≥ 10% unidentified nucleotides, > 10 nt aligned to the adaptor, with ≤ 10% mismatches allowed, with > 50% bases having phred quality < 5 and putative PCR duplicates gener-ated during library construction. Details of the throughput and read lengths are sum-marized in Additional file1: Table S9.
Chromosome level reference genome and SNP calling
To obtain the chromosome level reference genome, we aligned our assembled guanaco scaffolds against the VicPac3.1 [80] using LAST [81] and get the chromosome informa-tion for each scaffold. Due to the lack of ordering informainforma-tion for scaffolds within each chromosome of their assembly, we joined our scaffolds together after sorted them by length within each VicPac3.1 chromosome. For unmapped scaffolds, we connected them together and classified them as“ChrUN”. In total, ~ 2.1 Gb of assembled scaffolds in our study could be mapped to chromosomes in VicPac3.1 and ~ 499.7 Mb were clas-sified as “ChrUN,” the same level as those reported by VicPac3.1. We also mapped the reads of two selected individuals (one male and one female) onto our assembled scaf-folds and identified X fragments based on the sequence depth ratio (male/female≥ 0.5). We next connected the identified X fragments together and used the assembled se-quence as our X chromosome sese-quence.
High-quality reads were then aligned to the above reference genome using
Burrows-Wheeler Alignment MEM (BWA-MEM) [82], and alignment statistics were
ob-tained using SAMtools (v1.2) [83]; reads were filtered with a map quality lower than 5 and a mismatch longer than 5 bp. The reads of female individuals from our study were
mapped onto the X chromosome respectively. Base Quality Score recalibration and indel realignment were performed prior to variant calling, which was carried out using Picard (http://broadinstitute.github.io/picard). BAM files were adjusted using the Gen-ome Analysis Toolkit (GATK, v3.4) [84] with the HaplotypeCaller method, using a hid-den Markov model likelihood function.
Phylogenetic, admixture, and lineage sorting analyses
To examine the evolutionary relationships among SACs across the genome, a sliding window with length and step of 250 bp was used to select SNPs, mapped to the gua-naco reference genome. One SNP was selected per window, resulting in 5,901,447 posi-tions being analyzed. A neighbor-joining tree (sample location in Fig. 1a) was then constructed using uncorrected P-distances in TreeBestv1.9.2 [85] with 100 bootstraps (Fig. 1a). We also performed population clustering analyses using the software package ADMIXTURE [86]. Specifically, we used PLINK [87] to extract variant sites that were not in significant linkage disequilibrium (LD) with any other site within a 100 kb
win-dow. We then ran ADMIXTURE with k = 2, 3, and 4 (Fig. 1c). We explored the
de-tected admixture further in a phylogenetic context by using Treemix [88], which allows the evaluation of the effects of genetic drift and gene flow on a maximum likelihood phylogeny. This software models the relationship among the sample populations with their ancestral population using genome-wide allele frequency data and a Gaussian ap-proximation of genetic drift. The f index representing the fraction of the variance in
the sample covariance matrix (^w) accounted for by the model covariance matrix (w)
was used to identify the information contribution of each migration vector added to the tree. Up to 20 possible migration vertices were computed.
We more explored introgression among SAC species in more detail at the genomic level, first by using an ABBA/BABA approach [89] (see Additional file 1: Supplemen-tary Text). The Bactrian camel was used as an outgroup, and all possible four-taxon topologies of alpaca, vicuña, llama, guanaco were analyzed. We calculated both Patter-son’s D [90, 91] and modified f statistics (fd) [89]. The frequency of the derived allele
on each locus in each species was used instead of binary counts of fixed ABBA and BABA. A significant positive D value signifies an excess of shared derived alleles be-tween taxa while a significant negative value indicates the presence of gene flow. A block size of 30 Mb was selected to calculate standard errors of D by bootstrapping. To identify introgressed segments from llama to alpaca, a 100-kb window size was chosen for calculating the fdacross the whole genome (Fig.2a, b). We separately examined D
and fd across the constructed X-chromosome to detect whether the pattern of
admix-ture differed from the autosomes.
Finally, we used Local Ancestry Inference and estimates of LA tract length to simul-taneously estimate admixture times and LA using a Hidden Markov Model [92]. In the absence of a recombination map and chromosome-scale assembly for SACs, we esti-mated a genome-wide recombination rate by assuming one cross-over per generation per chromosome, obtaining 1.82e−8 crossovers/base pair; owing to the genetic diver-gence between guanaco and vicuña, we could extract sites where allele frequencies dif-fered by at least 50% between the ancestral populations. We required that 90% of samples had a read depth of 10 or more at each site and that successive ancestry
informative sites be separated by at least 10 kb, in order to reduce the impacts of LD on admixture time estimation, although we note that LD has a minimal impact on these estimates for genetically divergent ancestral populations such as guanaco and vi-cuña. For all llama and alpaca samples, we imported the filtered read counts from the VCF files as the primary dataset for Local Ancestry Inference. Annotations of inferred introgressed regions were investigated for putative functions of relevance in SACs, other livestock species, and model mammals, including humans. For each domesticated population, we fitted a single pulse admixture model to genome-wide variation data, using 1000 block bootstraps of size 5000 ancestry informative sites. From these ana-lyses, we simultaneously estimated local ancestry proportions and time since admixture, assuming a single pulse, for llama and alpaca (Fig.2a, b).
Incomplete lineage sorting among phylogenetically related species, such as the vicuña and guanaco, can potentially obscure signatures of introgression between them (or here, between their domestic descendants, alpaca and llama). We compared the esti-mates of admixture generated above with estiesti-mates using ILS analysis with CoalHMM [93], a maximum likelihood approach that allows the simultaneous estimate of ILS, di-vergence time, and ancestral effective population size. Only alignment blocks with the L. glama scaffold were included, to enrich for syntenic regions and constrain the num-ber of scaffolds to be analyzed—this resulted in 556 syntenic blocks being included. We called hidden states along the genomic alignment with highest posterior probability and computed the proportion of reference genome positions in each state in windows of 10 kb, 100 kb, and 1 Mb. We only considered windows where more than 30% was covered by the analyzed alignment.
Demographic history simulation
We used the sequential Markovian coalescent to evaluate the demographic history of
the four SACs, starting with the Pairwise method (PSMC) [94], which reconstructs
long-term changes in effective population size over the evolutionary history of the spe-cies (here approximately 2 M to 10 K years ago), assuming a generation time of 5 years and a mutation rate of 7E−9 per site per generation which was used in the reference
[8]. Because admixture is known to bias PSMC outputs in favor of detecting
demo-graphic declines [95], we removed the admixture tracts identified using LAI (see the “Results” section) before carrying out the simulations. Regions with LAI probability of 0.8 or greater of originating from introgression were removed and the flanking region reconnected where three or more contiguous sites of non-introgressed ancestry. De-introgressed sequences were then realigned for downstream analysis. We aligned short reads to their respective reference genomes using BWA-MEM (v0.5.9) with the setting
aln –I –o 0 –l 31 –k 2 –t 4 and aligned the SNPs using SAMtools (v0.1.17), dividing
them into non-overlapping 100 bp bins, scored as heterozygous if there was a heterozy-gote in the bin, or as homozygous otherwise. The resultant bin sequences were used as the input for PSMC. Bootstrapping was performed by randomly resampling 100 se-quences from the original batch and the reconstructed population history was plotted using gnuplot4.4. Next, we used multi-sample sequential Markovian coalescent (MSMC) [96] to investigate more recent changes (up to 2 K years ago). SNP VCF files were obtained using GATK and all sites were phased using SHAPEIT2 [97]; mask files
were constructed using BAM files, created during the SNP calling step. Two models, “fixedRecombination” and “skipAmbiguous,” were used to infer population size changes and divergences. For bootstrapping, pairs of samples within-population and cross-population were randomly selected to infer their cross-population size and coalescence rates. MSMC was run with the default parameters and fixed recombination rate for 20 M it-erations. Results were plotted in R using ggplot2 and scaled with a generation time of 5 years and the mutation of 0.7E−8 per site per year. To better understand very recent trends in effective population size for all species (i.e., within the last c1,000 years), we
implemented the linkage disequilibrium-based method of SNeP v1.11 [35] that uses
high density genome-wide data and can take account of variation in sample size, muta-tion, phasing, and recombination rate. Using this approach, we further documented short-term changes in Ne by implementing NeS [36], which records the change in slope of the inferred Ne trend obtained from SNeP, a more detailed picture of population changes over the period studied. A constant rate of change is shown as a flat line prox-imal to 0 in the Y-axis, whereas deviations above and below 0 represent relative in-creases and reductions in Ne, respectively. Alpaca genomes were analyzed after removal of regions of high guanaco ancestry, retaining 64% of the original genome, and a more stringent approach was taken of only retaining the regions with high vicuña an-cestry, retaining 43% of the original genome.
Selection signatures of environmental adaptation, domestication, and introgression
We took a population genomics approach to identify selection during SAC domestica-tion, by comparing the (ancestral) V. v. mensalis samples with alpaca and the (ances-tral) L. g. cacsilensis samples with llama, using the whole-genome datasets where introgressed tracts were removed. First, selection signatures were explored using FST
outliers, comparing them to the null distribution generated in windows of 100 kb, using VCFtools [28]. We used a windowed FST as a test statistic, retaining windows with
values exceeding the 99% upper quantile as potential locations for selection. Since FST
analysis does not differentiate between ancestor or domestic signatures of selection, we also used Selscan 1.1.0b [98] to implement extended haplotype homozygosity analysis (XP-EHH). XP-EHH scores were standardized across the genome and those exceeding the top 1% of the distribution were identified as potential signals of positive selection. Contiguous significant SNPs were integrated into a common signature or region within each comparison, allowing for one non-significant SNP and including half of the phys-ical distance to the neighboring non-significant marker on both sides. Since XP-EHH searches for unusually long haplotypes, isolated significant SNPs were discarded. Posi-tively selected regions were examined for the presence of genes of known adaptive sig-nificance first in llama and alpaca, then using the literature for other livestock species, and finally for evidence from model mammal species and humans. Finally, to search for putatively adaptively introgressed segments of non-native ancestry in the genomes of alpaca and llama, we compared the results of the selection signature analysis with the introgression analysis to look for common signatures and searched the genomes for sites where all sequenced alpacas and llamas were homozygous for introgressed gua-naco or vicuña-like ancestry, respectively. We required that at least four consecutive markers support a region as introgressed. We then investigated fine-scale patterns of
DNA variation in four regions containing the ANTXR2/PRDM8/FGF5/C4orf22, EDN3,
OR5 family, and OR2 family genes to compare sequence variation in vicuña, guanaco,
llama, and alpaca to both verify the ancestry of these segments and to examine FST
distri-bution along the segments when comparing llama and alpaca. This was carried out to localize the regions of the gene responsible for the high overall FSTand LAI scores and to
examine their distribution to infer locus-specific selection processes in these genes.
Functional analysis of target genes
To further investigate potential function of genes identified in the selection signature analysis, we first focused on a gene within our top ranking admixed locus (in the direc-tion of llama to alpaca), comprising a set of candidate genes for adaptive introgression and artificial selection (ANTXR2/PRDM8/FGF5/C4orf22; see the“Results” section) [99, 100] and in particular on FGF5. Since functional variation at FGF5 (also known as the angora gene) is known to correlate with short- or longwool phenotypes in sheep and goat [101, 102], we examined sequence differences in this gene in short and longwool alpaca. Six healthy 2 year-old longwool (Suri) alpacas (3:3) and shortwool (Huacaya) al-pacas (3:3) were selected for mRNA and protein expression testing using the skin sam-ples. A skin section (diameter 3 cm) from the neck was surgically obtained and
immediately stored in liquid nitrogen. For mRNA PCR and qPCR, 1μg of total RNA
from Suri and Huacaya alpaca skins was extracted using TRIzol (Invitrogen) and treated with DNase I (Sigma). The mRNA was converted to cDNA using a cDNA syn-thesis kit (Takara, Dalian, China) for PCR and qPCR using SYBR Green (Takara) on a 7500 Fast Real-Time PCR system (Applied Biosystems) using FGF5 primers (Add-itional file 1: Table S21). The PCR reaction is conducted as follows: 95 °C for 5 min, followed by 40 cycles of 95 °C 15 s, 56 °C or 58 °C for 30 s, and 72 °C for 30 s. PCR prod-ucts were sequenced using standard Sanger methods and analyzed using an ABI 3730XL semi-automatic DNA analyzer. For Western Blot analysis, protein samples were separated using 10% SDS-PAGE and transferred to PVDF membranes. The mem-branes were blocked with 5% skimmed milk for 2 h and incubated for overnight at 4 °C
with the diluted primary rabbit antibodies FGF5 (1:500) and β-actin (1:1000). After
washing four times for 5 min each with TBST, the membranes were incubated for 1 h at 37 °C with horseradish peroxidase (HRP) secondary antibodies against rabbit IgG (1: 10000). After washing four times for 5 min each with TBST, the bound antibodies were visualized by chemiluminescence using ECL. Immunoblots were scanned on a Chemi-DOC™ XRS+ imager (Bio-Rad), and protein levels were quantified using Image-Pro Plus (Olympus). Finally, we examined the expression profiles (FPKM) of 20 single copy genes identified in the introgression and selection analysis (see above; Additional file1: Table S22). Comparative inference from expression profiles was limited because of dif-ferent tissue source (skin samples from 17 alpacas from China and blood samples from each of the de novo sequenced vicuña, guanaco, and llama).
To investigate the potential effect of hypoxia on the expression of the HSA4q21 syn-tenic locus (ANTXR2/PRDM8/FGF5/C4orf22), alpaca melanocytes and sheep
melano-cytes were cultured for 72 h under normoxic (21% O2) and hypoxic (13% O2)
conditions respectively. Alpaca melanocytes and sheep melanocytes were lysed to get protein by RIPA (Beyotime, Shanghai, China) for Western Blot analysis with the diluted