A
Al
l
ma
m
a
M
Ma
at
te
er
r
S
St
tu
u
di
d
i
or
o
ru
um
m
–
–
U
Un
n
iv
i
ve
er
rs
si
i
tà
t
à
d
d
i
i
B
Bo
ol
l
o
o
gn
g
n
a
a
DOTTORATO DI RICERCA IN
INGEGNERIA AGRARIA
Ciclo XXV
Settore Concorsuale di afferenza: 07/C1 Settore Scientifico disciplinare: AGR09
TITOLO TESI
APPLICATIONS OF INFRARED THERMOGRAPHY
IN THE FOOD INDUSTRY
Presentata da: LUCIAN CUIBUS
Coordinatore Dottorato
Relatore
Prof. Ing. Adriano Guarnieri Ing. Angelo Fabbri
Dr. Luigi Ragni
“Learning is experience. Everything else is just information.”
CONTENTS
INDEX OF FIGURES V
INDEX OF TABLES VIII
INTRODUCTION
1I.
INFRARED
THERMOGRAPHY
IN
THE
FOOD
INDUSTRY
3
I.1 The science of infrared thermography 3
I.2 Research concerning past and recent application of thermography in the food industry
17
I.3 References 27
II. APPLICATION OF INFRARED THERMOGRAPHY IN
THE FOOD INDUSTRY
33
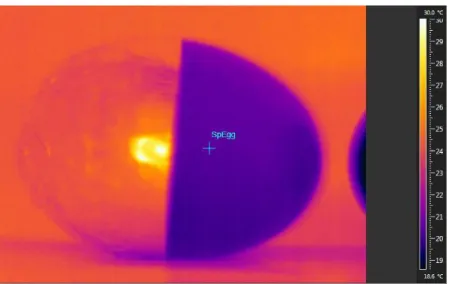
II.1 Experimental validation of a numerical model for hot air treatment of eggs in natural convection conditions and with hot-air jet with FLIR- IR thermocamera
33
II.1.1 Introduction 33
II.1.2 The eggs 35
II.1.3 Material and methods 41
II.1.4 Results and discussion 51
II.1.5 References 59
II.2 Application of infrared thermography for controlling freezing process of raw potato
65
II.2.1 Introduction 66
II.2.2 Material and methods 67
II.2.3 Results and discussion 69
II.3 Analysis of water motion throughout the potato (var. Melody) freezing by infrared thermography, microstructural and dielectric techniques.
85
II.3.1 Introduction 87
II.3.2 Material and methods 89
II.3.3 Results and discussion 91
II.3.4 References 103
II.4 Spinach - Infrared thermography versus image analysis: A survey
107
II.4.1 Introduction 107
II.4.2 Material and methods 109
II.4.3 Results and discussion 111
V
INDEX OF FIGURES
Figure 1 Components of an Infrared Sensing Instrument (Zayicek 2002) 5 Figure 2 Electromagnetic Spectrum (Kaiser 1996) 7 Figure 3 Radiation exchange at the target surface (Zayicek 2002) 9 Figure 4 Planck’s law for spectral emittance (Burnay et al., 1988) 10 Figure 5 Infrared Thermocamera FLIR A325 setup 43 Figure 6 Egg temperature measured with Infrared Thermocamera FLIR
A325
44
Figure 7 Infrared Thermocamera FLIR A325 setup for measurements in the
oven
46
Figure 8 The prototype used for the measurements 48 Figure 9 Analysis of the thermographic image for the egg treatment in the
oven at 55°C for 200 minutes
51
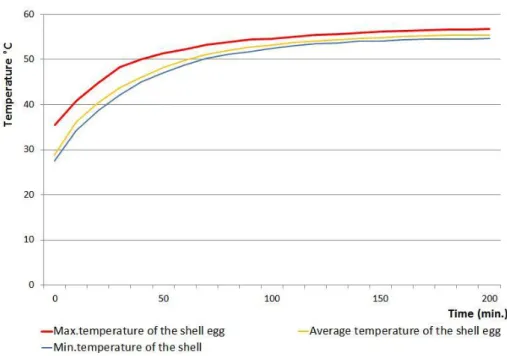
Figure 10 Time-temperature curves observed at the surface of egg shell
during the heat treatment in the oven at 55°C, for 200 minutes
52
Figure 11 Time-temperature curves of the egg shell measured and calculated 52 Figure 12 Time-temperature curves of the egg shell measured and calculated
for treatment 1
54
Figure 13 Time-temperature curves of the egg shell measured and calculated
for treatment 2
55
Figure 14 Time-temperature curves of the egg shell measured and calculated
for treatment 3
55
Figure 15 Time-temperature curves of the egg shell measured and calculated
for treatment 4
56
Figure 16 Time-temperature curves of the egg shell measured and calculated
for treatment 5
56
Figure 17 Time-temperature curves of the egg shell measured and calculated
for treatment 6
VI
Figure 18 Time-temperature curves of the egg shell measured and calculated
for treatment 7
57
Figure 19 Experimental setup 68
Figure 20 Freezing curves for potato, water and aluminium 69 Figure 21 Energy received by the camera with regard to the temperature of
potato and water
71
Figure 22 Freezing curve for potato, compared with the energy emitted by
the potato and registered by the camera thorough the treatment
72
Figure 23 Freezing curves for water, compared with the energy emitted by
the potato and registered by the camera thorough the treatment
73
Figure 24 Differential scanning calorimetry thermogram of potato 74 Figure 25 Energy received by the camera with regard to the internal energy
of potato and water
75
Figure 26 Energy received by the camera with regard to the internal energy
of potato and water
75
Figure 27 Freezing enthalpy area with regard to the temperature (principal
axis); water mass fraction (xwi) with regard to the temperature (secondary axis)
77
Figure 28 Emissivity with regard to temperature for potato 78 Figure 29 Experimental scheme of freezing process and control system 90 Figure 30 Freezing process curve and relative emissivity values 92
Figure 31 Temperature profile of potato sample through freezing process at
6, 9, 12, 42, 51, 84 and 120 min
93
VII process at 1mm, 4mm, 5mm, 1cm, 2cm
Figure 33 Variation of gradient of chemical potential through the time at
surface, 1 mm, 2 mm and 1 cm
95
Figure 34 Partial volume increment through the freezing process 96 Figure 35 Scheme of heat modelling to predict the behaviours involves in
the freezing process
97
Figure 36 Cryo-SEM micrograph for fresh (A-350x,C-500x,E-750x) and
thaw (B-350x,D-500x,F-750x) potato raw tissue
99
Figure 37 Dielectric spectra of fresh and thaw potato and liquid form
thawing process
100
Figure 38 Experimental setup for measuring the ice crystal dimension by
Nikon D700 digital camera and Flir A325 infrared thermocamera
110
Figure 39 Comparing the RGB digital image with an infrared image using
Image-Pro Plus software
VIII
INDEX OF TABLES
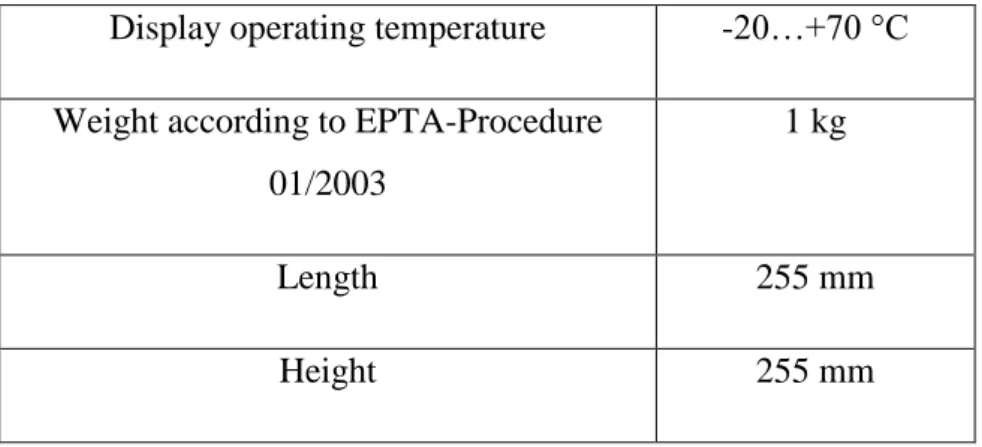
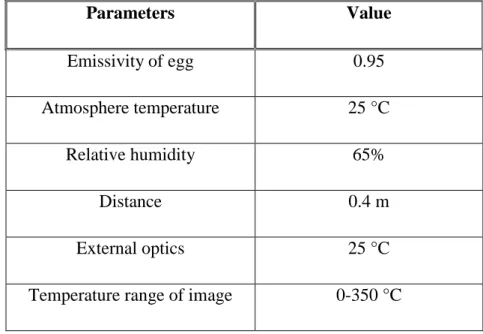
Table 1 Characteristics of the hot air gun Bosh, model GHG 660 LCD 47 Table 2 Characteristic parameters of the thermal cycles 49 Table 3 Parameters of the infrared thermocamera FLIR, A 325 used during the
experiment
50
Table 4 Results from the DSC experiments, moisture and non freezeable water
estimated
76
Table 5 Results from the DSC experiments, moisture and non freezeable water
estimated
INTRODUCTION
In the last 20-30 years, the implementation of new technologies from the
research centres to the food industry process was very fast. Normally, the
technological developments add value to stimulate the agricultural production,
industrial processing and services. In this direction all the companies try to
implement new technologies to reduce the cost of energy respecting also the
environmental rules. The further distinguished characteristics of thefood industry
are the technological and economic relations. Almost all the industrial food
processors have to use the thermal process to obtain an optimal product respecting
the quality and safety standards.
Non-contact and non-destructive methods are increasingly used in the
present in thefood industry because of the benefit provided by them. The infrared
thermography has been used in a small part of the food industry because of its
high price and the difficulty of using. The recent infrared thermocamera, the new
software and the lower prices simplified the applications in the industrial field.
Thermography has now a higher applicability in the food industry because it is a
non-contact technique and also totally non-destructive. This confers a big
advantage for the processors saving time, energy and a reduction of cost.
The present work is divided in two big chapters.
The science of thermography and also some applications made in the past by other
researchers were described and presented in the first chapter. In the second
chapter, the researches made on the different food products that can help the food
3
I.
INFRARED THERMOGRAPHY IN THE
FOOD INDUSTRY
I.1 The science of infrared thermography
Infrared thermography (IRT) or thermal imaging is a rapid, non-contact
and non-destructive powerful technique to determine the defects, changes
near-surface of different products, by measuring the near-surface temperature. The
etymology of the word ―Thermography‖ derived from ―thermo‖ and ―graphy‖, the Greek origin words, ―thermē‖ that means heat, warm, and ―graphein‖ that means
graphic, writing and literally we can say that thermography is ―writing with heat‖. This technique involves the detection of electromagnetic radiation, the invisible
infrared pattern emitted by the surface objects, and the conversion of this into a
visible image - ―thermogram‖ (Vavilov 1992; Carino 1994; Rao 2008;
Vadivambal & Jayas 2010). In fact this technique is like taking photographs but
with a camera having an infrared detector.
The classical instruments like thermometers, thermocouples, thermistors,
and resistance temperature detectors can measure the temperature only at specific
point and most of these instruments need a contact with material (Meola 2004,
Vadivambal & Jayas 2010). The thermography revolutionized the concept of
measurements and temperature monitor and this can be very useful for many
fields that require a non-contact method and a bigger area to determine the
temperature of the products (Omar 2005; Vadivambal & Jayas 2010).
The first mentions of existence of invisible thermal rays had been
hypothesized by Titus Lucretius Carus (c.99 – c. 55 BCE), a roman poet and the
author of the philosophic epic ―De Rerum Natura‖ (―On the Nature of the
4
astronomer and physicist of King George III, discovered the first thermal
radiation, infrared radiation outside the deep red in the visible spectrum, the
invisible light later called infrared (Herschel 1800, Vavilov 1992, Meola 2004).
The son of Sir William, Josh Hershel, proposed an evaporograph like a prototype
of IR imagers that focused with a lens solar radiation onto a suspension of carbon
particles in alcohol. In 1840 he called a thermal image ―thermogram‖, term still in
use today (Vavilov 1992). As a result of the next studies and observations of
others scientists like Macedonio Melloni, Gustav Kirchhoff, James Clerk
Maxwell, Joseph Stefan, Ludwig Boltzmann, Max Planck, Albert Einstein, and
others contributed to a fast progress of infrared thermography that become an
important technique to determine the surface temperature of the objects (Vavilov
1992; Meola 2004). In 1954 a real prototype of an airborne opto-mechanical IR
imager was developed in theUSA and was an important step for the development
of Forward Looking Infrared (FLIR) systems mounted on aircraft (Vavilov 1992).
After the military application used in World War II, more technology was
developed for many fields like aerospace industry, civil structures, medicine,
agriculture and food industry, non-destructive evaluation, environmental and
others (Vavilov 1992; Omar 2005). Thermal non-destructive testing (TNDT) is a
particular application area of IR thermography with its own history. One of the
first industrial applications of TNDT was related to analysis of hot rolled metal by
Nichols on 1935 (Vavilov 1992). This technique was also used in the civil
engineering to detect the corrosion-induced delaminations in reinforced concrete
bridges decks in North America, where in the late 1970s, Virginia Highway and
Transportation Research Council (Clemeiia & McKeel, 1978) and the Ontario
5
early research independently (Carino 1994). This initial studies involved handheld
scanners and photographic cameras to record the thermographic images (Carino
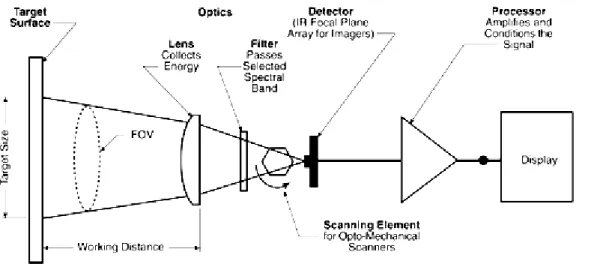
1994). In figure 1 we can see a scheme with the important components of an
infrared thermocamera.
Figure 1 Components of an Infrared Sensing Instrument (Zayicek 2002)
The infrared radiation (IR) is not detectable by the human eye, and the
most important element of IR camera is the radiation receiver called detector. The
infrared thermocamera detector is a focal plane array (FPA) of micrometer size
pixels made of various materials sensitive to IR wavelengths. The resolution of
FPA starts from 160 x 1120 pixels up to 1024 x 1024 pixels (Flir, 2010). We have
2 categories of infrared detectors: quantum detectors and thermal detectors. The
quantum detectors are faster (ns to µs) and more sensitive than thermal detectors,
because they are based on photon detector, the radiation is absorbed within the
material by interaction with electrons (Chrzanowski & Rogalski 2006). But
unfortunately to archive this information quantum detectors require cryogenic
6
The bolometer was invented by the American astronomer Samuel Pierpont
Langley at 1878. The bolometers have a temperature dependency and they
measure electrical resistance. The changes of temperature can be measured
directly or via an attached thermometer. The most used and cheap thermal
detector is a microbolometer, a special detector for measuring the energy of
incident electromagnetic radiations. The infrared radiation wavelengths between
7-14 µm strikes the detector material, heating it, and thus changing his resistance.
This electrical resistance is measured and processed into temperatures to create an
image – thermogram. In the last period, thermal detectors are more exploited in
commercial systems because they are cheaper, do not require cooling and can be
obtained good imagery. The speed and the moderate sensitivity of thermal
detectors are quite adequate for nonscanned imagers with two-dimensional (2D)
detectors. The performance of a thermocamera is determined by the quality of the
thermal image and the temperature resolution.
Large arrays of thermal detectors could help reach the best values of noise
equivalent differential temperature (NETD), below 0.1 K, due to effective
bandwidths less than 100Hz. It can be shown that the temperature sensitivity of an
imager, the so-called noise equivalent temperature (NETD), can be given by
(Lloyd, 1975): * 2 / 1 2 / 1 2 # ( ) 4 M t A f f NETD op (I.1.)
where f# is the f-number of the detector optics (f# = f/D, f is the focal length and D
the diameter of the lens), top the transmission of the optics and M* the figure of
7
dependence of the emitted radiation, ((S/T)), and the atmospheric transmission tat, it is given by following equation:
d D t T S M at * 0 *
(I.2.)NETD of one detector is the difference of temperature of the object
required to produce an electric signal equal to the rms (root mean square) noise at
the input of the display (Rogalski 2000).
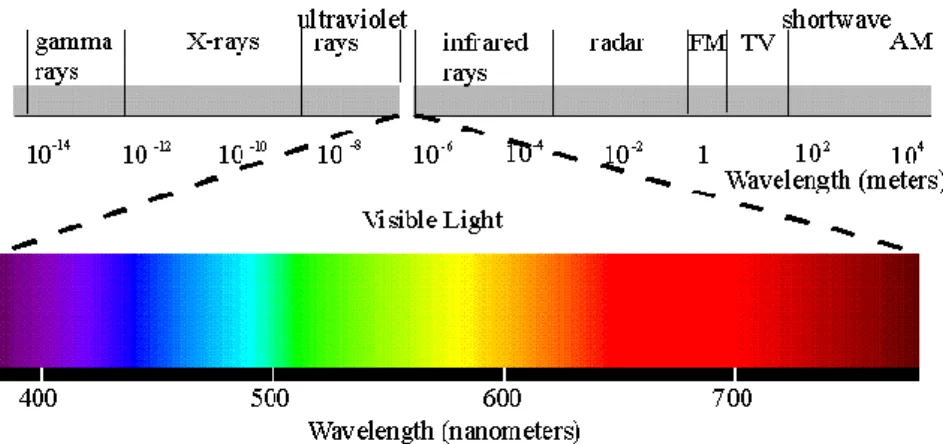
The infrared electromagnetic radiation is located in the infrared
electromagnetic spectrum like we can see in the figure 2. Infrared radiation covers
a portion of the electromagnetic spectrum from approximately 700 to 14.000
nanometres (0.7-14 µm). All the objects emitted infrared radiation above absolute
zero (0 kelvin = -273, 15°C), and the amount of radiation increased with
temperature. The intensity of object radiation is directly correlated with the
temperature distribution on the surface of the object, and depends also on the
surface condition, thermal properties of the material and the environment (Weil
1992).
8
Following the works of Planck, Stefan, Boltzmann, Wien, Rayleigh and
Kirchhoff, they defined precisely the electromagnetic spectrum and established
quantitative and qualitative correlations describing the infrared energy. The
objects are composed of continually vibrating atoms, with higher energy atoms
vibrating more frequently and this vibration of all particles generates
electromagnetic waves. The higher temperature of an object is, the faster
vibration, and thus the higher the spectral radiant energy (Chrzanowski &
Rogalski 2006). The measurement of thermal infrared radiation is the basis for
non-contact temperature measurement and thermal imaging (or thermography)
(Zayicek 2002). All the objects are continually emitting radiation at a rate with a
wavelength distribution that depends upon the temperature of the object and its
spectral emissivity ε (γ) (Chrzanowski &Rogalski 2006). The process of thermal infrared radiation leaving a surface is called exitance or radiosity. (Zayicek 2002).
One object reacts to incident radiations from its surroundings by absorbing,
reflecting, or transmitting, passing through (as through a lens) as illustrated in
9
Figure 3 Radiation exchange at the target surface (Zayicek 2002)
Kirchhoff’s law states that the sum of the three components is always equal to the received radiation (the percentage sum of the three components equals’ unity):
W = αW + ρW +τW, (I.3.) This can be simplified to:
1 = α + ρ + τ (I.4.)
where W is total radiation, α is the absorption, ρ is reflection and τ transmission. Radiant emission is usually treated in terms of the concept of a blackbody, a
theoretical ideal emitter (Ross 1994, Chrzanowski & Rogalski 2006). A
blackbody is an object capable of absorbing all incident radiation at any
10
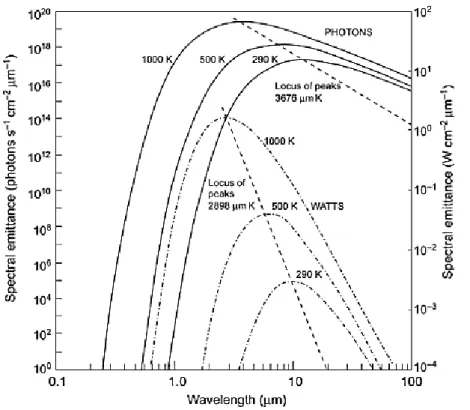
Figure 4 Planck’s law for spectral emittance (Burnay et al., 1988)
The energy emitted by an ideal blackbody is the maximum theoretically possible
for a given temperature. The radiative power (or number of photons emitted) and
its wavelength distribution is given by the Planck radiation law (Chrzanowski &
Rogalski2006): 1 5 2 1 ) exp( 2 ) , ( kT hc hc T Wb W cm-1µm-1 (I.5.)
where Wb (W cm-1µm-1) energy radiated per unit volume by a cavity of a
blackbody in the wavelength interval, λ (µm) is the wavelength, T (K) the absolute
temperature of a blackbody, h (6.6 × 10⁻³⁴ Joule sec) Planck’s constant, c (3 × 10⁸
m/s) the velocity of the light and k (1.4 × 10⁻²³ Joule/K) Boltzmann’s constant.
We can see a plot of these curves for a number of black body temperatures in the
11
By differentiating Plank’s law (Eq. I.5) with respect to λ and looking for the maximum radiation intensity, Wien’s displacement law is obtained Eq. I.6. (Mayer & Feldmann 2001, Mori & all 2008):
] [ 2898 max m T (I.6.)
For an ideal black body absolute temperature T and λ (wavelength of maximum energy radiation) is a constant. By integrating Planck’s formula from λ = 0 to λ =
∞, we obtain the total radiant emittance (Wb) for an idealized blackbody:
2
4 / m Watt T Wb (I.7.)For real objects is not valid this law of Planck (for an idealized black body –
perfect energy absorber), and was introduced the emissivity ():
2
4 / m Watt T W (I.8.)Emissivity is a very important characteristic of a target surface and must
be known in order to make accurate non-contact temperature measurements. The
emissivity can be defined like the ratio of energy radiated from a product/object to
the exterior and energy radiated from a black body. The value of emissivity is
proportional to the radiant energy emitted by a product surface. The energy
radiated is an indicator of the emitting of an object, and also the temperature of
that.
In order to determine the temperature of an object, using the thermal
imaging, the total radiant emittance and the emissivity of the object are both
12
Emissivity or emittance is defined as the ratio of energy emitted from an
object to the exterior, to that of a black body at the same temperature. Emissivity
can vary from 0 (perfect white body) to 1 (perfect black body) (Gowen & all,
2010). The emissivity depends on: the composition of material, the geometry, the
surface type and roughness. Usually the materials have an emissivity ranging from
0.1 to 0.99. For objects made of metal the emissivity is low increasing with
temperature, and for non-metals objects it tends to be high, nearby 1 and
decreases with temperature. The biological products normally have the emissivity
nearby 1, same like the human skin (Flir, 2010).
The infrared thermocamera converts the energy emitted by an object into
electrical signal via IR detectors, and displays it as a thermal image (colour or
monochrome);this we can estimate the surface temperature of objects.
We can obtain the thermal images using the most used and important
methods: passive or active thermography systems (classified by the source of
heating of the object). We can talk about the passive thermography when the body
of the object is heated by ambient conditions (solar radiation) (Rao, 2008).
In the active thermography the object is heated by an external source to
obtain the contrast of temperature. Normally the passive thermography is used for
assessing the large bodies like buildings, bridges, while active thermography is
generally adopted in research centres and for different industrial processes (Rao,
2008). The thermal information obtained in the passive mode largely describes
surface thermal properties (Gowen, 2010) Regarding the active thermography we
have different techniques for generating thermal energy like lock-in thermography
(expose to infrared radiation), pulsed-phase thermography (repeated heating at
13
vibrothermography (expose to sonic waves) (Rao, 2008, Maldague, Galmiche, & Ziadi, 2002, Shepard, Ahmed, & Lhota, 2004, Gowen & all, 2010)
Lock-in thermography, known as ―modulated thermography‖, requires a
thermal excitation applied to the sample surface to generate thermal waves. The
infrared thermocamera can monitor the sample during the modulated excitation,
measuring the resultant oscillating temperature field (Maldague, Galmiche, &
Ziadi, 2002, Sakagami & Kubo, 2002, Gowen & all, 2010). Using a sinusoidally
varying light source like laser beam, halogen lamp etc. the method is known as
―optically excited lock-in thermography‖ (Gowen & all, 2010). If we can observe on the surface of the sample one uniformed temperature rise, then the sample
doesn’t have any defects; on the contrary, if we can observe regions with high temperature, those areas correspond to the areas where the defects of a sample are.
(Sakagami & Kubo, 2002). As a consequence, the temperature distribution on the
sample surface is used to estimate the location, shape and the size of the defects
(Sakagami & Kubo, 2002).
The pulsed-phase thermography (PPT) combines the pulsed acquisition
procedure with phase/frequency concepts of lock-in thermography for which
specimens are submitted to a periodical excitation. This method was introduced
for non-destructive evaluation in infrared thermography applications a few years
ago as an interesting signal processing technique (Maldague et al., 2002).
To estimate the phase between the applied energy and local thermal
response, this two techniques (lock-in and pulsed-phase thermography), use the
Fourier transform on each pixel level of the time series of thermal images
14
Impulse thermography method requires an internal or external local
heating of the sample; the heated part is observed by the infrared thermocamera to
record the temperature change at the surface as a function of time. This method is
more useful in civil engineering where we can detect defects like the voids, cracks
in concrete, in tendon ducts and more (Maierhofer & all, 2006).
These considerations define the use of vibrothermography as a
non-destructive method for observing the energy-dissipation ability of granular
material. A scanning camera was used, which is analogous to a television camera.
It utilizes an infrared detector system in a sophisticated electronics system in order
to detect radiated energy, and to convert it into a detailed real-time thermal picture
in a video system both colour and monochromatic. Response times are shorter
than a microsecond.
Vibrothermography is used as a non-destructive method for observing
the energy-dissipation ability of granular material, employs sonic waves to impart
energy to the target surface. Flaws such as cracks and inclusions within a target
resonate at the applied sonic frequency, resulting in localised heating. One
advantageous feature of this technique compared with other methods of active
thermography is that the bulk of the sample is not heated; therefore, contrast
between flaws and surrounding material is increased (Shepard, Ahmed, & Lhota,
2004; Loung, 2007; Gowen & all, 2010).
According with Vavilov, 1992 all the IR imagers can be classified by
application areas as follows:
1) simple imaging units used for night vision in military, IR
15
etc., such as PalmIR-250 from Raytheon, Night Conqueror from Cincinnati
Electronics etc.;
2) radiometric (temperature measuring) imagers used in technical
diagnostics and non-destructive testing (general-purpose IR cameras and modules,
such as ThermaCAM P60 and ThermoVision A40 from FLIR Systems, TH-9100
Pro from NEC Avio, Testo-880 from Testo etc.);
3) radiometric computerized IR thermographic systems mainly intended
for scientific research and characterized by the highest temperature sensitivity and
frame frequency, such as ThermaCAM SC 6000 from FLIR Systems and SC 7000
from FLIR-CEDIP. (Vavilov 1992)
Regarding IR imagers performance, a definite trend is further
improvement of temperature and spatial resolution and increase of frame
frequency. This non-destructive method will become more efficient and flexible
17
I.2 Research concerning past and recent application of
thermography in the food industry
The infrared thermography is a technique used recently for agriculture and
food industry, in the past it was developed only for military applications and the
price for this device was cost-prohibitive and no portable versions existed. In the
last 10-15 years the prices for the sensors of infrared thermocamera decreased
drastically and the producers created small portable versions for field
measurement.
In food industry we know that the heating process has a major
importance’s to obtain a good and safe product with a long shelf life. Also we know that the traditionally way to measure and monitor the temperature with
different methods (thermometers, thermocouples, thermistor) provide only a
limited information’s.
The thermal imaging has revolutionized the concept of temperature
measurement in industries, and also in agriculture and food industry, because is a
very helpful tool to be exploited for the assessment of manufacturing procedures
as well for non-destructive evaluation of either end products, is fast, and also is a
non-contact analysis (Vavilov, 1992, Gowen & all, 2010, Vadivambal & Jayas,
2010).
The recent research shows the potential of IRT for agriculture and food
safety and quality assessment such as temperature validation, bruise and foreign
body detection, grain quality evaluation, assessing the seedling viability,
estimating soil water status, estimating crop water stress, scheduling irrigation,
18
evaluating maturity of fruits and vegetables and more over (Vadivambal & Jayas,
2010, Gowen & all, 2010).
In 1999 Nott & Hall used infrared thermal imaging for mapping the
temperature distributions induced by microwave in situ in two dimensions with
good results in spatial resolution. The advantage of this technique is the
non-invasive properties (can be applied to real food system without alterations), and
the disadvantage is that it only provides a surface measurement from which the
temperature within the sample has to be inferred in opinion of the same
researchers (Nott & Hall, 1999).
The spatial and temporal temperature distribution patterns obtained from
an object could have a potential application for food industry, for quality
assurance, safety profiling and authenticity. Du & Sun conclude that the necessity
of computer-based image processing technique is a consequence of increasing
demands for consistency and efficiency within the food industry.
In scientific literature we can discover only some research in the food
sector where thermal imaging was used. In the following paragraphs, I will
present briefly this recent advances and the potential of application of infrared
thermography for thefood industry.
Advance and potential applications of thermal imaging to monitor the
surface temperature of food product cooked in a microwave oven, in the spectral
range of 8-12 µm, was reported by Goedeken, Tong, and Lentz (1991).
Others researchers, like Ibarra et al. (1999) applied this technique using a
spectral range of 3.4 - 5 µm to control the heating and cooling cycles at the
surface of food samples. They created a statistical model to express the internal
19
obtained an accuracy of ± 1.22°C for cooling times between 0 and 450 s, and ± 0,
55 °C after cooking. This research confirms that thermal imaging has a good
potential for the real-time determination of the internal temperature of cooked
chicken meat in industrial line to verify that the minimum endpoint temperature
has been achieved.
Workmaste et al, (1999) used the infrared thermography to study the ice
nucleation and propagation in plants and confirmed that the technique can be
useful for studying the freezing process of plants.
Costa et al. (2007) used the infrared thermography on the slaughter-line for
the assessment of pork and raw ham quality. They obtained good results when
evaluating the meat and ham, using surface temperature differences. They
analyzed 40 carcasses of heavy pigs at 20 min. after stunning, thus left and right
caudal and dorsal surface images were kept for each half carcass. The settings of
the camera were as follows: emissivity of pig’s skin 0.98; reflected air temperature 22°C; distance between camera and skin surface m 2.5. These studies
confirm the absence of relationship between meat quality traits and the skin
surface temperature. The ham with a lower fat cover has a surface warmer surface.
The preliminary results show a possible application of this technique for a good
selection of raw hams destined to the successive dry-cured processing.
Others researches concerned to facilitate the control of heating and cooling
cycles on surface of different food samples, for example the apparatus realized by
Foster, Ketteringham, Swain et al., 2006. They design and develop an apparatus to
provide repeatable surface temperature-time treatments on inoculated food
samples using thermal imaging camera for temperature measurements.
20
°C and 2.4 °C on the sample surface, during heating and holding periods,
respectively (Foster, Ketteringham, Swain et al., 2006).
Manickavasagan, Jayas, White, and Jian (2006), studied the application of
thermal imaging for detection of hot spots in grain storage silos; the existence of
non-contact method to detect hot spot in a grain silo is very important. They
realize a small silo, filled with barley, to see the capability of thermal imaging to
detect a hot spot inside the silos. Artificial heat sources were used placed in 9
different locations inside the bulk and setup at 4 temperature levels (30, 40, 50,
and 60 °C) in each location. The infrared thermocamera was placed on the top of
the silos (the outer surface) and a hot spot was choosen. If the wind had a velocity
of 1, 1.5, 2 m/s it was impossible to detect the hot spot. The same situation
happened when the ambient temperature was 1°C and silo wall temperature was –
8 °C. Hot spot was detected from the thermal images when was located 0.3 m
from the silo wall and 0.3 m below the grain surface, respectively. They reported
that is not possible to use only the thermal imaging to monitor the grain
temperature on the silo.
Manickavasagan, et al. has developed in 2008 an infrared thermal imaging
system to identify eight western Canadian wheat classes. The wheat samples were
heated by a plate maintained at 90 °C, and the surface of the grain bulk were
imaged. The samples were imaged before heating, after heating for 180 s and after
cooling for 30 s using an infrared thermocamera.
This research showed the potential and accuracy of thermal imaging for
classification of wheat cultivars which are difficult to distinguish by visual
inspection, and may have potential to develop classification methods for varieties
21
for wheat from different crop years, samples mixed with defects (drought stressed
and other defects), and samples of varying kernel sizes and quality (such as
protein) within a class (Manickavasagan, & al., 2008).
More and more researchers study this field to evaluate the maturity state of
fruits and vegetables. The first ones were Danno, Miyazato and Ishiguro on 1980.
When the organic products (fruit and vegetables) generate heat in the metabolic
processes, the IR thermocamera can detect this temperature change on the surface.
The fruits and vegetables analyzed were: Japanese Persimmon, Japonese Pear and
tomato. They applied the same techniques as the ones used for grading apple for
bruise and to discriminate of hatching eggs during the incubation period. The
grade of maturity was divided in three categories: immaturity, maturity and
over-ripe depending on their colour, firmness and sugar content. The samples were kept
in two thermo-regulated rooms at 30 degrees and 5 degrees, respectively. The
changes in the surface temperature and the grade of maturity of samples were
investigated and also the relationship between the surface temperature and the
grade of maturity of the samples.
Varith et Al. (2003) have studied the use of infrared thermography to
detect bruises on apples stored at 3°C that were heated at 26°C with hot air. It’s possible to detect apple bruise with thermal imaging because differences in
temperature between sound tissues and bruised were detected, depending on their
thermal properties. To detect the bruised apples, four thermal properties were
associated in heat transfer: thermal diffusivity (α), thermal conductivity (k),
specific heat (Cp), and thermal emissivity (ε). Stroshine, 1998 related that the damaged cells release water into tissue air spaces, which may increase the thermal
22
migrates out of damaged tissue, leaving a brown bruise, reducing bruise mass,
density, specific heat and possibly thermal conductivity.
They reported the difference from the sound tissue within 30-180 s was at
least 1-2°C in thermal images, and the asymmetries differences were possibly due
to the differences in thermal diffusivity. They accept that these techniques provide
good information about automatic bruise sorting and maybe some information to
understand better the bruise tissue of the apples.
Other researches on apples were conducted by Veraverbeke et al. (2006) to
monitor the cooling rate and surface temperature in relation to the surface quality
and wax layer structure before and during storage. The first step in this research
was to determine the emissivity, 0.96, for two different cultivars Jonagored and
Elshof. After that they recorded the cooling from 20 °C to 12 °C they showed that
the Elshof apples had a faster cooling rate and lower temperature than Jonagored
apples, which may be related to differences in wax structure between these
cultivars. The changes in wax structure occurred during storage were not detected
using thermographic imaging.
The most recent researches to detect early bruise in apples resulted in a
system made by Baranowski et al. (2012) that incorporates the hyperspectral
imaging and infrared thermal imaging. Hyperspectral image analysis was
performed by application of principal components analysis (PCA) and minimum
noise fraction (MNF). Thermal imaging (3000-5000nm) is useful for bruise
recognition when an active approach (lock-in or pulsed-phase) is applied.
The created models of supervised classification based on VNIR, SWIR
and MWIR ranges show that best prediction efficiency for both distinguishing
23
obtained for models using these three ranges together; the conclusion is that it is
recommended to include MWIR range into sorting systems.
Thermal imaging was first used by Van Linden, Vereycken, Bravo,
Ramon, and De Baerdemaeker (2003) to detect tomato bruise.
They compared three temperature treatments with respect to bruise
detection. The analysis process contained the following steps: cooling the
tomatoes for 90 minutes at 1°C then warming them up in an oven at 70°C for 1 or
2 min. and shortly warming them up by means of microwaves during 7 or 15 s.
The most significant differences between bruised and intact tissue were after a 15s
treatment by means of microwaves, observing cold circular spots of bruises on
thermal images of the tomato surface.
This experiment provides a good method for automatic bruise detection of
tomatoes.
Wang et al. (2006) use the infrared thermocamera to determine the surface
temperature distributions of walnut kernels during radio frequency (RT) treatment
protocols to control insect pests in in-shell walnuts. A pilot system was used to
determine the effect of process parameters on walnut temperature distribution.
Temperatures of vertically oriented walnuts were 7.4 °C higher than those of
horizontally oriented walnuts. They report that the open shell walnuts are heated
much faster in RF systems than closed shell walnuts after 1.5 minutes of
bleaching. When they mix twice the walnuts during 3 min. of RF treatment
improved the heating uniformity of final walnut temperatures. This experimental
provide very useful information for designing an industrial scale quarantine
security process against insect pest in walnuts as an alternative to chemical
24
Fito et al. (2004) reported the use of infrared thermocamera to control
citrus surface drying by image analysis. Drying citrus surface is an important
operation in a fresh fruit processing plant, but air temperature is very difficult to
control. In industry, excessive air temperature is usually used or the fruit are left
long time in the drier, decreasing the fresh fruit shelf life and also causing a loss
of sensorial quality.
They tested a new system using infrared technique to control the surface
drying time by image analysis of the fruit surface temperature distribution. The
oranges from Valencia Late variety were washed with water or covered with wax
and were dried at 20, 25 and 35°C at different air velocity 1, 1.5, respectively 2
m/s. The fruit emissivity was measured by tempering the fruits at 20 degrees and
the value of that it’s 0.95. The surface temperature during the drying process was measured with an AGEMA 470 the lowest surface temperature of the fruit was
assumed to be the wet bulb temperature.
They considered that the drying time could be established when the
temperature at any point of the citrus surface exceeded this value.
They created also an empirical model to correlate drying times with air
conditions, and these parameters can be used in industrial control systems for
citrus surface driers. Image analysis of infrared thermography has a good
applicability in food industry to determine the moment when surface drying ends
and the peel drying begins. This nondestructive technique offers a real possibility
to control better the heat consumption and fruit quality.
Albert et al. in 2011 reported the study ―A film of alginate plus salt as an edible susceptor in microwaveable food‖. The research was made using infrared thermal imaging. As they said, cooking or warming battered and breaded foods in
25
a microwave oven results in a lack of crunchiness due the way microwaves heat
foods. They tried to solve this problem with a film of alginate gel with high salt
concentration between substrate and batter used as an edible susceptor.
They prepared chicken nuggets sample with alginate coating set in a
calcium chloride (3%) plus sodium chloride (10%, 20%, and 30%) solution bath.
The prefried nuggets were cooked in a microwave oven at different
cooking times were used: 15, 20, 25, 30, 35, 40, 45, 50, 55 and 60 s. A thermal
camera was used to observe how heat was distributed once this new film of
alginate plus salt was incorporated. They took out the nugget sample from the
microwave after each preselected time, sectioning it perpendicularly through the
center immediately after, separating the two halves, and thermographing the two
exposed cross sections. They set the emissivity of the nuggets at 0.920. The
temperature distribution was registered from each sample’s thermogram. They
observed that the alginate films produced more even heating patterns of the
nuggets and shorter cooking times and it can be concluded that this technique has
given a useful tool to study the edible susceptor performance.
Lahiri et al. (2012) applied infrared thermography in the microbiology
field research. They studied the detection of some pathogenic gram negative
bacteria (Vibrio cholerae, Vibrio mimicus, Proteus mirabilis, Pseudomonas
aeruginos) using this technique. The conventional methods of enumerating
bacteria require labor-intensive and are usually time consuming. During the
metabolic activities all the organisms generate heat, measuring this energy is a
viable tool to detect and quantify bacteria.
They also observed that, the energy content; defined as the ratio of heat
26
to the surrounding, vary linearly with the bacterial concentration in all the four
pathogenic bacteria (Lahiri et al., 2012).
This research shows that infrared thermography could be employed as a
real-time, non-contact alternative for quantification of clinically significant
pathogens. More studies are required to test the universality of this new approach
27
I.3. References
Albert, A., Salvador, A., Fiszman, S.M. (2011). A film of alginate plus salt as an
edible susceptor in microwaveable food. Food Hydrocolloids, 27, 421 - 426
Baranowski, P., Mazurek, W., Wozniak,J., Majewska,U. (2012). Detection of
early bruises in apples using hyperspectral data and thermal imaging. Journal of Food Engineering 110, 345–355.
Burnay, S.G, Williams, T. L. & Jones, C. H. (1988) Applications of Thermal
Imaging, Bristol: Hilger
Castro, L. M. & Gavarrete, E. (2000). Competitividad en Centroamérica 1999.
CEN 1405, Centro Latinoamericano para la competitividad y el desarrollo sostenible. CLACDS/INCAE, San José.
Carino, N.J. (1994). Concrete Technology: Past, Present and Future.
Nondestructive Testing of Concrete: History and Challenges, American Concrete Institute (ACI SP-144), 623-678.
Chrzanowski, K., & Rogalski, A. (2006). Infrared devices and techniques.
Handbook of Optoelectronics (Two-Volume Set) Edited by Robert G . W . Brown and John P Dakin Taylor & Francis, 653–692
Costa, L. N., Stelletta, C., Cannizzo, C., Gianesella, M., Lo Fiego, D. P., & Morgante, M. (2007). The use of thermography on the slaughter-line for the
assessment of pork and raw ham quality. Italian Journal of Animal Science, 6, 704 - 706.
Danno, A., Miyazato, M., & Ishiguro, E. (1980). Quality evaluation of
agricultural products by infrared imaging method. III. Maturity evaluation of fruits and vegetables. Memoirs of the Faculty of Agriculture Kagoshima University, 16, 157 - 164.
28
Du, C. J., & Sun, D. W. (2004). Recent developments in the applications of
image processing techniques for food quality evaluations. Trends in Food Science & Technology, 15, 230 - 249.
Fito, P. J., Ortola´, M. D., De los Reyes, R., Fito, P., & De los Reyes, E. (2004).
Control of citrus surface drying by image analysis of infrared thermography. Journal of Food Engineering, 61(3), 287 - 290.
Flir (2010). The ultimate infrared handbook for R&D professionals.
Foster, A. M., Ketteringham, L. P., Purnell, G. L., Kondjoyan, A., Havet, M., & Evans, J. A. (2006). New apparatus to provide repeatable surface
temperatureetime treatments on inoculated food samples. Journal of Food Engineering, 76, 19 - 26.
Foster, A. M., Ketteringham, L. P., Swain, M. J., Kondjoyan, A., Havet, M., Rouaud, O. et al. (2006). Design and development of apparatus to provide
repeatable surface temperature etime treatments on inoculated food samples. Journal of Food Engineering, 76, 7 - 18.
Fuller, M. P. & Wisniewski, M. (1998). The use of infrared thermal imaging in
the study of ice nucleation and freezing of plants. Journal of Thermal Biology, 23, 81 - 89.
Giaime Ginesu, Daniele D. Giusto, Volker Märgner, & Peter Meinlschmidt
(2004). Detection of Foreign Bodies in Food by Thermal Image Processing, IEEE Transactions on industrial electronics, Vol. 51, no. 2.
Goedeken, D. L., Tong, C. H., & Lentz, R. R. (1991). Design and calibration of
a continuous temperature measurement system in a microwave cavity by infrared imaging. Journal of Food Processing & Preservation, 15, 331 - 337.
29
Gowen, A. A., Tiwari, B.K., Cullen, P.J., O’Donnell, C.P., McDonnell, K.
(2010). Applications of thermal imaging in food quality and safety assessment. Trends in Food Science & Technology 21, 190-200
Herschel, W. (1800) Experiments on the refrangibility of the invisible rays of the
Sun Phil. Trans. Roy. Soc. London 90 284
Ibarra, J. G., Tao, Y., Walker, J., & Griffis, C. (1999). Internal temperature of
cooked chicken meat through infrared imaging and time series analysis. Transactions of ASAE, 42, 1383 - 1390.
Ibarra, J. G., Tao, Y., & Xin, H. (2000). Combined IR imaging-neural network
method for the estimation of internal temperature in cooked chicken meat, Society of Photo-Optical Instrumentation Engineers 39, 3032 - 3038
Kaiser, P. K. (1996). The joy of visual perception. http://www.yorku.ca/eye/spectru.htm Accessed 15 Jan 2011.
Kolzer, J., Oesterschulze, E., Deboy, G. (1996). Thermal imaging and
measurement techniques for electronic materials and devices, Microelectronic Engineering, 31, 251–270
Lahiri, B.B., Divya, M.P., Bagavathiappan, S., Thomas, S., Philip, J. (2012).
Detection of pathogenic gram negative bacteria using infrared thermography, Infrared Physics & Technology 55, 485 - 490
Luong, M.P. (2007). Introducing infrared thermography in soil dynamics.
Infrared Physics & Technology, 306-311
30
Maierhofer, Ch., Arndt, R., Röllig,M., Rieck, C., Walther, A., Scheel & H., Hillemeier, B. (2006). Application of impulse-thermography for non-destructive
assessment of concrete structures. Cement & Concrete Composites 28, 393-401
Maldague, X., Galmiche, F., & Ziadi, A. (2002). Advances in pulsed phase
thermography. Infrared Physics & Technology, 43, 175 -181.
Maldague, X., (2002), Introduction to NDT by Active Infrared Thermography,
Materials Evaluation, 6, 1060 -1073,
Manickavasagan, A., Jayas, D.S., White, N.D.G., & Paliwal, J. (2008). Wheat
class identification using thermal imaging. Food and Bioprocess Technology 3, 450–460
Manickavasagan, A., Jayas, D. S., White, N. D. G., & Jian, F. (2006). Thermal
imaging of a stored grain silo to detect a hot spot. Applied Engineering in Agriculture, 22(6), 891 - 897.
Mayer F, Feldmann, O. (2001) Optical Measurements (Techniques and
Applications), 2nd edn. Springer-Verlag,
Meola, C., Carlomagno, G.M. (2004). Recent advances in the use of infrared
thermography, Measurement Science and Technology 15, 27–58.
Mohsenin, N. N. (1996). Mechanical damage. Physical Properties of Plant and
Animal Materials, 481 – 615. Canada: Gordon and Breach Publishers.
Mori, M., Novak, L., Sekavčnik, M., Kuštrin, I. (2008). Application of IR
thermography as a measuring method to study heat transfer on rotating surface - Forschung im Ingenieurwesen, Springer-Verlag.
Moss, C.E., Ellis R.J., Murray W.E., Parr, W.H., (1988). Nonionizing radiation
31
Nott, K. P., & Hall, L. D. (1999). Advances in temperature validation of foods.
Trends in Food Science & Technology, 10, 366 - 374.
Omar, M., Hassan M. I., Saito K., and Alloo, R. (2005). IR self-referencing
thermography for detection of in-depth defects, Infrared Phys. Technology, vol. 46 (4), 283 - 289.
Petersen J . K . (2012). Handbook of Surveillance Technologies, Third Edition
CRC Press.
Rao, D. S. Prakash (2008), Infrared thermography and its applications in civil
engineering, Indian Concrete Journal
Rogalski, A. (2000). Infrared Detectors. Gordon and Breach Science Amsterdam:
Gordon and Breach)
Ross, W. (1994) Introduction to Radiometry and Photometry, Boston: Artech
Sakagami, T., Kubo, S. (2002). Applications of pulse heating thermography and
lock-in thermography to quantitative nondestructive evaluations. Infrared Physics & Technology 43, 211–218
Shepard, S. M., Ahmed, T., & Lhota, J. R. (2004). Experimental considerations
in vibrothermography. Experimental considerations in vibrothermography. Proceedings of SPIE, 5405, 332.
Stroshine, R. (1998). Thermal properties and moisture diffusivity. Physical
Properties of Agricultural Materials and Food Products. 217 –238. Purdue University, West Lafayette, IN.
Vadivambal, R., & Jayas, D. S., (2010). Applications of thermal imaging in
32
Van Linden, V., Vereycken, R., Bravo, C., Ramon, H., & De Baerdemaeker, J. (2003). Detection technique for tomato bruise damage by thermal imaging.
Acta Horticulturae (ISHS), 599, 389 - 394.
Varith, J., Hyde, G. M., Baritelle, A. L., Fellman, J. K., & Sattabongkot, T.
(2003). Non-contact bruise detection in apples by thermal imaging. Innovative Food Science and Emerging Technologies, 4, 211 - 218.
Vavilov, V. P., (1992) Thermal non-destructive testing: short history and
state-of-art Proc. QIRT 92 (Paris) ed D Balageas, G Busse and G M Carlomagno (Paris: EETI editions), 179–93
Veraverbeke, E. A., Verboven, P., Lammertyn, J., Cronje, P., De Baerdemaeker, J., & Nicolai, B. M. (2006). Thermographic surface quality
evaluation of apple. Journal of FoodEngineering, 77, 162 - 168.
Wang, S., Tang, J., Sun, T., Mitcham, E. J., Koral, T., & Birla, S. L. (2006).
Considerations in design of commercial radio frequency treatments for postharvest pest control in in-shell walnuts. Journal of Food Engineering, 77, 304 - 312.
Weil GJ. (1992) Non-destructive testing of bridge, highway and airport
pavements. No Trenches in Town Proceedings of International Conference, Paris, France; 243–6.
Workmaste, B. A., Palta, J. P., & Wisniewski, M. (1999). Ice nucleation and
propagation in cranberry uprights and fruit using infrared video thermografy. Journal of the American Society for Horticultural Science, USA, 124
33
II. APPLICATION OF INFRARED THERMOGRAPHY IN THE
FOOD INDUSTRY
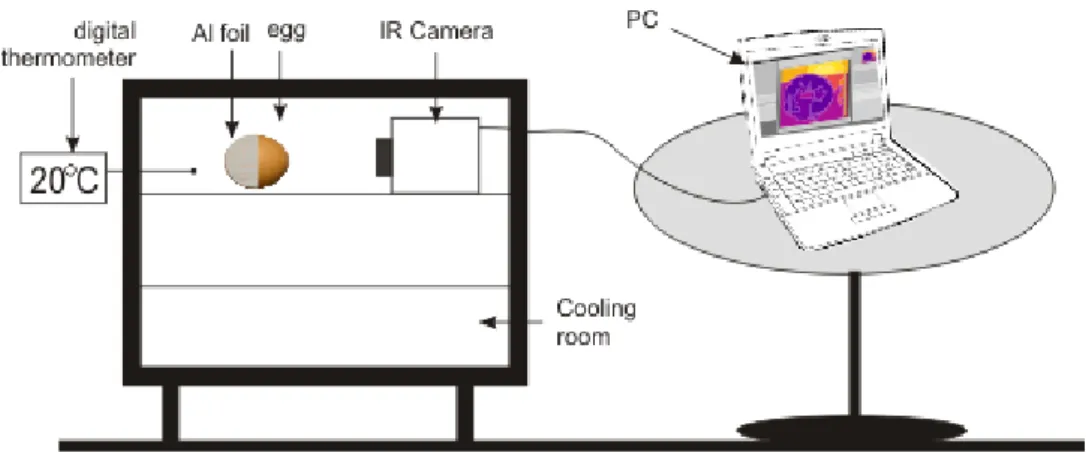
II.1 Experimental validation of a numerical model for hot
air treatment of eggs in natural convection conditions and with
hot-air jet with FLIR- IR thermocamera
II.1.1 Introduction
It is well known that eggs are a very important nutritive product, but also
that there are certain problems that can derive from the consumption of eggs with
pathogenic bacteria. The main goal and all effort should concentrate to inactivate
these microorganisms in order to provide consumers safe and healthy products. In
this direction, the use of all new technology is required and provided to food
operators so they can have better control methods during the production flux. The
most efficient known decontamination method for egg shells was reported by
Standelman (1996) and Hou (1996) with no significant differences regarding the
denaturation of protein between the fresh and pasteurized eggs in the oven. At the
same time, they reported a reduction of the Salmonella Enteritidis by 5 log 10
loads on yolk of eggs, after the treatment in the oven at 55 °C for 180 min.
On the other hand, James et al. (2002) reported significant reduction in
Salmonella numbers without damaging the egg content, with heat treatments
using a hot-air gun. The aim of this research was to validate the numerical model
for hot air treatment of eggs in natural convection condition and with hot-air jet,
34
The models realized by Cevoli et al. (2010) and Fabbri et al. (2010) to
simulate a hot-air treatment of the egg shell was compared with experimental data
on the shell eggs using the thermocouples.
For the first validation, the treatment with hot air, in natural convection
conditions, the calculated temperature was compared with experimental data on
the egg shell obtained using the infrared thermocamera.
For the second validation, the treatment with hot-air jet using high
temperatures (300-500°C) to decontaminate the shell egg, the calculated
temperatures, were compared with experimental data observed. The potential of
treatments using high temperature was tested in the past by James et al. (2001)
and Pasquali et al. (2009). James et al. (2001) heat the eggs at 500 degrees for 8
seconds, but they don’t make any microbiological test. Instead, Pasquali et al.
(2009) used the prototype realized in the past to do a decontamination of shell
eggs using a hot air jet (600°C, two shots) in one side with an interval of 30
seconds and with an cold air jet for 30 seconds (1 shot) on the opposite side of the
egg. They investigated 380 eggs load on S. Enteritidis, during 24 days of storage
at 20 °C. Half of them were head treated, and half not. The hot air treatment
reduces the bacterial S. Enteritidis load on eggshells up to 1.9 log and they
conclude that the pasteurization using the hot air are useful for decontamination of
table eggs.
This research is important to determine the distribution of temperature on
the egg shell surface to have a good control during the decontamination of eggs
35
II.1.2 The eggs
The European Parliament and the European Council defined by Regulation
(EC) No 853 /2004, the "Eggs" means eggs in shell – other than broken, incubated
or cooked eggs – that are produced by farmed birds and are fit for direct human
consumption or for the preparation of egg products. When shell is removed, we
can talk about the ―egg products‖. In the food industry the most used egg products are liquid, frozen and dried, products that are safe for consumers.
The eggs are one of the highest quality sources of important nutrients and
they are also easily digested. According with FAO Stats, the level of global
production is about 1.182 billion eggs per year in 2011 or 64 million tons. The
sector of poultry and eggs production was the most dynamic sector in the last 10
years, which was reflected in growing demand for these products. According with
FAO, 2010, in the developing countries the consumer preferences are changing,
increasing the protein demand, especially for low-priced foods such as eggs,
gradual shift in consumption from pork to poultry. The easy way to cook the eggs
and poultry meat changed the lifestyle of many people and this will continue in
the future.
Poultry meat and eggs are a very important source of protein and can be
eaten by all healthy consumers. The eggs are 88.5% edible and are composed of
three main parts: shell, egg white, egg yolk. The shell of an egg is a porous part
that allows the oxygen to enter for the chick but bacteria and different odours can
also enter, and water and CO2 can escape.
The shell egg is usually strong and protects the egg against bacteria. The
36
The egg white has 2 layers, one near to the shell and another near to the yolk
(FAO, 2010). Over the 60% of the world’s eggs are produced in industrial systems and the biggest producers are China, United States, India, Mexico.
Eggs are classified in Europe as follows : small size ( between 42g and
53g), medium size ( 53-63 g ), large ( 63-73 g ), very large ( 73 g and over ) .
The eggs have a high nutritional content: the white part contains 10.5%
proteins, 88.5% water, riboflavin and more vitamins from B group and on the
other hand the yolk part has more nutrients, 16.5% protein, 33% fat, 50% water,
vitamins A, E, K, D, some minerals, emulsifier (lecithin) (FAO, 2010).
In food preparations the eggs are used for: thickening - because of the
coagulation of the egg proteins; emulsifying – to make mayonnaise, cakes because
eggscontain lecithin; binding – ingredients for rissoles, croquettes; coating – they
form the protective layer during frying foods and prevent overcooking; glazing –
used to produce a golden brown shiny glaze during baking the pastries and bread.
Salmonella
One of the most problematic things for using eggs is the contamination
with bacteria such as Salmonella enterica serotype Enteritidis, existing in the
hen’s ovary or oviduct before the shell forms around the white part and yolk. S. Enteritidis is the serovar which causes more than 60% of human infections with
Salmonella in the European Union (EFSA, 2009). Salmonella belongs to the
Enterobacteriaceae family and is a mesophilic bacteria, developing at
temperatures between 5.2°C and 47°C and optimally between 35°C and 37°C, at
37
Gram-negative, 0,3 to 1μm wide and 1 to 6 μm microns long (Romane et al.
2012).
The genus Salmonella consists of only two species:
- S. enterica, which is divided into six subspecies: S. enterica subsp, enterica,
S. enterica subsp, salamae, S. enterica subsp, arizonae, S. enterica subsp,
diarizonae, S. enterica subsp. houtenae, and S. enterica subsp, indica; and
- S. bongori (Popoff & all., 1998)
A total of 2501 different Salmonella serotype were identified until 2004,
almost all of them causing disease in humans. Other serotypes affect only a few
animal species (host-spectrum), like Salmonella Choleraesuis in pigs, Salmonella
Dublin in Cattle. When this serotypes cause disease in humans, it is very invasive
and can be life-threatening. Usually, these kind of strains cause gastroenteritis,
which is often uncomplicated and does not need treatment, but can be severe for
people with weakened immunity, like the young and the elderly patients (WHO,
2005). Salmonella Enteriditis and Salmonella Typhimurium are the two most
important serotypes for salmonellosis transmitted from animals to humans. S.
Enteritidis caused the most recent epidemic, which peaked in humans in 1992 in
many European countries. (WHO, 2005). Infection from contaminated food
occured for humans when individuals had contact with infected animals, including
domestic animals such as dogs or cats.
The contamination can come from faeces when the bacteria pass the pores
of the shells of the egg. The most frequently foodborne diseases worldwide are
salmonellosis. In the first few minutes, after the oviposition, the eggshell can be
38
Padron, 1990. After the oviposition, the bacteria can penetrate the eggshell and
membranes more easy because the egg comes to temperatures cooler than the
chicken body temperature (42 °C), perhaps creating a negative pressure (Board,
1966). The ideal conditions for penetration of the egg shell by bacteria was
hypothesized by Berrang et al., 1999, and can be the moment a warm egg
encounters a moist and cool environment.
According with EFSA (2012) the salmonellosis is the second most
frequently reported zoonosis in UE and continues to decrease. Unfortunately we
have reported data about the economic cost of the disease only for few countries.
According with World Health Organization (2005) in the United States of
America an estimated 1.4 million non-typhoidal Salmonella infections, resulting
in 168 000 visits to physicians, 15 000 hospitalizations and 580 deaths annually,
with a cost estimates per case of humane salmonellosis range from 40 to 4,6
million US$, respectively for uncomplicated cases to cases ending with
hospitalization and death. It’s estimated a total cost associated with Salmonella at US$ 3 billion annually in the United States of America (WHO, 2005). On the
other hand, in Denmark, the annual estimated cost of foodborne salmonellosis is
US% 15, 5 million in 2001, representing 0.009% of Gross domestic product
(GDP).
The symptoms of human salmonellosis are usually characterized by acute
onset of fever, abdominal pain, diarrhoea, nausea and sometimes vomiting. In
some cases, particularly in the very young and in the elderly, the associated
dehydration can become severe and life-threatening. Serious complications occur