Introduction
The economic and social health of urban areas depends to a large extent on the performance of their transportation systems (Meyer and Miller 2001, European Parliament 2011). Poor urban transportation services have a negative impact on the economy and development of a city (World Bank 2002). However, in many areas of the world, urban transportation is getting worse rather than better with economic development (Peñalosa 2005). This negative trend is not necessarily related to the lack of investment, but, in some cases, to the side effects of policies that do not consider the complexity of the environment in which decision-makers operate – i.e. the positive effect of an improved mobility system have to be weighted, on the long run, with the negative externalities such as increasing the demand of mobility and effects on the spatial distribution of the residents (Waitt and Harada 2012).
This kind of behaviour occurs when policy interventions do not take into account the need to balance the different dimensions that characterize every urban system and influence its sustainable development. These dimensions are grouped into three main categories: economic, social and environmental (Lautso et al. 2004, Litman 2017). The presence of multiple feedback processes existing between these realms determines an environmental complexity (Forrester 1961) which makes the measurement and evaluation of urban transportation systems performance and sustainability more challenging.
The environment characterizing the urban area may be seen to have three characteristics, namely: pluralism, institutional fragmentation, and scientific uncertainty (Head and Alford 2013): • Pluralism concerns the different needs and expectations of the community in relation to transportation systems in terms of infrastructures and supplied services. Different target populations demand different mobility services such as different businesses perceive infrastructure adequacy in different ways.
• Institutional fragmentation characterizes service provision when more than one player is Abstract: In a global context characterized by a growing and rapid urbanization, achieving a good performance in the urban transportation domain is closely linked to the pursuit of sustainability, seen as the ability to satisfy social needs – i.e. improving quality of life – without compromising the ability of the future generation to satisfy theirs. Addressing sustainability assumes to deal with certain social characteristics – namely pluralism, institutional fragmentation and uncertainty – that makes the challenge complex. In order to deal with this complexity, literature embarked the road of developing detailed models to support planning activities and decision-making processes. However, a number of limits raised with reference to the usefulness of these models to planning processes. This paper suggests an innovative planning approach tailored to complex urban transportation systems. This approach is based on the Performance Management theory and the System Dynamics modelling.
Key Words: urban transportation planning, system dynamics, performance management, sustainable urban mobility.
COMBINING SYSTEM DYNAMICS AND PERFORMANCE
MANAGEMENT TO SUPPORT SUSTAINABLE URBAN
TRANSPORTATION PLANNING
Guido NOTO
involved. This could be the case of a metropolitan area in which the bus services are run by several private companies that provide the service under the standard requirements of different public authorities. It is hard to monitor performance and to check whether public or private investments provide the expected return in terms of ‘value’ for the entire community.
• Scientific uncertainty permeates transportation systems in many aspects, among which we may identify environmental impacts and users’ behaviour.
The three factors mentioned above characterize the environment in which ‘wicked problems’ exist (Head and Alford 2013). The term ‘wicked’ refers to issues that are difficult to define and manage because they often lead to counterintuitive behaviours in terms of time (trade-offs between short- and long-term) and space (trade-off between different institutions) when actions are taken to resolve them (Rittel and Weber 1973, Australian Public Service Commission 2007, Head and Alford 2013).
These wicked features make public policies difficult to monitor. Linear transportation planning approaches may produce poor results when dealing with these kind of issues because they are excessively static in assessing performance at a system level. The classical science approach, that consists in the isolation of the elements of the observed universe so as to understand the whole, is not suitable to deal with wicked and sustainability related issues (Hjort and Bagheri 2006). When dealing with urban transportation, “classical-science” models only focus on demand and supply sub-systems in a short-time perspective and without considering the feedback relationships intervening among them (Zuidgeest and van Maarseveen 2000, Wang et al. 2008). The result of the adoption of such approaches is the implementation of policies that lead to counterintuitive behaviours such as encouraging the use of private modes of transportation that leads to more congestion, or enhancing segregation of specific neighbourhoods.
In order to overcome the limits of linear planning and to tackle wicked problems, a systemic (or ‘holistic’) view is recommended (Rittel and Webber 1973, Head and Alford 2013). This view allows us to think broadly about the social problems and their possible solutions, considering major stakeholders’ interests and expectations. For example, a systemic view would let us take into consideration possible behavioural distortions coming from the introduction of new constraints (e.g. speed limits, tolls) or new infrastructure (e.g. new motorways). For these reasons, over the last fifty years, transportation modelling has evolved producing always more sophisticated models able at capturing the systemic and dynamic complexity that characterizes mobility issues.
One of the main tool that was developed so as to cope with complexity is the land use transport interaction (LUTI) approach, whose aim is to understand the interactions between the economic and social development and transport demand (Pfaffenbichler et al. 2010). Among these models we find several applications such as IRPUD (Wegner 1998), DELTA (Simmonds 1999), Urbansim (Waddel 2002), MARS (Pfaffenbichler 2008, Pfaffenbichler et al. 2010) and other agent-based models (such as MATSim). The adoption of these models succeeded in capturing the multiple-feedback processes existing between the different urban dimensions. However, one of the main issues that LUTI and agent-based models faces is related to the scarce support that these had on actual planning processes (Saujot et al. 2016). In fact, except for the MARS model, all the other mentioned models have gone down the route of using always more detailed models (Pfaffenbichler et al. 2010). The result is that often these models are scarcely understood by planners and decision makers, who are not inclined to use these sophisticated “black boxes” (Pfaffenbichler et al. 2010, Saujot et al. 2016).
indicators to predict and monitor the effects of implemented policies and to eventually take corrective actions (Wang et al. 2008, Litman 2017). These performance measures should be coherent with the systemic approach mentioned above and therefore must adopt the sustainability perspective necessary to deal with the wicked problems.
Sustainability may be defined as the ability to meet “the needs of today’s citizens without prejudicing the ability of future generations to meet their own needs” (United Nations 1987). Tackling sustainability means to relieve the pressure of current social, economic and environmental challenges. With reference to mobility this means to deal with traffic congestion, air quality, consumption of non-renewable resources, CO2 emissions, social exclusion and
urban sprawl (European Parliament 2011).
The aim of this paper is to suggest an intuitive and easy-to-use urban transportation modelling approach for tackling wicked problems and designing effective policies oriented to tackle sustainability issues through the development of specific performance indicators. In order to accomplish this purpose, the current work aims at answering the following research questions: • Which features should the planning approach have, that are tailored to urban
transportation and consider its social complexity?
• How such an approach may include performance measures to monitor the sustainability of the service in terms of resources and citizen satisfaction?
In order to answer these research questions, a modelling approach that considers the social, technical and financial aspects characterizing the urban mobility performance will be developed and discussed. This is based on Performance Management (PM) theory (Neely 1999, Otley 1999) and System Dynamics (SD) modelling (Forrester 1961, Sterman 2000).
An example based on a district of Buenos Aires (Argentina) is here presented. This is based on the development of a simulation model that, through five performance indicators, explains how transportation may develop and influence the local attractiveness and economic viability over the next twenty years.
Methodology
Due to the complexity of the environment in which urban transportation organizations operate, linear planning approaches appear to be excessively static in providing the appropriate performance measures (Wang et al. 2008). The result is that these kind of approaches tend to excessively focus on the service outputs, ignoring the final outcome for the community. In order to deal with social complexity, the adoption of a systemic approach is suggested (Rittel and Webber 1973, Head and Alford 2013). As previously mentioned, from the 1960s transportation modellers, there start to develop new generation models able to gather the multiple-feedback processes existing in urban transportation systems with specific reference to those relating mobility issues with economic and spatial issues. However, few efforts have been made by the academics to fill the gap between lab application and operational use for planning practice (Wegener 1994, Saujot et al. 2016). Many researchers and modellers (Vonk et al. 2005, Brömmelstroet and Bertolini 2008, Waddell 2011) highlighted the need to connect with end-users (e.g. planners, public agencies or transport authorities). The distance between modellers and end-users is mainly depending on the model complexity and the decision makers’ difficulty of understanding these models (Saujot et al. 2016). In fact, a trend that characterized LUTI models such as other transportation modelling techniques is related to the use of always more detailed models (Pfaffenbichler et al. 2010). An exception to this trend is represented by the MARS models which are built at a more aggregate or strategic level (Pfaffenbichler et al. 2010).
These transportation modelling techniques take advantage from the System Dynamics (SD) approach. System Dynamics could be defined as “a perspective and set of conceptual tools that enable us to understand the structure and dynamics of complex systems” (Sterman 2000: 7). The primary assumption of SD is that persistence dynamics of complex systems arise from their casual structure – meaning all of the constraints, rules and goals that cause people to behave in a certain structured way (Meadows 1980). The core concept of SD is the feedback (two-way causation) process existing between the variables in a system. Complex systems are indeed characterized by multiple feedback loop structures and non-linear relationships between variables (Forrester 1961). Representing those feedbacks helps the analyst to understand the system structure which generates counterintuitive behaviour.
Others studies that applied System Dynamics to urban transportation issues may be found in Wang et al. (2008), Armah et al. (2010), Haghshenas et al. (2015) and Noto and Bianchi (2015). Analysing this contribution, it emerges how this methodological approach is suitable in order to adopt a sustainable perspective. Particularly: it supports a holistic perspective that considers the multiple internal dimensions of a system such as population, economic development, infrastructures, etc.; it provides the possibility to design key performance indicators oriented at measuring and monitoring the system’s external dimensions (economic, social and environmental); it allows planners to analyse transportation performance both in the short- and the long-term.
In the present work, SD was combined with traditional PM frameworks. This was done so as to take into account the need to monitor and measure urban mobility performance over time. PM allows us to build a set of performance indicators based on the objectives that one is willing to achieve. In the urban transportation case, the objectives are related to sustainability and the sustainable development of the mobility system (Wang et al. 2008, Litman 2017).
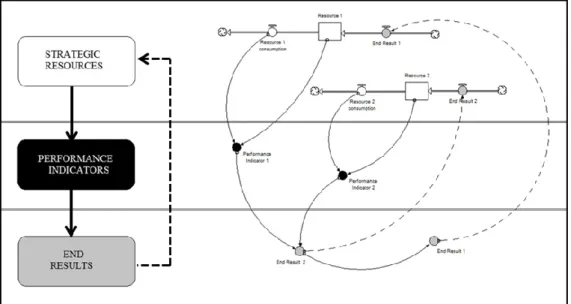
System Dynamics and Performance Management tools have been already merged by several authors (Morecroft 1999, Warren 2004, Bianchi 2010 and 2012, Cosenz and Noto 2016). According to an ‘instrumental view’ of performance, Bianchi (2010 and 2012) suggests that social systems can be framed by distinguishing strategic resources (resources held by the whole-system), end-results (what we want/need to achieve) and performance indicators (intermediate results that explain us how to employ the strategic resources in order to achieve our end-results).
In SD terms, we can represent strategic resources as ‘stock’ variables, meaning variables that are subjected to accumulation/depletion processes which characterize the state of the system. An example could be given by the number of vehicles available for the public transportation service: it is a variable that can be measured in unit and that can be observed at a given moment in time.
End-results are typically represented as ‘flows’. A flow is what changes the stock over a time period. Back to the number of vehicles example, one of its flow would be the ‘vehicles purchase rate’. This, that can be measured as unit per time, says to us how many vehicles have been purchased during the considered time period. The end-results depend on the intermediate results (performance indicators) that are causally determined by the employment of strategic resources. These indicators are usually measured in relative terms by comparing the actual state of a variable with a target value or a benchmark (e.g. no. of vehicles available in district A over the no. of vehicles available in district B). When dealing with social issues such as transportation, the indicators should not focus only on economic measures but should also include aspects relative to other dimensions of performance. As already mentioned in the previous paragraph, in order to run a sustainability oriented analysis, transportation performance measures should include economic, social and environmental measures (Lautso
et al. 2004, Haghshenas et al. 2015, Litman 2017).
In order to measure the transportation system performance in a sustainability perspective, some authors – such as Haghshenas et al. (2015) or Litman (2017) – focused on the development of a set of indexes. These are values or ratios that could be used to monitor performance. However, these are not causally linked to the achievement of the system’s end results. Vice versa, the indicators resulting from the adoption of the instrumental view mentioned above (Bianchi 2012) can be considered drivers of the system performance – i.e. intermediate results that are causally linked to the end-results achievement.
Closing the loop, end-results provide an endogenous source in a system to the accumulation and depletion processes affecting strategic resources. The structure model is then completed by linking the relevant stocks and flows by equations taking the form of integral, differential, or other forms, which determine a certain behaviour of the system over time (Wang et al. 2008). This approach empowers a systemic view of transportation systems, since each performance driver shows how the employment of the linked strategic resources affects all the other interdependent resources within the system (Noto and Bianchi 2015). Due to this interdependence, each strategic resource has the power to foster others in the same system, or not.
Fig. 1 shows the dynamic performance management framework. The analysis starts from the bottom part of the image which concerns the end-results identification. These are causally related to performance indicators variables, which are represented as auxiliary variables (in black). These indicators represent the intermediate results that explain how the end- ones are achieved. Performance indicators depend (causal relationships) on the usage of strategic resources (squared variables). Strategic resources accumulate value when the end-results are achieved and they decrease it when they are employed in new activities.
A general and comprehensive urban transportation model structure
When focusing on urban transportation dynamics, we may conceptually frame a model into different modules so as to take into account the main dimensions that characterize its structure (Wang et al. 2008, Haghshenas et al. 2015).
Considering the individual characteristics of each city, it is not possible to develop a general and quantitative model applicable to each urban system without a strong adaptation effort. This is due to the specificities in terms of social and geographical characteristics that distinguish each city and urban district and which require an ad hoc analysis of the urban social context. However, it is possible to define a general model structure including the main dimensions that characterize urban transportation systems and making explicit the dynamics that link those dimensions.
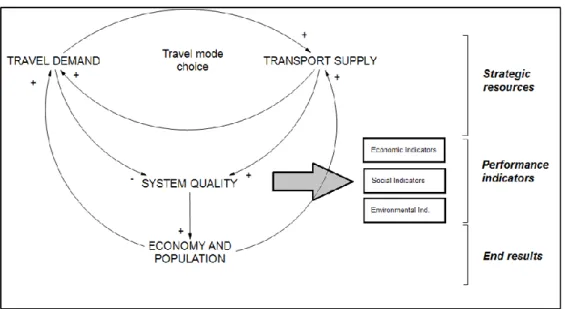
The end-results that a transportation system should achieve are related to broad community outcomes (Della Porta and Gitto 2013), such as quality of living. These results determine the urban area’s attractiveness which produces its effect in terms of economic development and in- and out-migration (Wang et al. 2008). End-results can be achieved through the pursuit of those intermediate results that determine “good” mobility. These intermediate results, that directly affect system quality, can be built according to the DPM approach examined in the previous paragraph and they are aimed at measuring mobility performance according to the threefold sustainability perspective (economic, social and environmental).
System quality results from the match between travel demand and transport supply. These two dimensions are linked by direct relationships and influence each other. On the one hand, an increase in demand determines an effort toward the adaptation of transport supply. This can take different forms based on the local area specific objectives and goals – e.g. new infrastructure (road building, new metro line, new cycle lane, etc.) or services (new bus routes, web facilities, frequency of public service, etc.). On the other hand, transport supply provides a set of transportation modes and infrastructures that make users reacting by choosing between them based on their preferences.
In the last instance, both travel demand and transport supply are influenced by the end-results achieved – e.g. a bigger population with a growing income determines bigger travel demand, as such bigger financial resources determine the possibility to enhance transport supply (Fig. 2).
When dealing with real planning in cities, this general structure needs to be adapted to their specific characteristics and problems. To do that, we suggest the adoption of SD research principles which define four steps to be undertook, also called P’HAP (Moxnes 2009):
• Problem identification (P’): identify symptoms and choosing a representative reference behaviour;
• Hypothesis (H): designing the system structure that may generate the problem;
• Analysis (A): testing structure and behaviour (through simulation) so as to understand if the hypothesis previously formulated is rejected or not;
• Policy design (P): finding policies that produce less problematic behaviours.
Through these steps it is possible to combine both scientific methods used to understand the roots of problems – P, H, A – and policy design. This is the challenge that modellers need to face in order to foster the adoption of transportation models by decision-makers and planners. In the following section, a case study is developed according to the P’HAP research approach.
This case shows an application of DPM to urban transportation planning and it discusses its advantages and pitfalls.
Results and Discussion
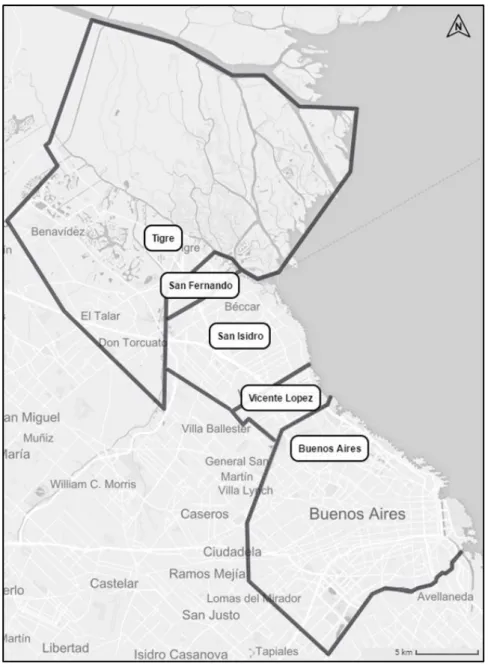
The case study here developed concerns the “Region Metropolitana Norte” (RMN), a complex of four municipalities composing the Buenos Aires urban area (Fig. 3). This region is one of the most important (in terms of production) in the whole Province of Buenos Aires. Even though the four municipalities composing it (Vicente Lopez, San Isidro, San Fernando and Tigre) represent a small portion of the total province area, they contribute about 10% to the total province GDP production (Direccion Provincial de Estadística 2010). Due to its proximity to the capital city of Argentina, many of the people residing in these municipalities conduct business in Buenos Aires. Therefore, every morning and evening, they go back and forth from home to the capital city (CABA). This behaviour causes traffic congestion in the main roads connecting the two areas.
Traffic congestion between RMN and CABA, and the related effect on local attractiveness and mobility performance, was identified by the experts’ interviews as the major problem (P’) of RMN transportation system.
The hypothesis (H) about the nature of this problem, namely traffic congestion, is related to the inadequacy of the existing transport supply in respect to the current demand. In order to tackle this problem, it is important for a policy solution to consider the set of causal relationships that affect the urban system in a dynamic perspective (Sterman 2000). The risk is to incur counterintuitive behaviours that, in the long-run, may result in a worse performance of the mobility system.
Traffic congestion impact on mobility is twofold (European Parliament 2011): first it has a direct economic impact on citizens in terms of delays and costs associated with the increased depreciation of vehicles and additional fuel and oil consumption; second, it negatively impacts
the environment (air and noise pollution, greenhouse gases emission). This congestion is determined by the number of vehicles travelling in the same road at the same time (Wang et al. 2008).
According to Golob (1990), the main features that influence the users’ travel mode choice are travel time and cost. Therefore, if we want to reduce the number of vehicles in the street at a given moment in time, we should make collective modes of transportation more attractive in terms of cost and time.
Travel mode choice influences the overall system performance that consists in a multi-dimensional construct depending on the features of the different transportation modes (e.g. travel time, cost, emissions, line extensiveness) weighted with their rate of adoption (i.e. how many trips are run through each mode). Therefore, when evaluating how policy-makers’ actions affect the systems’ performance, we have to consider, on the one hand, the short-term effects they will produce (e.g. reduction in travel time, wider extensiveness, variation on travel cost). On the other hand, we should consider how these effects influence the citizens’ behaviour in terms of travel mode adoption in the long-run (i.e. switch from one mode to another).
Summarizing, increasing the performance of peripheral area transportation systems not only means improving people’s ability to move easier back and forth from the city centre (output), but, more importantly, it means to impact local attractiveness in both the short- and the long-term through travel demand and travel mode choice. These are influenced by the changes in transport supply (e.g. new infrastructure) on the basis of several factors (Kitamura 1990), both at the macroscopic level – continuing urbanization, evolving consumer technology and products, telecommunications systems, highway and transit improvements, and energy and air quality policies – and microscopic level – household conditions (e.g. income, composition), travel time and cost (Golob 1990, Wegener 2011).
To explore the complexity of the case described above, an analysis (p’hAp) was carried out thanks to the DPM approach. The SD model is based on the current structure of the transportation system between the RMN and the City of Buenos Aires (CABA). It allows us to simulate and test potential solutions (P) for transportation issues over a twenty-year period.
Data section
The formulation of the hypothesis (H), the estimation of variables and coefficients was made thanks to both a deep documents analysis1) and interviews with experts (the former Director of
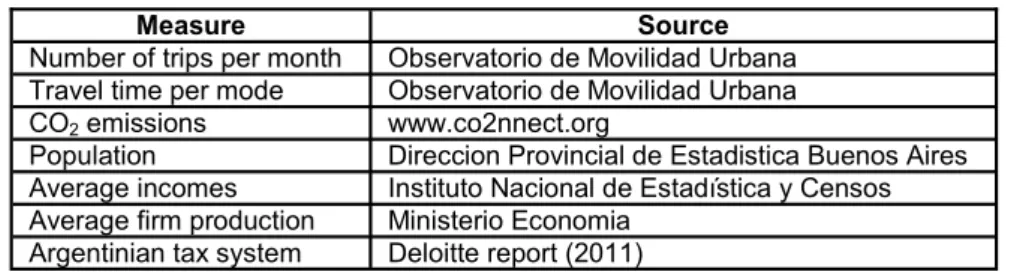
Infrastructure of the City of Buenos Aires, the former Director of the Ministry of Public Works of Argentina and an independent researcher). The data used to run the model and to develop figures 4, 5, 6, 7 come from the analysed documents (see footnote 1) and the official Argentinian statistics and other data. Table 1 summarizes the main data used.
Measure Source
Number of trips per month Observatorio de Movilidad Urbana Travel time per mode Observatorio de Movilidad Urbana
CO2 emissions www.co2nnect.org
Population Direccion Provincial de Estadistica Buenos Aires Average incomes Instituto Nacional de Estadística y Censos Average firm production Ministerio Economia
Argentinian tax system Deloitte report (2011)
Table 1 Data sources
1) These documents include: “Enmodo: Encuesta de movilidad domiciliaria, 2009-2010”; “Intrupuba: Investigaciòn de transporte urbano de Buenos Aires”; “Observatorio de Movilidad Urbana - Información disponible en línea, 2007”; “Comisión Nacional de Regulación del Transporte (CNRT). Red ferroviaria argentina, Informe estadístico 2010-2011”; “Academia Nacional de Ingeniería. Accesos a la Región Metropolitana de Buenos Aires. El transporte ferroviario y los subterraneos, 2011”.
The model
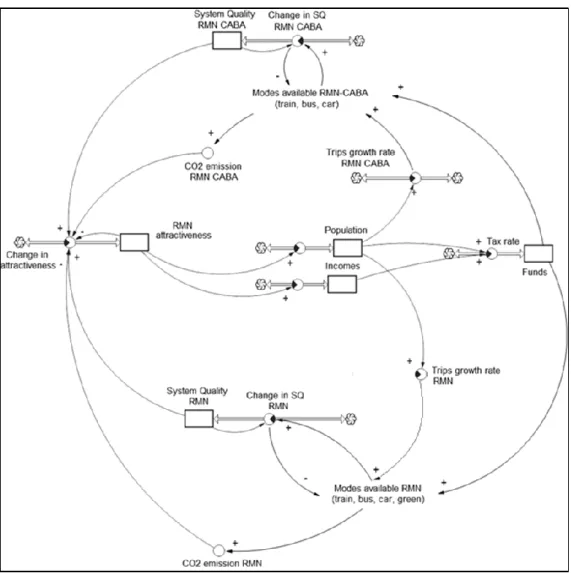
As stated in the introduction of this paper, urban transportation models encounter difficulties in being adopted by planners and decision makers due to (Saujot et al. 2016): their complexity (namely, scarce understanding about models’ functioning and potentiality); the high costs that make many authorities not able to afford it; the long time required to develop such models. The model here presented is an aggregate and easy-to-read model that comprehends 457 equations and parameters in total. The model structure is formed by two connected sub-models: one (RMN-CABA) focuses on the mobility between the northern region and the city centre; whereas the other (RMN), represents the mobility inside the northern region (Fig. 4).
These sub-models have a similar structure. In both cases, the match between the transport supply (the different travel modes available) and the travel demand determines the overall system quality as measured by a mix of economic, social and environmental aspects. According to the general model displayed in the third paragraph of the present work, the transportation system quality influences the RMN attractiveness which, in the long run, has an impact on both population (attracting new residents) and the economy (supporting firms’ development). The money coming from taxes payed by both people and firms may then be invested again into the transportation system to improve its quality. These investments may be in different combination of available policy options (e.g. railroad, bus line, toll, cycle line, monorail, underpass) which have a different impact on the overall performance, seen as a construct of the different dimensions previously identified (economic, social, environmental). Each performance dimension was measured thanks to a set of indicators built following a DPM approach. The main end-result (outcome) relevant to this case is the improvement of the urban area attractiveness. This, as argued by Wang et al. (2008), can be influenced by the performance of the transportation system. In other words, urban area attractiveness depends on some performance drivers (or indicators) that, in our analysis, has been defined as follow: • Economic: Cost of travel (average cost of travel/historical value); Travel time (average
travel time/historical value);
• Social: Extensiveness (no. of stops/historical value); Security (no. of accidents/historical value);
• Environmental: CO2 emissions (CO2 emissions/CO2 emissions if no investments
occur).
As previously stated, these indicators do not just depend on the policies input, but, in the long run, they are also influenced by the citizen behaviour.
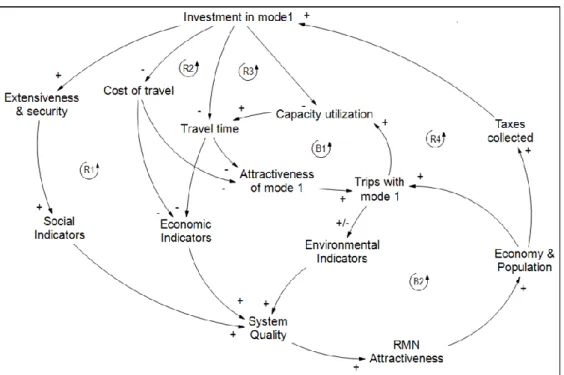
In Fig. 5, a partial version of the causal model structure was sketched. It is partial because it displays the system’s relationships related to an investment in a specific mode in one area (e.g. RMN-CABA viability). The full model comprehends all the potential investments modes, interacting to each other’s, in both subsystems. For graphical reasons, due to the fact that the structure portrayed in Fig. 4 is the same for each transportation mode, we decided to show just a partial version of the model.
As we may notice, the partial model structure is formed by four reinforcing loops (feedback loops leading to exponential behaviour) and two balancing loops (feedback loops leading to exponential decay behaviour). The reinforcing loops describe the dynamics by which an investment in a certain mode improves its performance (economic, social and environmental characteristics) and, therefore, the transportation system quality since it impacts on a share of the total trips of the area. An improved system quality influences the RMN attractiveness with a direct, indirect and induced effect on the economy and population. A growth in population and the economy can be translated in a bigger amount of taxes collected by the public administration that may be used to payback previous investments or undertaking new ones. The first balancing loop (B1) is related to the carrying capacity of the modes. Once a mode becomes more attractive due to a reduced travel time or cost, users will adopt it until its maximum capacity is reached. Then, that mode’s performance will start decreasing due to its excessive adoption and users will switch to other transportation modes until an equilibrium is reached.
The second balancing loop (B2) is related to the dynamics that a growth in population and the economy would generate an increase in travel demand with negative consequences on the environment and, therefore, on system quality and RMN attractiveness. The causal link connecting “trips with mode 1” and the environmental indicator do not have a defined polarity
because this depends by the environmental performance of the other transportation mode available (non-linear function). These two balancing loops represent the main “limits to growth” of the transportation system.
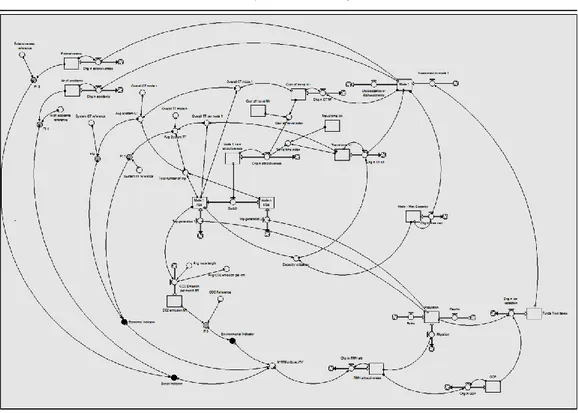
In Fig. 6, a stock and flow version of the causal loop diagram was provided so as to discuss the quantification of the main relationships and the hypothesis made to run the model. Even in this case, the model showed in Fig. 6 is a partial and simplified version of the one utilized to simulate the system’s behaviour and scenarios. The variables in grey portrayed in Fig. 3 represent the performance indicators previously described. These were built comparing the actual value with the historical one (e.g. the average travel time/initial average travel time). The variable in black groups these performance measures into synthetic economic, social and environmental indicators. The contribution of each performance dimension to the overall system quality was assumed to be equal for each group of indicators (economic, social and environmental). In order to estimate the effect of service quality on RMN attractiveness, system quality and RMN attractiveness were measured on the same scale. In our model, system quality has an impact equal to 1 to RMN attractiveness with a time delay of six months. The effect of territory attractiveness on population and economic growth was estimated thanks to a study conducted by Weisbrod et al. (2009). Tax system equations were taken from a Deloitte report (2011).
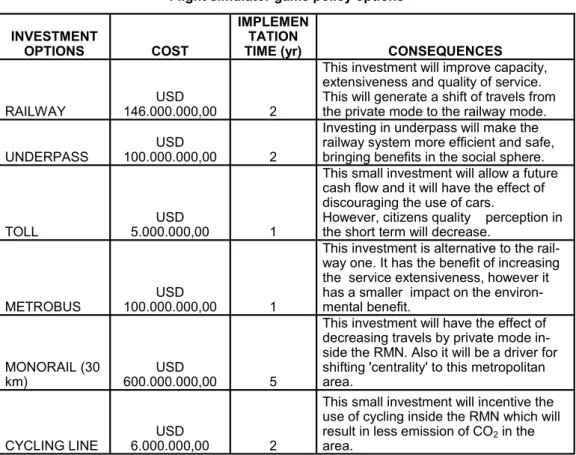
The potential investments were chosen looking at the set of policy options (P) that were on the table when this study was run (Table 2). Two options (investments in the existing rail infrastructure and tolling) directed to the viability between the two areas; two other options (investment in cycle line and a new monorail infrastructure) for the northern region; and two
other options (investment in buses and in underpass) impact both sub-systems. In Table 2, the investment options considered in this study are summarized2).
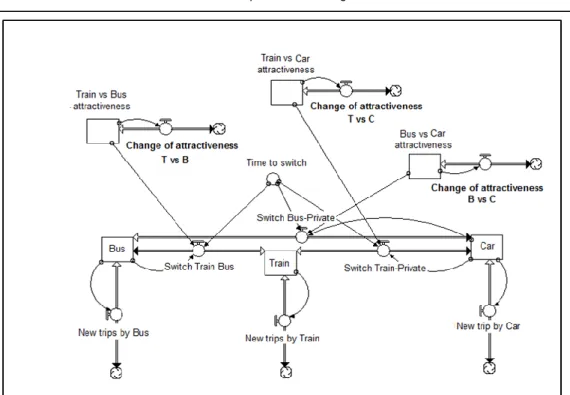
Each travel mode investment has the effect of impacting different service quality features. When these effects concern time and cost of travel, they will also impact on the travel mode choice. The latter depends on travel mode attractiveness which is a strategic resource that changes based on the flow “change in attractiveness”. Such a flow, that compare travel time and cost of the different modes available, is determined as the function showed in equation 1. In order to determine the overall travel mode choice (namely, how many trip/month per mode), equation 1 was used to compare each mode with all the other modes available. Fig. 7 shows in detail the model section related to the travel mode adoption in the RMN-CABA sub-model. Equation 1:
Fig. 6 – A stock and flow diagram
2) The investment options costs and impacts have been estimated by a project designed in 2012 by Bereco SA, an Argentinian Research & Development lab
The hypothesis made and the model structure just described rise validation issues. Literature about System Dynamics modelling connects the concept of validity with the one of usefulness (Meadows 1980, Barlas 1996). This means that, having performed a number of qualitative and quantitative validation tests (Barlas 1996), a model is valid as long as it results to be useful for a specific purpose. The model hereby presented can be considered useful in exploring and understanding how the analysed urban transportation system works and how to pursue its sustainability.
In order to ensure its validity some tests were performed. First of all, a direct structure test (direct comparison with knowledge about the real system structure) and a dimensional consistency (checking the unit of measures consistency) were put in place in order to verify if each relationship was coherent with the available knowledge about the real system (Barlas 1996). Second, when possible (e.g. population dynamics) a partial-model testing was performed taking into account the coherence with reference behaviours (Homer 2012). Third, an extreme condition test (Barlas 1996) was conducted on the maximum capacity variables for each mode to check whether the model-generated behaviours were coherent with the real dynamics.
Simulations
In order to better explore the system performance, the model was structured in the form of a flight simulator game of the type used by Sterman (2014). This kind of modelling increases the
INVESTMENT
OPTIONS COST
IMPLEMEN TATION
TIME (yr) CONSEQUENCES
RAILWAY 146.000.000,00USD 2
This investment will improve capacity, extensiveness and quality of service. This will generate a shift of travels from the private mode to the railway mode.
UNDERPASS 100.000.000,00USD 2
Investing in underpass will make the railway system more efficient and safe, bringing benefits in the social sphere.
TOLL 5.000.000,00USD 1
This small investment will allow a future cash flow and it will have the effect of discouraging the use of cars. However, citizens quality perception in the short term will decrease.
METROBUS 100.000.000,00USD 1
This investment is alternative to the rail-way one. It has the benefit of increasing the service extensiveness, however it has a smaller impact on the environ-mental benefit.
MONORAIL (30
km) 600.000.000,00USD 5
This investment will have the effect of decreasing travels by private mode in-side the RMN. Also it will be a driver for shifting 'centrality' to this metropolitan area.
CYCLING LINE 6.000.000,00USD 2
This small investment will incentive the use of cycling inside the RMN which will result in less emission of CO2 in the
area.
Table 2 Flight simulator game policy options
understanding of the environment because it allows policy-makers to experiment and explore different solutions. Simulations can compress or expand time and space, allowing learners, for example, to simulate decades in the life of a business or a century of climate change in a few minutes (Sterman 2014). When real experimentation is too slow, too costly, unethical or just plain impossible, that is, for most of the social issues we face nowadays, simulation becomes the main tool we can use in order to discover how complex systems work and where high leverage points may lie (Sterman 2014).
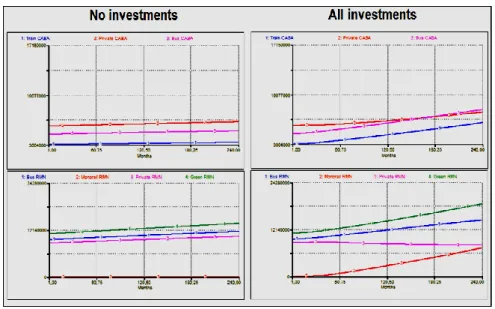
The graphs in Fig. 8 compare how travel mode adoption develops in the two sub-systems here considered when no policies are adopted (left column) and when all the possible investments are made (right column). The travel modes analysed are the most relevant to the two sub-systems. For what concerns the CABA-RMN sub-system these are: private mode (car), bus and train. For what concerns the RMN sub-system, these are: private mode (car), bus, no vehicles (here called “green”) and a non-existent infrastructure, the monorail. The time scale of the simulation is 20 years, and the investments are made once at the beginning of the period. The y axes of the above graphs measure the number of trips per month. The graphs on the left side show that, when no investments are made, the number of trips per month grows linearly (assuming a population growing linearly) and with the same rate for each of the travel modes. On the contrary, when all the investments here considered are made, we may observe that trips grow with different rates and shapes for each travel mode. Particularly, we notice that, even though the service quality improvement results into a population growing faster than the previous case (due to the influence of an improved urban area attractiveness), the overall impact of these measures are addressed at discouraging the use of private modes of transportation.
In order to evaluate how these actions may affect the performance of transportation systems, the graphs in Fig. 9 show the simulation results of the indicators related to the three selected sustainability dimensions.
Even though the simulations come from a conceptual model (a model that starts from real data
but presents limits concerning calibration), the result is that a change in the system structure in terms of new mobility solutions drives a user behaviour that determines the system’s performance in the long term. The performance drivers designed through the DPM approach allowed us to understand the real impact of policy-makers’ actions in a sustainability perspective.
For instance, if we would like to evaluate a single investment, we may examine which dimension/s it influences the most. As an example, Fig. 10 shows the impact in terms of performance of the investment in underpass of the railway line.
Thus, the investment does not improve the economic performance (see the two top charts). However, it has a strong impact for both the social dimension (security of the network) and the environmental one, since it makes the train more attractive (the train emissions per person are significantly lower than the ones produced by other modes).
Such a modelling approach could also be useful for financial planning. In fact, we may evaluate in how much time the investments made can be refunded through the collected tax. In Fig. 11, two investment examples are displayed. In the right graph, it is shown the investment in buses; in the left one, the investment in monorail. Line 2 represents the financial equilibrium, while line 1 represents the stock of funds initially deployed by the investments made and then fostered by the tax collected.
The graphs show that, in about 100 months (8 years), Public Administrations may payback their investment in buses. While in the case of a Monorail, they would need more than 20 years
Fig. 9 – Performance Driver behaviours in both scenarios
to payback its building. The rate at which financial resources are recovered depends on the territory attractiveness which, in this model, drives both population growth and incomes of local enterprises. Bigger population and incomes determine a greater amount of taxes collected. The limit of this analysis is related to the fact that not all the collected taxes are invested in the transportation sector – even though in Argentina around 70% of the public expenditure is devoted to transportation (Barbero et al. 2011).
The implications of such an analysis are of particular interest regarding the public sector borrowing. Knowing how many years are needed so as to payback an investment could help decision-makers in planning their finances. In the Monorail case, for instance, when making a loan to build the new infrastructure, it is important that this loan expires in no less than 30 years, otherwise there will be insolvency.
Conclusions
Solutions for improving urban mobility may be various. Their effectiveness depends on the structure of mobility systems and the willingness of people to adopt them. In order to plan actions directed at solving mobility issues in a sustainable perspective, we need to take into account the complexity of urban environments. From the 60’s, this challenge has been tackled through the use of always more sophisticated models. However, these resulted to be hard to understand for decision makers and planners who do not have a modelling background (Saujot et al. 2016). Also, the design and calibration of these models may be particularly time consuming and not suitable to support a rapid decision making activity.
What we suggest in this paper is the adoption of more aggregate and flexible models that can be easily and quickly applied to the planning processes. In this sense, the Dynamic Performance Management approach resulted to be useful when planning urban transportation for two main orders of reasons:
• It allows us to frame an urban transportation system in a simple and fast way without neglecting the systemic and performance oriented perspective needed to deal with wicked issues.
• It allows us to understand the main dynamics of the system taking advantage from simulation.
The result is the provision of a set of performance indicators that considers the whole system of relationships and the short- and long-term implications of the undertaken policies. This may help us to better monitor the system’s outcomes and to address the overall sustainability of the system by taking into consideration its multiple dimensions (economic, social and
environmental).
This study presents a number of limitations. First of all, at epistemological level, it must be recalled that “all models are wrong” (Sterman 2002). This means that, being a model a simplification of what is going on in the real world, we need to distinguish between the model and the reality it attempts to represent. As discussed in the model paragraph, the work presented here can be considered useful in exploring and understanding how complex urban transportation systems work and how to pursue a comprehensive sustainability within their domain.
Second, when dealing with transportation planning and traffic congestion it should be appropriate to take into account also a discrete time analysis since traffic congestion is not constant overtime but it is usually experienced in certain ‘rush hours’. System Dynamics however do not allow us to do that. A solution to this problem could be to merge SD with Agent-Based Modelling (Hesan 2016).
Third, when adopting DPM, the spatial dimension of the urban transportation system is not necessarily considered due to the high level of aggregation that this modelling approach proposes. A potential solution to overcome this limit may be to frame the urban area into different homogeneous areas (in terms of income, house holding characteristics, etc.), applying these models to each of those.
Fourth, a limitation that needs to be outlined is related to the model calibration that presents some shortages (e.g. the weight of the different sustainability dimensions on the overall territorial attractiveness). Therefore, the presented model could be considered somehow ‘conceptual’.
Nevertheless, this study presents important managerial implications. Particularly, modelling urban mobility through DPM could help planners and policy-makers to explore and evaluate both the short- and long-term effects of different mobility solutions and innovations. Also, DPM resulted to be useful in financial planning activities (e.g. ranking investment priorities, scheduling public sector borrowing).
References
ARMAH F. A., YAWSON D. O., PAPPOE A. A. N. M. (2010), A Systems Dynamics Approach to Explore Traffic Congestion and Air Pollution Link in the City of Accra, Ghana, Sustainability 2, 252-265.
AUSTRALIAN PUBLIC SERVICE COMMISSION (2007), Tackling Wicked Problems: A Public Policy Perspective, Commonwealth of Australia, Barton.
BARBERO J., CASTRO L., ABAD J., SZENKMAN P. (2011), Un transporte para la equidad y el crecimiento. Aportes para una estrategia nacional de movilidad y logística para la Argentina del Bicentenario, CIPPEC, Retrieved from: www.cippec.org.
BARLAS Y. (1996), Formal aspects of model validity and validation in system dynamics, System Dynamics Review 12 (3), 183-210.
BIANCHI C. (2010), Improving performance and fostering accountability in the public sector through system dynamics modelling: from an ‘external’ to an ‘internal’ perspective, Systems Research and Behavioral Science 27 (4), 361-384.
BIANCHI C. (2012), Enhancing Performance Management and Sustainable Organizational Growth Through System-Dynamics Modelling, in: Groesser S. N., Zeier R. (eds.), Systemic Management for Intelligent Organizations, Springer, Berlin, pp. 143-161.
COSENZ F., NOTO G. (2016), Applying System Dynamics Modelling to Strategic Management: A Literature Review, Systems Research and Behavioral Science 33 (6), 703-741.
DELLA PORTA A., GITTO A. (2013), Reforming Public Transport Management in Italy: the Continuous Search for Spending Better, in: Sargiacomo M. (ed.), Public Sector Management in Italy, McGraw-Hill, New York, pp. 155-180.
EUROPEAN PARLIAMENT (2011), Sustainable Urban Transport Plans. Urban transport sustainability: concept and current challenges, Report, Dictus Publishing, Brussels.
FORRESTER J. W. (1961), Industrial Dynamics, Cambridge, MIT Press.
GOLOB T. F. (1990), The dynamics of household travel time expenditures and car ownership decisions, Transportation Research Part A: General 24 (6), 443-463.
HAGHSHENAS H., VAZIRI M., GHOLAMIALAM A. (2015), Evaluation of sustainable policy in urban transportation using system dynamics and world cities data: A case study in Isfahan, Cities 45, 104-115.
HEAD B. W., ALFORD J. (2013), Wicked Problems: Implications for Public Policy and Management, Administration & Society 47 (6), 711-739.
HESAN R. (2016), Multi-methodology Modeling to Support Policy Analysis in Socio-technical Systems, PhD Thesis, University of Palermo, Italy.
HJORT P., BAGHERI A. (2006), Navigating towards sustainable development: A system dynamics approach, Futures 38 (1), 74-92.
HOMER J. B. (2012), Partial-model testing as a validation tool for system dynamics (1983), System Dynamics Review 28 (3), 281-294.
KITAMURA R. (1990), Panel Analysis in Transportation Planning: An Overview, Transportation Research Part A: General 24 (6), 401-415.
LAUTSO K., SPIEKERMANN K., WEGENER M., SHEPPARD I., STEADMAN P., MARTINO A., DOMINGO R., GAYDA S. (2004), PROPOLIS: Planning and Research of Policies for Land Use and Transport for Increasing Urban Sustainability, LT Consultants, Retrieved from: www.spiekermann-wegener.com.
LITMAN T. (2017), Autonomous vehicle implementation predictions: implications for transport planning, Victoria Transport Policy Institute, Retrieved from: www.vtpi.org.
MEADOWS D. M. (1980), The unavoidable a priori, in: Randers J. (ed.), Elements of the system dynamics method, Pegasus Communications, Waltham.
MEYER M. D., MILLER E. J. (2001), Urban Transportation Planning: a decision oriented approach, McGraw-Hill, New York.
MORECROFT J. (1999), Visualising and Rehearsing Strategy, Business Strategy Review 10 (3), 17-32.
MOXNES E. (2009), Diffusion of System Dynamics, System Dynamics Newsletter 22 (4), Retrieved from: www.systemdynamics.org.
NEELY A. (1999), The performance management revolution: why now and what next?, International Journal of Operations & Production Management 19 (2), 205-228.
NOTO G., BIANCHI C. (2015), Dealing with Multi-Level Governance and Wicked Problems in Urban Transportation Systems: the case of Palermo Municipality, Systems 3 (3), 62-80.
OTLEY D. (1999), Performance management: a framework for management control systems research, Management Accounting Research 10, 363-382.
PEÑALOSA E. (2005), Sustainable Transport: A Sourcebook for Policy-makers in Developing Cities. Module 1a: The Role of Transport in Urban Development Policy, GTZ, Retrieved from: www.collaboration.worldbank.org.
PFAFFENBICHLER P. (2008), MARS - Metropolitan Activity Relocation Simulator: A Systems Dynamics based Land Use and Transport Interaction Model, VDM, Saarbrucken.
PFAFFENBICHLER P., EMBERGER G., SHEPHERD S. (2010), A system dynamics approach to land use transport interaction modelling: the strategic model MARS and its application, System Dynamics Review 26 (3), 262-282.
RITTEL H. W. J., WEBBER M. M. (1973), Dilemmas in a general theory of planning, Policy Sciences 4 (2), 155-169.
SAUJOT M., DE LAPPARENT M., ARNAUD E., PRADOS E. (2016), Making Land Use – Transport models operational tools for planning: from a top-down to an end-user approach,
Transport Policy 49, 20-29.
SIMMONDS D. C. (1999), The design of the DELTA land-use modelling package, Environment and Planning B: Urban Analytics and City Science 26 (5), 665-684.
STERMAN J. (2014), Interactive web-based simulations for strategy and sustainability: The MIT Sloan LearningEdge management flight simulators, Part I, System Dynamics Review 30 (1-2), 89-121.
STERMAN J. D. (2000), Business Dynamics: Systems Thinking and Modeling for a Complex World, McGraw-Hill, London.
STERMAN J. D. (2002), All models are wrong: reflections on becoming a systems scientist, System Dynamics Review 18 (4), 501-531.
TE BRÖMMELSTROET M., BERTOLINI L. (2008), Developing land use and transport PSS: Meaningful information through a dialogue between modelers and planners, Transport Policy 15 (4), 251-259.
UNITED NATIONS (1987), Our Common Future, Oxford University Press, Oxford. VONK G., GEERTMAN S., SCHOT P. (2005), Bottlenecks blocking widespread usage of planning support systems, Environment and Planning A 37 (5), 909-924.
WADDELL P. (2002), UrbanSim: modeling urban development for land use, transportation, and environmental planning, Journal of the American Planning Association 68 (3), 297-314.
WADDELL P. (2011), Integrated land use and transportation planning and modelling: addressing challenges in research and practice, Transport Reviews 31 (2), 209-229.
WAITT G., HARADA T. (2012), Driving, cities and changing climates, Urban Studies 49 (15), 3307-3325.
WANG J., LU H., PENG H. (2008), System Dynamics Model of Urban Transportation System and its Application, Journal of Transportation Systems Engineering and Information Technology 8 (3), 83-89.
Warren, K. (2002), Competitive Strategy Dynamics, Chichester, Wiley.
WEGENER M. (1994), Operational urban models: state of the art, Journal of the American Planning Association 60 (1), 17-29.
WEGENER M. (2011), From macro to micro - how much micro is too much?, Transport Reviews 31 (2), 161-177.
WEISBROD G., CUTLER D., DUNCAN C. (2009), Economic impact of public transportation investment, American Public Transportation Association, Retrieved from: www.apta.com.
WORLD BANK (2002), Cities on the Move: A World Bank Urban Transport Strategy Review, The World Bank, Washington.
ZUIDGEEST M. H. P., VAN MAARSEVEEN M. F. A. M. (2000), Transportation planning for sustainable development, Conference Papers of South African Transport Conference, Retrieved from: doc.utwente.nl.
Initial submission: 12.10.2016 Revised submission: 31.05.2017 Final acceptance: 19.06.2017
Correspondence: Institute of Management, Sant’Anna School of Advanced Studies, 24 Piazza Martiri della Libertà, 56127, Pisa, Italy.