ContentslistsavailableatScienceDirect
The
Journal
of
Systems
and
Software
jo u r n al h om ep a g e :w w w . e l s e v i e r . c o m / l o c a t e / j s s
The
effects
of
scheduling,
workload
type
and
consolidation
scenarios
on
virtual
machine
performance
and
their
prediction
through
optimized
artificial
neural
networks
George
Kousiouris
a,∗,
Tommaso
Cucinotta
b,
Theodora
Varvarigou
aaDept.ofElectricalandComputerEngineering,NationalTechnicalUniversityofAthens,9,HeroonPolytechniouStr.,15773Athens,Greece
bReal-TimeSystemsLaboratory(ReTiS),ScuolaSuperioreSant’Anna,ViaMoruzzi,1,56100Pisa,Italy
a
r
t
i
c
l
e
i
n
f
o
Articlehistory:
Received25February2011
Receivedinrevisedform6April2011
Accepted6April2011
Available online 14 April 2011 Keywords:
Virtualization
Real-timescheduling
Cloudcomputing
Artificialneuralnetworks
Geneticalgorithms
Performanceprediction
a
b
s
t
r
a
c
t
Theaimofthispaperistostudyandpredicttheeffectofanumberofcriticalparametersonthe perfor-manceofvirtualmachines(VMs).Theseparametersincludeallocationpercentages,real-timescheduling decisionsandco-placementofVMswhenthesearedeployedconcurrentlyonthesamephysicalnode, asdictatedbytheserverconsolidationtrendandtherecentadvancesintheCloudcomputingsystems. DifferentcombinationsofVMworkloadtypesareinvestigatedinrelationtotheaforementionedfactors inordertofindtheoptimalallocationstrategies.Whatismore,differentlevelsofmemorysharingare applied,basedonthecouplingofVMstocoresonamulti-corearchitecture.Foralltheaforementioned cases,theeffectonthescoreofspecificbenchmarksrunninginsidetheVMsismeasured.Finally,ablack boxmethodbasedongeneticallyoptimizedartificialneuralnetworksisinsertedinorderto investi-gatethedegradationpredictionabilityapriorioftheexecutionandiscomparedtothelinearregression method.
© 2011 Elsevier Inc. All rights reserved.
1. Introduction
During the recent years, server consolidation through the use of virtualization techniques and tools such as VMware (http://www.vmware.com/), XEN (http:www.xen.org/), KVM (http://www.linux-kvm.org/)iswidelyusedindatacentersorin newcomputingparadigms suchasCloudcomputing (Armbrust etal.,2010).Throughthistechnique,applicationswithdifferent characteristicsandrequirementscanruninsidevirtualmachines (VMs)onthesamephysicalmulti-corehost,withincreasedlevels of security, fault tolerance, isolation, dynamicity in resource allocationandeaseofmanagement.
However,anumberofissuesarisefromthisadvancementin computing,likethedegradationoftheperformanceofthe applica-tions,duetotheusageofthevirtualizationlayer(Tikotekaretal., 2008).Exceptfortheextralayer,anumberofotherparametersmay alsoaffecttheperformanceindistributedandvirtualized environ-ments.ThesemaybethepercentageofCPUallocatedtotheVMand itseffectonexecutiontimeandtheschedulinggranularity(theway thispercentageisassigned)thatmayalsoaffectthelatter.What
∗ Correspondingauthor.Tel.:+306939354121.
E-mailaddresses:[email protected],[email protected](G.Kousiouris),
[email protected](T.Cucinotta),[email protected](T.Varvarigou).
ismore,consolidationdecisions,whethertheseimplythe assign-mentofVMstothesamecoreorneighbouringcoresonthesame physicalnode,mayhaveaneffectonapplicationperformance.In addition,differenttypesofapplicationsmayhavedifferent inter-ferenceeffectontheco-scheduledonesonthesamephysicalnode. Thismayhappenduetoapplicationinternalcharacteristics,like typeofcalculations,usageofspecificsub-circuitsoftheCPU,effect duetocachesharing,memoryaccesspatternsetc.
The degradation of performance in this case may lead to increasedneedforresources.However,thecurrentCloudbusiness SPImodel(Youseffetal.,2008)identifiesdiscreterolesbetween theentitythatoffersaplatform(PaaSprovider)andtheentitythat offerstheresourceswhichthisplatformmayuse(IaaSorCloud provider).Thismodel,inconjunctionwiththeaforementioned per-formanceoverhead,createsthefollowingproblem:
• APaaSproviderhasestimatedthatXnumberofresourcesare neededformeetingtheQoSfeaturesoftheapplicationinsidethe VM.Thisestimationwillprobablybemadeafterobservingthe applicationbehaviorwhenrunningasstandalone.
• TheIaaSproviderreceivesarequestinordertoreservethisX amountofresources.Inanattempttomaximizeprofit,theVMs oftheapplicationwillbeconsolidatedwithotherVMsthatare admittedintheinfrastructure.Thewaythisconsolidationis per-formedisunknowntothePaaSlayer.Thisdoesnotmeanthat
0164-1212/$–seefrontmatter © 2011 Elsevier Inc. All rights reserved.
theIaaSproviderwillgivelessresources.Thesameamountas requestedwillbeallocated.
• Theperformancedegradationduetotheaforementioned consol-idationandaccordinginterferencewillbetranslatedtodecreased QualityofService(QoS)levelsfortheapplication.
• ThebreachofconfidencebetweenthePaaSandIaaSprovideris inevitable.Theformerwillconsiderthatthelatterhasdeceived him/her,andthattheallocationofresourceswaslessthanagreed. Thelatterwillconsiderthattheformermadeapoorestimation andistryingtotransfertheresponsibilitytotheinfrastructure layer.
Therefore,itisimperativeforanIaaSprovidertobeableto pre-dictaccuratelytheoverheadthatisproducedbytheconsolidation strategyandthereforeincreaseapriorithenumberofresources allocatedtoanapplicationaccordingly.Thiswillnotonlyleadto improvedreputationbutwillenabletheIaaSprovidertooptimize theassignmentofVMstohostsorevencoresofonehost, depend-ingonthetypeofworkloadtheseVMsproduceandtheestimated interferenceofonetypeofworkloadovertheother.Byknowing whichcombinationsresultinlessoverhead,over-provisioningwith regardtostandaloneexecutioncanbeminimized.
Theaimofthis paperis totakeunderconsideration a wide rangeofparametersthataffectapplicationperformancewhen run-ningonconsolidatedvirtualizedinfrastructuresandquantifythis overhead.Therefore,IaaSprovidersmayperformintelligent deci-sionsregardingtheplacementofVMsonphysicalnodes.Thiswill mitigatetheaforementionedproblemandwillaidtheIaaSlayer tominimizetheneedforover-provisioning.Asindicative applica-tionsweconsiderthe6standardMatlabbenchmarktests,dueto thefactthattheyrepresentawideareaofcomputational work-load,frommathematicalcalculationstographicsprocessing,and areeasilyreusablebyotherresearchers.Thefollowingaspectsare investigated:
• Scheduling decisions for EDF-based (Earliest Deadline First) scheduling(budgetQoverperiodP),bothintermsofCPUshare assigned(Q/P)andgranularityofthisassignment(P).Thistype ofscheduling(LiuandLayland,1973),whichisverypopularin thereal-timeworld,isusedinordertoguaranteethatthe assign-mentsofCPUpercentagestotheVMswillbefollowedandto ensuretemporalisolation.
• Differentcombinationsofbenchmarktests,inordertodiscover theonesthatshowlessinterference(andthereforeoverhead), whenrunningconcurrentlyonthesamenode.
• Differentplacementdecisionsandhowtheseaffecttheoverhead (placementonthesamecore,inadjacentornon-adjacentcores inonephysicalnode,comparedwithstandaloneexecution).As adjacentcoresweconsidertheonesthatshareaL2cache mem-ory.
• Abilitytopredictinadvancetheseeffectsinordertoproactively provisiontheresourcesneededbyanapplicationandbeableto choosethesuitableconfigurationthatcreatestheleastoverhead. Forachievingthis,artificialneuralnetworks(ANNs)areused,that areautomaticallydesignedandoptimizedthroughaninnovative evolutionary(GA-based)approach.Thetopologyofthenetworks isdynamic interms ofnumber ofhidden layers,neuronsper layerandtransferfunctionsperlayerandisdecidedthroughthe optimizationprocessoftheGA.
Theremainingofthepaperisstructuredasfollows.InSection 2,similarapproachesintherelatedfieldarepresented,whilein Section3anextendedanalysisismadeonthechosenparameters forinvestigation.Section4containsthedescriptionofthetest-bed andthemeasuringprocess,whileSection5presentsthe analyt-icalresultsfromtheexperiments.Section6detailstheapproach
inordertopredictinadvancetheeffectandcomparesittothe multi-variatelinearregressionmethod,whileSection7provides theoverallconclusionsfromthisstudyandintentionsforthefuture.
2. Relatedwork
Inthepast,wehaveinvestigatedpartlyanumberofthe param-etersthatareconsideredhere.Inourpreviousworks(Cucinotta etal.,2010a;Kousiourisetal.,2010),themainfocuswasgivenon theeffectofschedulingparametersand%ofcpuassignmentson theQoSofferedbyspecificapplications(mainlyinteractiveones).
Given that virtualization technologies have become very popular during the recent years, a large number of interest-ing research efforts exist. In (Padala et al., 2007), the authors investigate the overhead that is inserted through the use of differentvirtualizationtools, withtheintentiontodiscoverthe mostefficient one. In (Makhija et al., 2006), the main focus is the scalability of virtual machines with mixed workloads and theeffectontheirperformancewhen consolidated.The bench-marks are based on server applications. With the extended use of Cloud technologies, applications that are envisioned to be part of their workload may have more complicated work-loads rather than traditional data center ones. Such examples may be the case of the Digital Film Post-production applica-tion (http://www.irmosproject.eu/Postproduction.aspx) of the IRMOS project or the availability of mathematical program-mingand optimizationtoolslikeGAMSinCloudinfrastructures (http://support.gams-software.com/doku.php?id=platform:aws). Furthermore,notemporalisolationbetweenthevirtualmachines isused.
Averyinterestingapproach,similartoourwork,isKohetal. (2007).Inthiscase,theauthorsstudytheperformanceinterference ofcombinationsofelementaryapplicationswhenrunninginside co-allocatedVMs.Interestingscoremethodologyispresentedthat canalsobeusedforclassifyingapplications.Theworkload char-acteristicsofeachapplicationaregatheredinordertobeusedas acomparisoninthefutureforidentifyingunknownapplications thataregoingtobeinsertedintheinfrastructureandaspredictors inalinearregressionmodel.Themaindifferencesofourapproach lieonthefactthatweinvestigatealimitednumberofspecificand genericbenchmarktests,withtheuseofrealtimeschedulingand adifferentpredictionmethodbasedonANNs.Especiallytheuseof RTschedulingensuresthetemporalisolationofVMswhen run-ningconcurrentlyonthesameCPU andthefairdivision ofthe resourcepercentagesthateachVMutilizes.Inaddition,we inves-tigatedifferenthardwaresetupinterferences,suchasrunningVMs onthesamecoreorinadjacentcoresinmulti-corearchitectures anddifferentsetupsintermsofgranularityandpercentageforeach elementaryapplication.
InSororetal.(2008),averypromisingapproachfordynamically handlingtheresourcesonwhichconcurrentVMsareexecutedis portrayed,inordertooptimizesystemutilizationandapplication responsetimes.Thisisbasedonbothofflinerecommendationsand onlinecorrections.Howeverthisworkiscenteredarounddatabase applications.InMoller(2007),adesignandvalidation methodol-ogyofbenchmarksforvirtualmachinesispresented,wherealso theconcurrencyeffectsareinvestigated.In Tickooetal.(2010), anumberofconfigurationsistakenunderinvestigation,like run-ningonthesameoradjacentcores,throughhyper-threadingornot. Experimentsarefocusedon3testsandwithouttakingunder con-siderationschedulingparameters.Predictionmethodsarebasedon analyticalformulas.
InJinetal.(2008),VSCBenchmarkisdescribed,ananalysisof thedynamic performanceofVMswhennewVMs aredeployed. Theauthorsinvestigatethebehavioroftheco-scheduledVMsfor
bothlaunchingandmaintainingmultipleinstancesonthesame server.BoottimeforaVMisaveryresourceconsumingtask,that mayleadotherco-scheduledtaskstoresourcestarvation.Inour work,thisisavoidedthroughtheuseoftherealtimescheduling thatlimitstheresourcesassignedtoatask(likeaVM)toa prede-finedpercentage.Thustemporalisolationisachievedbetweenthe concurrentlyrunningtasks.
InWengetal.(2009),aninterestingapproachforscheduling VMsispresented,withtwomodesofoperation(high-throughput andconcurrent)whichaimsatefficientlyhandlingCPUtimefor thephaseswheretheVMshavemultiplethreadsrunning concur-rently.Thisapproachismorefocusedontheschedulingaspectsand doesnottakeintoconsiderationconcurrentVMsrunningonthe sameserver.TheVirtualGEMSsimulatorfortestingdifferent con-figurationswithregardtoL2setupbetweendifferentconcurrently runningVMsappearsinGarcía-Guirodoetal.(2009).
A benchmarking suite specifically for VM performance is depictedinEl-RefaeyandRizkae(2010).Whileitpinpointssome importantfeaturesforbenchmarkingofvirtualizedapplications,it mainlyfocusesononetypeofworkload(linuxkernelcompilation). Asurveyofvirtualizationtechnologiesinadditiontoperformance resultsfordifferentconfigurationsappearsinWhiteandPilbeam (2010).InCucinottaetal.(2009,2010b),aninvestigationis car-riedoutonthepossibilitytoenhancethetemporalisolationamong virtualmachinesconcurrentlyrunningonthesamecore,byusing theIRMOSreal-timescheduler,focusingoncompute-intensiveand network-intensiveworkloads.
InKhalidetal.(2009)averyinterestingapproachforadaptive real-timemanagement of VMsin HighPerformance Computing (HPC)workloadsispresented.Thismechanismisusedduringthe operationoftheHPCinfrastructure,inwhichtheVMshavea prede-finedrunningperiodwhichisdecidedbytheinfrastructuresharing policy.Themaingoalistocalculateinrealtimeifthejobthatis includedintheVMisgoingtobefinishedintimeornot.Theones thatwillnotanywayfinishintimeareprematurelykilledinorderto improvethesuccessrateoftheoverallinfrastructure.Inourview, thisworkcanbeusedincombinationwiththeonepresentedinthis paper.Themodelsthataredescribedherecanbeusedforobserving andminimizingtheoverheadofaspecificallocationoverthe differ-entnodes,whiletheworkpresentedinKhalidetal.(2009)canbe usedfortheruntimeoptimizationofthevirtualizedinfrastructure. GA-basedoptimizationofANNshasbeenusedinthepastina numberofsignificantworks.Forexample,inLeungetal.(2003),a numberoftheparametersofthenetwork(likeconnectionweights) arechosenthroughGAs.Themaindisadvantageofthisapproach liesonthefactthatastaticstructureforthenetworkisrequired.In othercases(likeinIlonenetal.(2003))theyareusedforindirect optimization,throughforexampleoptimizingthetrainingprocess. InFiszelewetal.(2007),anotherapproachcombiningGAsandANN architectureispresented,howeverthestructureofthenetworkis limitedtotwohiddenlayersandstatictransferfunctions,while experimentingwithadifferentsetofparameterssuchasnumber ofnodesandtheirconnections.ThesameappliesforGiustolisiand Simeone(2006).Inourapproach,thenetworksmayhaveadynamic topology,intermsofnumberofhiddenlayers,numberofneurons perlayerandtransferfunctionsperlayer.Otherparameterssuch asdifferenttrainingmethodscanbeaddedatwill.
3. Investigatedparameters
Inageneralpurposeoperatingsystem,whentwotasksstartto execute,theycompetewitheach otherfor theunderlying com-putationalresources.Theamountofthelatterthatisassignedto each taskmaybedividedaccording tothetemporal needsand demandsofthem.However,thisresultsinaninabilitytopredict
theQoSofferedbyanapplicationrunninginsideaVM,inshared infrastructures.The percentage ofCPU allocatedtoit mayvary significantlydependingontheco-locatedtasksdemand(likethe bootingofanotherVMinTickooetal.(2010)).Onesolutionto mit-igatethiseffectisderivedfromtherealtimeworld.Throughthe useofEDF-basedscheduling,thepercentageassignedtoataskmay beguaranteed.Ingeneral,forthistypeofscheduling,therearetwo significantparameters,thebudgetQandtheperiodP.Qisthe com-putationaltimeonthephysicalnodethatisassignedtoataskover aperiodP.Thus,theratioofQ/Pistheresultingpercentageonthe machine.However,foragivenpercentage,differentgranularities mayexist,dependingonP(forexample,50%maymean50msevery 100msoritmaymean250over500ms).Oneinterestingquestion ishowtheseparametersaffectapplicationperformance.
As investigated in Cucinotta et al. (2010a), Kousiouriset al. (2010),theeffectofreal-timeschedulingparametersmayaffectthe applicationperformanceinavarietyofways.Forexample,inour aforementionedworks, that investigateinteractiveapplications, differentgranularitiesofthesame CPUpercentage assignments lead toincreasedstandard deviationvalues forserverresponse times.Theconclusionfromthatanalysiswasthatforinteractive applications,lowgranularity(smallschedulingperiodP)leadsto morestableperformanceforthesamepercentageofCPUassigned. In this work,we focus on6computationally intensive applica-tions.Theeffectofschedulingdecisions(forbothpercentageofCPU allocatedandgranularityofthisallocation)ontheirperformance metricsisobservedalongwiththeinterferenceoftheco-allocation ofVMsforthesameCPU%assigned.
AsidentifiedinIRMOSprojectD5.1.1 (2009),themetricthat iscurrentlyusedbyinfrastructureprovidersinordertodescribe hardwarecapabilitiesismainlyCPUfrequency.Howeverthis met-ricisfarfromsufficient,giventhatitdoesnotreflectthephysical node’s ability to solve problems (does not take under consid-eration other factors such as bus speed, memory speed, etc.). Otherapproaches suchastheBerkeleydwarfs(http://view.eecs. berkeley.edu/wiki/Dwarfs)or Matlabbenchmarktests aremore abletocaptureanode’scomputationalcapability.In thispaper the second approach was chosen. The Matlab benchmarks (http://www.mathworks.com/help/techdoc/ref/bench.html) con-sistof6tests,thatmeasurethephysicalnode’s(andMatlab’sfor thismatter)abilitytosolveproblemswithdifferentcomputational requirements.Thereforethesetestsareusedforbothdetermining thehardwarecomputationalcapability(testscore)andthe charac-terizationofthetypesofworkloads(testnumber).
Whatismore,theyrepresentawideareaoftypesofworkloads (Table1)withalimitednumberoftestsanditisthereasonthe spe-cificapproachwaschosen.Forthese,weinvestigatetheeffectofthe CPUallocationandtheeffectoftheircombinationinconcurrently runningVMs.Itisexpectedthatdifferentcombinationswillhave differenteffect,duetothenatureofthecomputations.The degra-dationoftheperformanceisreflectedonthetestscore.Lowertest scoresindicatebetterperformance.Ingeneral,thetestscoreisthe timeneededtomakethenecessarycalculationsforeachtest.
Furthermore,differentallocationscenariosareinvestigatedfor multi-corearchitectures.TheVMsarepinnedwithavarietyofways
Table1
Details regarding the Matlab benchmark tests and the specific
computa-tional patterns thattheyrepresent (http://www.mathworks.com/help/techdoc/
ref/bench.html).
Test1 Floatingpointoperationswithregularmemoryaccesses Test2 Floatingpointoperationswithirregularmemoryaccesses
Test3 Datastructures
Test4 Floatingpointandmixedintegeroperations
Test5 2-Dgraphics
oncoresofthesamephysicalnodeinordertoexaminethe
interfer-enceeffectperscenarioontheirperformance.Thisisexpectedtobe
reducedduetothetemporalisolationwhensharingthesamecore
(withtheexceptionofcacheinfluence).Howeveritisinterestingto
seewhathappenswhentheVMsthatcontaintheindividualtests
arescheduledondifferentcoresonthesamephysicalnode,thus
runninginrealparallelismandcontendingforthesamesub-circuits
liketheRAMbus.
So,overallwhatisinvestigatedis:
• differentcore%assignmentsforasingleVMrunningan
elemen-tarytest,
• differentgranularityofallocationassignmentsfora singleVM
runningatest,
• mutualinterferenceeffectofcombination oftestsfor
concur-rentlyrunningVMsonthesamecore(sharedL1andL2cache
memories)andforavarietyofschedulingperiods,
• mutualinterferenceeffectofcombination oftestsfor
concur-rentlyrunningVMsonadjacentcores(withsharedL2cache)on
thesamephysicalnodeandforavarietyofschedulingperiods,
• mutualinterferenceeffectofcombination oftestsfor
concur-rentlyrunning VMs onnon-adjacentcores (non-shared L1/L2
cache)onthesamephysicalnodeandforavarietyofscheduling
periods,
• ping times for differentping periods,%core assignments and
schedulingperiodsofVMsinordertoinvestigatetheeffecton
networkresponsiveness.
4. Testbed
For the real time scheduler, the one that is presented in
(Checconietal.,2009)waschosen.Thehostoftheexperimentswas aquadcore(2.4GHz)CPU,with8GBofRAMand8MBofL2cache (dividedintwo4MBpartspercorecouple).Powermanagement wasswitchedoffinordernottodynamicallychangetheprocessor speedforpowerefficientoperation.ThehostOSisUbuntuLinux 10.10,theVMOSisWindows7(withCygwinandOpenSSH)and thehypervisorisKVM.TheMatlabexecutablecontainingthetests tookasargumentsthedurationoftheexperiment,thenumberof testtorun,anexecutionIDandtheschedulingparameters(Q,P) fordocumentationpurposes.ItwascompiledinMatlabR2007b. In order to be able to run individual tests and not the entire suite,thevariationofthebenchmarkfunctionthatisprovidedin
(http://www.mathworks.com/matlabcentral/fileexchange/11984) was used. This was combined with suitable logic in order to performthetestsforaspecificperiodoftimeandnotforaspecific number of runs. The reason for this is that each one of the 6 elementary tests hasa different execution time, which is also affectedbytheresourcesallocatedtoit.Sothesynchronizationof themcannotbebasedonnumberofruns.Furthermore,inorder toruneachtestforanincreasednumberoftimes,thisduration wassignificantlylargersothatalargesamplecouldbecollected (intherangeofhundredsoftestrunsperconfiguration).Fromthis sample,themeanvalueoftheexecutiontimeswasextractedfor eachcase.
TheexperimentswerecoordinatedbyaJavamodule (Coordina-tor)thatwaspinnedononecore(CPU0).Thiscodeimplemented theinterfacetowardstherealtimescheduler,inordertochange theQ,PschedulingparametersontheprocessesoftheVMs.The VMswerepinnedtoeitheronecore(CPU2)oreachoneon dif-ferentcores(CPU1,2or3),dependingontheexperiment.After thesetupofthescheduler,theCoordinatorwasusedinorderto connectintotheVMsthroughSSHandlaunchdifferent combina-tionsoftheMatlabexecutablesforaspecificperiodoftime.The timewasmeasuredfrominsideMatlab,andeachexecutionwitha givenconfigurationwasperformeduntilacertaintimeperiodhad passed(500s).Thisleadstoasmallviolationofthetimeperiod, butitwasmuchsmallerthantheoverallduration.Itiscriticalto mentionthatifthefunctionsusedtomeasuretimearebasedonthe clockfunctionofMatlab,thisisfarfromaccurate.Itwasobserved thatwithhighutilizationinsidetheVM,thesetimingmechanisms lostcompletelytrackoftime (indicatively,whilethesimulation wasrunningfor2h,insidetheVMonly5measuredminuteshad passed).Thisiswhythetic-tocmeasuringfunctionofMatlabwas used.
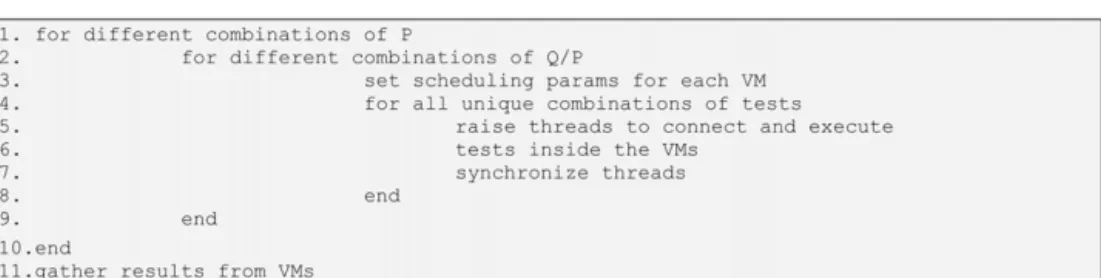
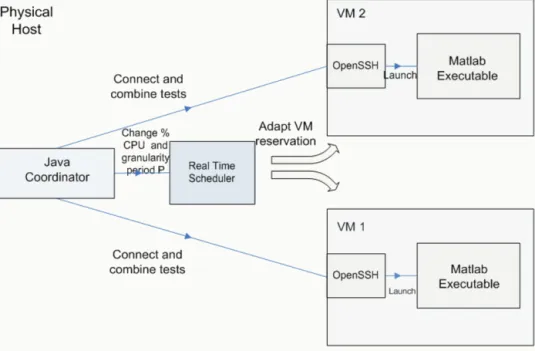
Thepseudo-codefortheCoordinatorappearsinFig.1andfor theexecutableinsidetheVMinFig.2.Theoverall implementa-tiondesignandtheinteractionsbetweenthenecessarysoftware componentsappearinFig.3.Indetail,thedifferentstepsneeded are:
• Launching of the Java Coordinator. This component has the responsibility ofkeeping track of theexecution loops forthe variousparametersoftheexperimentslikeschedulingperiods, CPUpercentagesassignedandtestcombinations.Furthermore, itraisesthethreadsthatcontacttheschedulerinterface(Python script)forsettinguptheCPUallocationsforeachVM.
Fig.1.Pseudo-codeforJavaCoordinatorsequenceofactions.
Fig.3.Softwarecomponentsneededfortheimplementationandtheirinteraction:themaincomponentistheJavaCoordinatorwhichkeepstrackofexecutionloopsin
ordertocovertheinvestigatedinterval,setsuptheschedulingparametersoftheVMsandconnectstotheguestOSinordertolaunchthespecifictestcombinationdictated
bythecurrentexecution.
• The next step is to raise different threads in order to con-necttotheVMs and launchtheMatlab executableswiththe specificarguments(testcombinations).Thesethreadsare syn-chronized in the end of their execution, in order to ensure theconcurrencyofthenextcombination execution.It is crit-icalto mentionthat in orderto ensurea stable execution of thethreadsfor anunlimitedperiod oftime, the implementa-tionsuggestedin( http://www.javaworld.com/javaworld/jw-12-2000/jw-1229-traps.html?page=4)was followed. This guaran-teesthattheoutputanderrorstreamsarecapturedefficiently, inordertoavoidcomputerhangs.
• WhenbothexecutionsinsidetheVMsarecompleted,theJava Coordinatorprogresseswiththenextconfigurationdictatedby theloop.
Threadsynchronizationwasperformedinordertoensurethat theVMsareexecutedconcurrently.TheresultsofeachVMwere keptinalogfilelocallyattheVM.Attheendtheyweremergedin ordertoobtaintheoveralllogs.Detailsregardingthetestbedare documentedinTable2.
Thedurationofeachrun(aspecifictestcombinationwitha spe-cifichardwareconfiguration)wassetto500s.Thiswassufficient timetoensurethatthethreadswouldbeconcurrentlyexecuted forthemajorityofthetime,withouthavingrandomssh connec-tiondelaysinfluencethisprocess.Thesshconnectiondelaysranged from2.8to3.8s.Thisiswhythreadsynchronizationwasperformed intheendofthe500-sinterval.Thethreadthatfinishedfirstwaited forthesecondonetocomplete.Itwasalsoenoughinordertoletthe testsrunforanincreasednumberofruns(intherangeofhundreds), thusleadingtosufficientsamplegathering.
Table2
Test-beddetailsregardinghardwareandsoftware.
HostOS LinuxUbuntu10.10 GuestOS Windows7 Hypervisor KVM
BenchmarksMatlabR2007bexecutable
PhysicalhostIntelCore2DuoQ6600(Quadcore2.4GHz,8MBcache,8GBRAM)
Furthermore,anexecution IDwaspassedinside theVMs,in
ordertobeincludedin thereportedresults. Thiswasaunique
numberforeachexaminedcombination.Thisisnecessarydueto
thefactthatit wasobserved thatfora numberofrandom
rea-sons(likebrokentcppipes,etc.)alimitednumberofcombinations
didnotsucceedinstartingorfinishing.ForthesecasestheIDdid
notgetlogged.Thiswaytheresultsfromtheseparatefilesthat
arekeptinsideeachVMandconsolidatedintheendcouldbe
fil-teredinordertoruleouttheaforementionedcasesandrepeatthe
experimentforthem.
5. Measurements
Inthefollowingparagraphsthedifferentdeploymentscenarios
aredescribed,alongwiththeresultingmeasurements.Forallcases,
theschedulergranularitywasinvestigatedfrom200to800ms.A
warm-upperiodforthesystemwasintroduced,assuggestedbythe
literature,inorderfortheVMstobehaveinamorestablefashion.
Thatiswhytheexperimentsbeganfrom150ms,buttheresults
werediscardedforthatspecificvalue.Eachdatapointinthegraphs
showninthenextsectionsisthemeanvalueoftheindividualtest
runsinsidea500-sinterval.Ingeneraltheseindividualtestruns
wereintherangeofhundredsoftimes.
5.1. SingleVMonacore
Inthisscenariothemaximumpercentageassignedtoeachtest
is80%.Thisisduetothefactthattheremainingpartisleftforhost
systemtaskstoutilize.Inthisconfiguration,eachVMisexecuted
asstandaloneononecore.NootherVMisrunning.Thiswas
per-formedinordertoseetheeffectofthegranularityofthescheduling
parametersandthepercentage allocation,inadditionto
acquir-ingthebaselinescoresofun-interferedexecution(standalone)for
comparisonwiththeVMconsolidationscenarios.Asscheduling
parametersareconsideredtheCPUshareXassignedtoataskin
aperiodP.Ineveryperiod,thetaskisgivenX*PmsofCPUtime.For
exampleifwehaveaschedulingperiodof500msandaCPUshare
of40%,thismeansthatthetaskwillbegiven200msofCPUtime
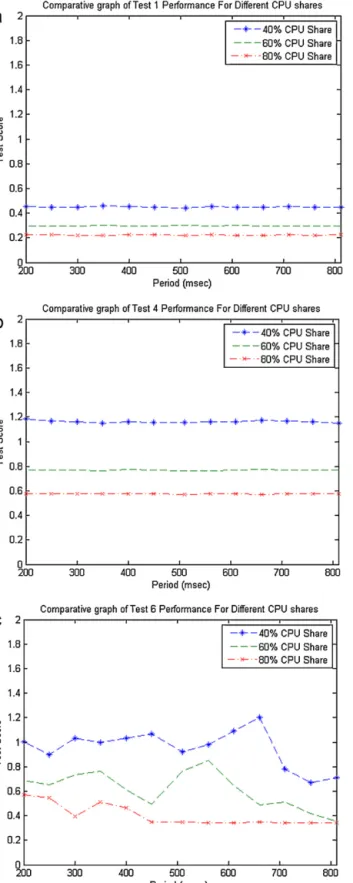
Fig.4. TestscoresfordifferentCPUpercentagesandgranularity(schedulingperiod) whenthetestsarerunningwithoutanyinterference(co-scheduledtests).Thetest score(verticalaxis)indicatesthetimeneededforexecutingonetestrunandhas beencalculatedfromthemeanvalueofhundredsoftestrunsinsidea500-s execu-tionrun.Theschedulingperiod(horizontalaxis)isthetimeintervalinwhichthe allocationofX%CPUshareisguaranteed.(a)Standalonetest1;(b)Standalonetest 4;(c)Standalonetest6.
In Fig.4thescoresfor each test areportrayed, fordifferent CPUsharesandperiodsofassignmentofthem.Lowertestscores indicatebetterperformance.Inessence,thetestscoreisthetime neededforcompletingonetestrun.Onlyanindicativenumberis portrayedhere,remaininggraphsareincludedinAppendixA(Fig. A.1).
Fortests1–4,theconclusionisthatthebehavioris indepen-dentofthegranularityofscheduling.Thisisanticipatedsinceina standalonebasis,theeffectofinterferenceincachememoriesfrom taskswitchingisnon-existent.Withrelationtotheimprovement ofperformancewhentheCPUshareincreases,thisisalmostlinear, asseenfromtheinverselyproportionaltestscores.
Fortests5–6(graphicstests),thebehaviorismoreoscillatory, whichcanbeattributedtothedifficultyofthevirtualizationlayer toaccessoremulatethegraphicscard.
5.2. ConcurrentVMscollocatedonthesamecore
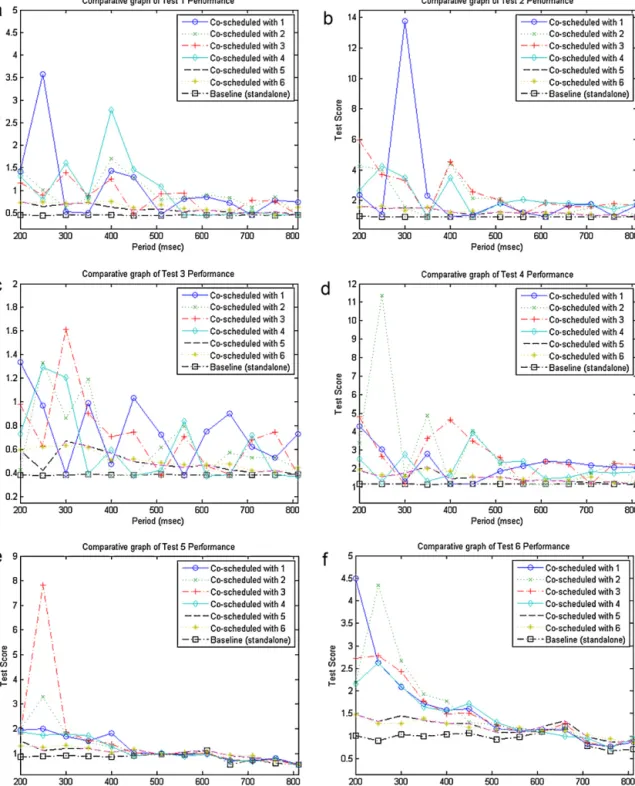
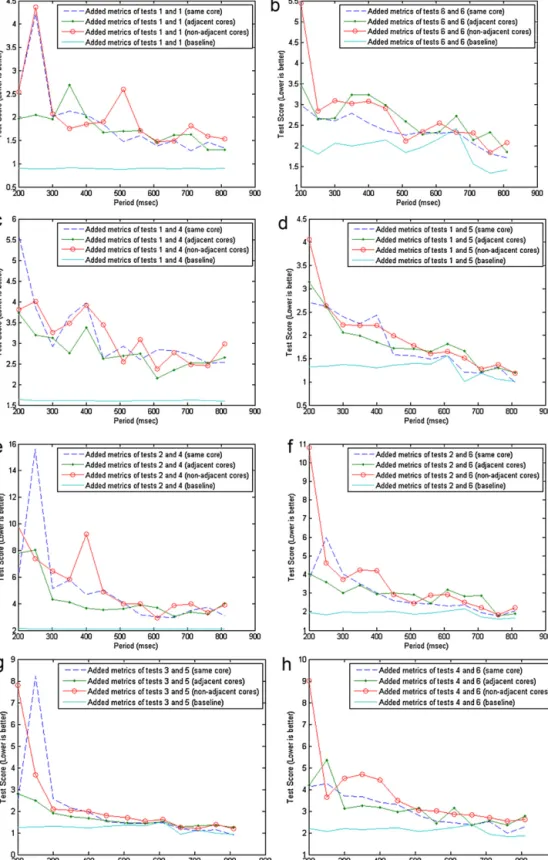
Thesecondexperimentaimsatexaminingtheeffectof concur-rencyontheperformanceofVMsthatarerunningonthesame core,thususingsharedL1andL2cachememories.Forthisreason, eachVMisallocated40%ofthecorecapacity.Theperformance scoresarecomparedtothe40%scoresofexperimentA.Resultsare showninFig.5.Theseillustratethescoresofeachindividualtest, whenrunningonthesamecorewitheachoftheothertests.That iswhythe(i,j)figuredoesnotcoincidewiththe(j,i)figure.Lower testscoresmeanbetterperformance.
Itisevidentfromtheabovegraphsthatwhilethescheduling periodPoftheassignmentsincreases,theperformanceoverhead oftheco-scheduledtestsimproves.Thisisowedmainlytothefact thatwithlargerperiods(andthesame%ofCPU)theapplications havemoretimetoutilizecomponentssuchasthecachememories. AlowerperiodresultsinmorefrequenttaskswitchingontheCPU andthus highercache interferenceand contaminationbetween theconcurrenttasks.Furthermore,theoverheadfromthecontext switching(scheduleroverhead)isincreased.
Anotherconclusionwasthatinsomepartsthegraphsseemedto portraysomeanomalieslikeinthetest3graph(Fig.5c).However, aftercarefullyobservingtheresults,itseemedthatwhenthehigh valuesofonetestoccurred,therewerelowvaluesfortheothertest. Thisledustoplotthecombinedperformance(addedbenchmark scores)ofbothco-scheduledVMs,whichshowedamorelogical system-levelgraph.Itseemsthatwhatmattersinthiscaseiswhich taskstartsfirst.Inthetest-beddescriptioninSection4itwasstated thattheexecutionthreadsaresynchronizedintheendofthetesting period,becausethiscannothappeninthebeginning.Thethreads arelaunchedsimultaneously,butduetoanumberofrandom rea-sons(likesshdelayforexample),theexecutionofeachtestinthe respectiveVMsdoesnotstartatexactlythesametime.Thisdelay wasintherangeof3s,howeveritwasmuchlowerthantheselected 500sdurationofeachcombination.Fromthesystemlevelgraphs moreaccurateconclusionscanbededucted.Thesearecombined withtheotherscenariosandaredepictedinFig.6.
Furthermore,thereseemtobeextremelyhighvaluesforthe 250msperiodP.Thishappensforalmostallgraphsandis con-tradictory tothe general trend of the graphs. By taking under considerationthewaytheforloopsareconstructedinFig.1,we canconcludethatthishappensduetosomeinternalinterference intheguestOS(e.g.anOStaskthatstartsexecutinginsidetheVM) andinfluencesthemeasurementstakenatthisperiod.
5.3. ConcurrentVMscollocatedonadjacentcores
The third experiment aims at investigating the effect on the performance of VMs when running on different but adja-cent cores on the same CPU. This is to identify the effect of
Fig.5. Effectonindividualtestscoresfordifferentcombinationsofconcurrenttests.Eachofthegraphsindicatesatest’sperformance.Itcontains7lineswhichcorrespond
tothistest’sperformance,wheneachoftheothertestsisrunningontheotherVM,inadditiontoitsperformancewhenitisexecutedasstandaloneforcomparisonpurposes.
(a)Test1performance;(b)test2performance;(c)test3performance;(d)test4performance;(e)test5performance;(f)test6performance.
L1 cache memory interference, when compared to the results of B. In this setup, the cores have different L1 cache memo-riesbutcommonL2 ones.Thechosenutilizationpercentagefor thisexperiment was40% percore.Thereasonfor choosingthis percentage was to have comparable results with B, for which maximumassignmentoftwotasks ononecoreis40% pertask (aftersubtractingapproximately20%thatisalwaysavailablefor systemtasks).Comparisonwiththeotherscenarios isincluded inFig.6.
5.4. ConcurrentVMscollocatedonnon-adjacentcores
ThefourthconfigurationwasdecidedtobepinningtheVMson non-adjacentcores.Thereasonforthissetupisthatthephysical nodeoftheexperimentshas4cores,whichshareaL2cachein pairs.SobypinningtheVMs onnon-adjacentcores,thegainin termsofhavingnosharedcachememoriesisinvestigated,in com-parisontothepreviousexperimentwhereL2memorywasshared. Forallscenarios,thecombinedperformanceoftheVMsper
com-Fig.6. Comparisonofsystemlevel(addedscores)performanceforalldeploymentscenariosand40%CPUallocationperVM.Ineachofthegraphsaspecificcombination
oftestsisinvestigatedinordertocomparetheiraddedscores(verticalaxis)withregardtodifferentdeploymentscenariosandhowthisperformanceisaffectedbythe
schedulingperiodP(horizontalaxis).(a)Tests1and1combinedperformance;(b)tests6and6combinedperformance;(c)tests1and4combinedperformance;(d)tests1
and5combinedperformance;(e)tests2and4combinedperformance;(f)tests2and6combinedperformance;(g)tests3and5combinedperformance;(h)tests4and6
combinedperformance.
binationoftestsisdepictedinFig.6.Inthisfigure,wehaveadded thetestscoresofbothVMsandhaveplottedallthedeployment scenariosforcomparisonpurposes.Theremainingcombinations thatarenotincludedinthisfigurearelocatedinAppendixB(Fig. B.1).
Theanticipationduringthebeginningoftheseexperimentswas thatinterferencebetweenmemoryusageofconcurrentlyrunning VMswouldsignificantlyaffectVMperformance.Thiswasvalidated fromalltestedcases.Thebaselinescoresaremuchbetterthanany otherconfiguration,eventhoughthepercentageofcoreassignedto
Fig.7.Percentageofthedegradationofbenchmarkscoresforalltest
combina-tionsandscenariosandP=800msinordertoillustratetherangeoftheoverhead
andtheidentificationofoptimumcombinations.Inthehorizontalaxisthedifferent
testcombinationsareportrayedwhileintheverticalonethedegradationofthe
performanceasextractedfromEq.(1).
theVMswasthesame.Furthermore,differenttestscreatedifferent levelsofinterference,thusvalidatingtheinitialassumptionsthat carefulanalysismustbemadeinordertooptimizeVMgroupings onavailablenodes.Higherperiodsfortheschedulerseemalsoto benefittheperformance,duetobettercacheutilization.
However,itwasalsoanticipatedthatmovingfromtightly cou-pled configurations (same core) to more loosely coupledones (adjacentandnon-adjacentcores)wouldbenefittheperformance oftheVMs.Afterobservingthegraphs,wecanconcludetothefact thatthisdoesnothappen.Giventhattheloosely coupledcases meanL1cacheindependence(foradjacentcores)andL1/L2cache independence(fornon-adjacentcores)itcanbeassumedthatthe bottleneckthatiscausingthislackofperformanceimprovement hastodowithRAMaccesses.Thefactorofinfluenceinthiscasecan bethememorybus(FSB)thatisnecessaryforaccessingtheRAM. Intheobservedhardware,thiswasa1066MHzbus.However,this bandwidthissharedbetweenthedifferentcorestryingtoaccess themainmemory.IfmorethanonecorestrytoaccesstheRAMat thesametime,theavailablebandwidthwillbedividedbetween them.Thus,whenallocatingVMsondifferentcores(withthesame 40%share),thedividedbandwidthisalimitingfactorincomparison tothesamecorescenario.Forthesamecoredeployment,VMsare executedoneaftertheother,inasequential,pseudo-parallel fash-ion.Duringthistime,eachVMhasalltheavailablebandwidthof theFSB.Whenallocatedindifferentcores,fortheintervalinwhich the40%activationperiodsoftheVMsoverlap,theirbandwidthon theFSBwillbedivided.GiventhatthenumberofaccessestoRAM (orwhen)thatarenecessarycanbefluctuating,thiscanexplain whyinsomecasesoneconfigurationisbetterthantheother,with oneeffectprevailingovertheother(cacheinterferenceovershared FSBbandwidth).
Inordertobetterconcludeandillustrateforwhichcombination ofteststhisimprovementisgreater,thepercentagedegradationof thesystemleveltestscoresisportrayedinFig.7,forP=800ms.We chosethespecificperiodduetothefactthatitwasshownfrom thepreviousgraphsthatforthisvalueofPthesystemhadtheleast overhead.Thedegradationoftheperformanceistheratiobetween thetestscoresoftheaddedconcurrentexecutionsandtheonesof theaddedstandaloneones,forallthecombinationsoftestsandis derivedfromEq.(1).
%Degradation=100×(TAI+TTBI)−(TABase+TBBase)
ABase+TBBase (1)
Inthisformula,AandBarethetestnumberspercombination,Iis thedeploymentscenario(samecore,adjacentcores,non-adjacent cores)andBaseisthescoreswhenthetestsareexecutedas stan-dalone,withoutanyothertestrunningonthephysicalnode.
Theaimofthisfigureistoshowtheconcretepercentage over-heads ofdifferent scenariosand for differenttestcombinations andtoidentifyanypatternsthatcanbeofbenefitforextracting genericconclusions.Fromthisitcanbeshown thatthe compu-tationalcapabilitiesoftheVMscanrangefromalmost0andup to160%,dependingonthecollocatedtasksandthedeployment scenario.
Fromthisgraphitisalsoevidentthatthebestcombinations areforallapplicationswithtest5andthesecondfittestcandidate istest6.Thereasonwhythesegraphicstestsarethefittestcanbe attributedtothefactthattheyuseasmallamountofdata,onwhich theyperformalargenumberofcomputations.Worstcandidatefor co-allocationistest4,whiletheadjacentcoresplacementseemsto producethemaximumoverhead(combinationofL2andFSBbus interference).Thisisevidenceoftheimportanceofthe investiga-tionoftheinterferencecausedbetweenco-scheduledVMs,which canleadtosignificantdegradationoftheQoSfeaturesof applica-tionsrunninginvirtualizedinfrastructures.Furthermore,inmost casestheadjacentcoresetuphastheworstperformance,duetoL2 cacheinterferenceanddivisionofmemorybusbandwidth.L1cache interferenceseemstoaffectonlyalimitednumberofcombinations (like1and2).
5.5. Statisticalanalysisofthemeasurements
Inordertogatherthedatasetthatwaspresentedintheprevious graphs,eachconfiguration(specificschedulingperiod,specifictest combinationanddeploymentscenario)waslettorunfor500s.This meansthateachpointinthegraphs(withtheaccordingsetup)was producedfromtakingthemeanfromalltherunsexecutedinthis 500-sinterval.Thenumberofrunswasfluctuatingduetothefact thateachtesthaddifferentcomputationalneedsandalsothe over-headfromtheconcurrentlyrunningVMswasvarying.Howeverit wasintherangeofhundredsoftimesforeachdatapointThisis indicativealsoofthetestscores,whichindicatethetimeneededto performonerun.Themeanvaluefromthesehundredsoftimesof executionsforeachconfigurationwasusedinthegraphs.Details regardingthespecificnumbersforeachexperimentareincluded inAppendixD(Fig.D.1).
In order to further validate the data gathering process, we repeatedanumberoftheexperimentsfor10times.Thismeansthat theexecutionswithaspecificconfiguration(testcombinations,Q/P ratio,Pschedulingperiod)wereexecuted10timesinorderto inves-tigatethedifferencebetweennon-consecutiveexecutionswiththe sameconditions.Duringthisexperiment,eachconfiguration (500-sinterval)wasrunfor10timesinanon-consecutivemanner.The results(meanvalues ofthetestscoresinthe500-sintervaland standarddeviationsofthevaluesinsidethisinterval)areportrayed inFig.8.Fromthisitcanbeobservedthatthedifferencebetween thedifferentexecutionsisverysmall.
Furthermore,thenumberofrunsforeachtestineachofthe exe-cutionswasdocumentedandisshowninFig.9.Fromthisitcanbe observedthatforeachexecution(fromwhichthemeanvalueand standarddeviationthatisportrayedinFig.8wasextracted)around 320runswereconductedfortest4andaround230runsfortest5. Thedifferenceinthenumberofrunsbetweenthetwotestsoccurs fromthefactthateachtesthasdifferenttypesofcomputations, thusdifferenttimeofexecution.Itwaschosentosynchronizethe executionsbasedonagiventimeinterval(andnotonnumberof runs)inordertoensuretheconcurrencyofthecomputations.By havingthesamenumberofruns(anddifferenttimeforeachrunof eachtest)wewouldhavetheproblemofonetestfinishingfaster thananother.Thustheremainingrunsoftheslowertestwouldbe executedasinthestandalonephase.
Fromtheabovegraphswecanconcludethatduetothefactthat thetestrunsineachexecutionaresignificantlyhigh,repetitionof
Fig.8.Variationofthemeantimesandstandarddeviationsofthetestscoresfor
10differentnon-consecutiveexecutionsofthesameconfiguration(combination
oftests4and5,schedulingperiod=700ms,samecoreexecution).Thesamplefor
extractingthemeanvalueandstddevforeachexecutionhasbeengatheredafter
lettingeachexecutionrunfor500s.
Fig.9.Numberoftestrunsinsidethe500-ssamplegatheringintervalforeachof
thedifferentnon-consecutiveexecutionsofthesameconfiguration(combination
oftests4and5,schedulingperiod=700ms,samecoreexecution).
theexperimentswillproduceverysimilarvalues(asdepictedin Fig.8).Thedistributionoftheindividualvaluesofthetestscores fortest4appearsinFig.10,foroneofthe10executions(Fig.10a) andall10repetitions(Fig.10b).Fromthiscomparisonitcanbe concludedthatthetwodistributionsarealmostalike,showingthe peaksinthesamebins(0.8–1.2and1.2–1.4values).
Regardingthestatisticalanalysisofthesamplesgatheredinside asingleexecution,theconfidenceintervalsaredepictedinFig.11, forbothtests(4and5)oftheselectedrun.Forthisrun(500-s inter-val),test4wasexecuted232timeswhiletest5wasexecuted321 times.Inordertoprocesstheresults,thedfittoolofMatlabwas used.Fromthiswecanobservethat,especiallyfortest5thereare twomajorareasofconcentrationofthetest scores,aroundthe 0.9and1.3values.Thiscanbeattributedtotheinactiveperiods insertedbytheschedulerforthetask.Thisconfigurationhada40% shareoveraperiodof700ms.Thismeansthatfor60%ofthetime (420ms)thetaskisdeactivated.Thusifthetestrunmanagesto finishbeforetheinactiveperioditwillnothavetheextradelayof the420ms.Ifnot,thenitwillfinishrightafterthatinterval.This agreesalsowiththedifferencebetweenthetwomajorvaluesof thedistribution.
5.6. Networkresponse
Duringtheinitialtestsfortheexperimentsof5.1itwasnoticed that for low values of period P (below 100ms) the VMs were extremelyunresponsive,evenforasimplesshconnectionorping.
Fig.10. Histogramofthedistributionofindividualtimesforeachtestrunfor(a)1
executionofthe500-sintervaland(b)10executionsofthe500-sintervalwitha
givenconfiguration(combinationoftests4and5,schedulingperiod=700ms,same
coreexecution).
Fig.11.Cumulativedistributionfunctionandconfidenceintervalsfortests4and5
executionsamplesforschedulingperiod=700ms,samecoreexecution.The
hori-zontalaxissymbolizesthetestscoresandtheverticalaxistheprobabilitytohave
thesescores.
Forthisreasonitwasdecidedtoconductanotherexperimentin order toinvestigate the deterioration of VM network response times.ThisinvestigationinvolvedthepingingofoneVMfora cer-tainperiodoftime(300s)foranumberofdifferentconfigurations. Differentpingperiodswereused.Thenumberofsamplescanbe derived fromthedivision ofthe300-s period withthepinging period.DifferentpercentagesofCPUassignmentswerealsotaken underconsiderationanddifferentperiodsPofthescheduling allo-cation.DetailedvaluesappearinTable3.
InordertostresstheCPUtofullload,twoapproacheswere con-sidered.ThefirstwaswithoneoftheMatlabbenchmarks.Inorder toavoidtheeffectofsomespecificcomputationinterferencethat couldbecausedbythesetests(likeincreasedI/Othatcouldincrease
Table3
Parametersvariedforthepingexperiment.
Pingingperiod 0.5,1,1.5and2s
SchedulingperiodP 150–800ms(50msstep)
VMstatus Fullload
Q/P 20,40,60and80%
theservedinterruptsandaffectthepingresponses),another
exe-cutablewascreated.Thiswascomprisedofasimpleinfinitefor
loopthatcalculatedthesquarevalueoftheloopindex.Theresults
werealmostidentical.Inthefollowinggraphs(Fig.12),themean
valueanddeviationoftheresponsetimesaredepicted,forthemost stressfulexperiment (pingingperiod=0.5s).Morecombinations areincludedinAppendixC(Fig.C.1).
ItisimperativetostressthatthetestbeganfromP=50msof granularity,howevertheVMsshowedlittleresponsiveness,with manypackettimeoutsoccurring.Fullresponsivenesswasshown from150msvalues,andfromthesevaluesandontheplotswere created.Whatisseenfromthesemeasurementsisthatafterthe initialgranularitieswhentheVMisunresponsive,lowvaluesofP aremorebeneficialforthenetworkmetrics(bothmeanvalueand deviationfromthatforeachindividualpackettime).Furthermore, onetheoreticalexpectancywouldbethatthepingtimeswould deteriorateasthePvaluesincreased,duetothefactthatforlow percentagesofCPUassignments,largeinactiveperiodsofthetask wouldaffectespeciallythedeviationtimes.However,asseenfrom thegraphs,thehighestvaluesforbothmetricsareformiddlecases ofP(forthe450mscase).Afterthismaximum,thenetworkmetrics seemtoimproveagain,howevernottothelevelsofthelowP val-ues.SimilarbehaviorwasnoticedforadjacentvaluesofP(200ms, 400msand800ms).Thesewereskippedforbettervisibilityofthe graphs.Anotherinterestingconclusionisthatthepingingperiod doesnotseemtoaffectthisbehavior.
ThesimilarityofthemetricsforhighvaluesoftheallocationQ/P (%CPUshare)isduetothefactthatforpercentagescloseto100% (likethe80%case),theCPUisalmostdedicatedtothetask,sothe periodofthisallocationdoesnotinfluencetheVMbehavior.Almost theentiretimethetaskisactive.
Forthestatisticalanalysisofthemeasurementswehaveused asanexampletheconfigurationforschedulingperiodof150ms, pinging period of 0.5sand CPU share of 60%. The distribution of the600 individualvalues collected duringthe sample gath-eringexperiment is depictedin Fig.13a.In Fig. 13b thefitting of an exponential distribution to these values is shown, with meanvalue=461.544,variance=213,023,stderror=18.8739and estimatedcovariance=356.226.Exponentialdistributionsare com-monlyusedfornetworkingtimes,asalsoshowninCucinottaetal.
Fig.13.(a)Distributionoftheindividualpingdelaysin500msbinsand(b)Density
distributionofindividualvalues(pingtimes)andfittingofanexponential
distribu-tionforschedulingperiodof150ms,pingingperiodof0.5sandCPUshareof60%.(a)
Histogramofthedistributionoftheindividualvaluesand(b)densitydistribution
andfittingofanexponentialdistribution.
(2010a).TheCDFandconfidenceintervalsforallCPUsharesofthis configurationareshowninFig.14,fromwhichthebenefitofhaving moreCPUshareisvisualizedinamorequantitativeway.
6. Predictionofoverhead
The experiments that were presented above are helpfulfor an infrastructure/Cloud provider in order tobe able to have a generalizedpictureofhowapplicationperformancedeteriorates followingtheplacementdecisions.Thehighlevelconclusionscould alwaysbeextractedasfuzzylogicrulesinasimilardecision mak-ingmechanismthatwouldaidtheproviderduringthescheduling
Fig.12.(a)Meantimeoftheresponsetimesforfullloadandvariousconfigurationsofgranularityofassignment(schedulingperiod)Pandpingingperiod0.5sand(b)Mdev
time(asreportedbythepingcommand)oftheresponsetimesforfullloadandvariousconfigurationsofgranularityofassignment(schedulingperiod)Pandpingingperiod
Fig.14.Cumulativedistributionfunctionandaccordingconfidenceintervalsforall
CPUshares,forschedulingperiodof150ms,pingingperiodof0.5s.Thehorizontal
axisisthetimedelayinmillisecondsandtheverticaltheprobabilitytohaveaping
timelessorequaltothisdelay.
and allocation policiesenforcement.However, in order for this approachtomeetitsfullpotential,asuitablegenericmodelshould bedesigned.Thismodelmustbeabletoextractaccurate predic-tionsregarding theanticipated performance oftheapplications thathavesimilarbehaviortotheinvestigatedtests.Itmustbeable totakeasinputtheconditionsofexecutionandproducethe antici-patedlevelofperformance(testscore),thusaccuratelyquantifying theexpectedoverhead.
Inordertoimplementsuchasystem,themostgeneric black-boxmethodwaschosen,anartificialneuralnetwork(ANN).ANNs areamethodologythataimstoimitatethebehaviorofthehuman brainandhavebeenuseduptonowforanumberofapplications (e.g.patternrecognition,functionapproximation,classificationor timeseriesprediction).Theirmainabilityistomodelasystem’s behaviorbasedonlyona trainingdataset(blackboxapproach) thatincludesanumberofsysteminputsandtheaccording out-puts.Ingeneral,theANNcorrelatestheinputwiththeoutputdata inordertofindanoverallapproximationofthemodelfunctionthat describesthedependenceoftheoutputfromtheinput.Itwas cho-sensinceasdemonstratedinSection5,therearenumerous,even hidden,factorsthatmayaffectanapplication’sperformancelike hardwaredesigndetails.Havingananalyticalmodelingapproach isalmostimpossible,giventhevarietyofthesefactors.Buteven ifonedevotessuchanefforttocreateadetailedmodel,itwillbe deemeduselesswiththenextprocessorgenerationoradifferent architecturaldesign.TheANNsofferamuchmoregenericand flexi-bleapproach,andgivenonlyasuitabledataset,canachieveaquick andsatisfactorymodel.
TheidentifiedinputsandoutputsoftheANNmodelaredepicted inFig.15andincludetheinvestigatedparametersoftheprevious sections.
Therangeorpotentialvaluesoftheparametersarelistedin Table4.
All the inputs and outputs were normalized in the (−1,1) numericinterval.Forthenon-numericinputs,thesewereassigned
Fig.15.ANNmodel.
Table4
Rangeofparameters.
Testnumber/applicationtype1 Canbefrom1to6(Matlab benchmarks)
Testnumber/applicationtype1 Canbefrom1to6(Matlab benchmarks)
Q/P(core%) 0–80%
P Arbitrary(inourcaseitis
from200to800ms)
Executionmode Canbestandalone,same
core,adjacentcores, non-adjacentcores
differentvaluesforeachstate.Thenormalizationisnecessaryfor
internalANNrepresentationandbetterdepictionofthesystem.The
datasetthatwaspresentedintheprevioussections(1100different
executions,eachfor500s)wasusedfortraining(50%),intermediate
validationduringtraining(20%)andindependentvalidation(30%)
ofthenetwork.
6.1. OptimizationofANNstructureandparameters
Despitetheiradvantages,ANNscomewithanimportant
draw-back.Thedecisionsregardingtheirdesignparameters(likenumber
of hidden layers, transferfunctions for each layer and number
of neuronsper layer)are more or lessbased onthe designer’s
instinctandexperience.Inordertoautomateandoptimizethis
process,anevolutionaryapproachwasfollowedinthispaper.The
aforementionedparametersoftheANNdesignwereinsertedin
a Geneticalgorithm (GA) (Holland,1975), in order tooptimize
theirselection.In each generationof theGA,a setof solutions istried out,through trainingand validatingtherespective net-works.Theperformancemetricforeachsolution,inourcasethe errorinthetraining set,is thenreturnedtotheGA,asan indi-cationofitssuitability.Thenthenextgenerationiscreatedbythe bestsolutionsofthecurrentone(elitism),combinationsofexisting solutions(crossover)andslightdifferentiationofthem(mutation). Throughthisalgorithm,theparameterspaceisquicklysearched forasuboptimalsolution.TheparametersthatarefedintotheGA appearinFig.16.
Inorder toimplement theaforementionedapproach,an ini-tialGAscriptiscreatedinordertohandlethepopulationineach iteration and tolaunch theANNcreator script, afterfeeding it withthevaluesthataredepictedinthechromosomes.TheANN creatorscripttakesthevariablesfromtheGAscriptand dynami-callycreatestheANNsaccordingtotheGA-selectedparameters,by changingthenetworktopology.Thenitinitializesandtrainsthem (feed-forward,backpropagationnetworkswereused,trainedwith theLevenberg–Marquardt(Moré,1978)algorithm)andreturnsthe
Fig.16.ParametersoftheANNdesigntakenfromtheGA.Theseincludehowmany
hiddenlayerswillbeinitializedandwhatwilltheirtransferfunctionandtheir
neurons.Theseparameterswereingeneraldecidedbyahumanexpertbasedon
Table5
DetailsofthebestANNstructureasthiswasderivedfromtheoptimizationprocess,fordifferentnumberofgenerationsoftheGA.
Numberoflayers/GAgenerations Neuronsperlayer Transferfunctionsperlayer Meanabsoluteerror(%) Standarddeviation Time
4/30 5–7–19–1 Satlin–Radbas–Radbas–Satlins 5.94 16.47 40min
3/50 5–7–1 Tansig–Tansig–Purelin 5.06 13.85 1.1h
4/100 5–10–18–1 Radbas–Softmax–Radbas–Netinv 4.59 14.80 3h
4/150 5–24–8–1 Purelin–Logsig–Logsig–Satlins 5.16 14.61 5h
performancecriterion(errorinthetrainingset)totheGAforthe
evaluation ofeach solution.Anintermediate validationsetwas
usedinordertoenhancetheANNgeneralizationcapabilities,the
network’sabilitytopredictcasesthatithasnotmetbefore
dur-ingtraining.Inthiscase,eachnetworkwastrainedbythe50%of
thedatasetthenifitspredictionsontheintermediatevalidation
sethadameanabsoluteerror(MAE)smallerthan10%,this
net-workwassaved.Intheendofthegenerations,fromallthesaved
networks,thefinalcandidatewastheonethatshowedthebest
performance(MAE)intheindependentvalidationset.Itwasalso
investigatedifthereturnedmetricoftheGAwastheMAEinthe
intermediatevalidationset,insteadofthetrainingseterror.This
showedaworseperformance.
13 different transfer functionswere taken under
considera-tion(astheyaredescribedinhttp://www.mathworks.com/help/
toolbox/nnet/function.html) and a maximum limit of ten (10) layersandthirty(30)neuronsperlayerwasinserted.Four inde-pendentrunswereconductedfordifferentnumberofgenerations (30,50,100and150). Eachgenerationinvestigated20possible solutions.
TheANNstructureandoverallpredictionaccuracyfortheseis describedinTable5.Inthistable,onlythebestmodelfromeach runisdepicted.Themeanabsoluteerrorforall328independent validationcasesisbetween4.5and5.94,dependingonthe num-berofgenerationsused,whichcanbeconsideredasaverygood estimator.Onlythevaluesintheindependentvalidationsetwere usedforthecalculationofthiserror.Thesedatahavenotbeenused duringtraining.
The deterioration in the performance for 150 runs is not expectedbutcanbeattributedtothefactthateachGArundepends onsomerandomparameters,liketheinitialvalues ofthe chro-mosomeortherandomnessintheselectionofcharacteristicsto mutate. In a real-world situation,this can beeasily tackledby addinggenerations ofinvestigationuntila specificperformance criterionismet.Themostsuitablesolutionsarefoundinthe50 and100generationsruns.Thedifferenceliesinthefactthatfor 100generationsabettermeanerrorisacquiredbutaworse devi-ationmetric.Thefinalchoicedepends onthetrade-offbetween thesecharacteristics.
Anotherinteresting conclusionis that smallernetworks are moreabletocapturethedependenciesbetweentheinputandthe output.Eventhoughthenumberoflayershadamaximumvalue of10, only3or4-layernetworks showedgoodperformance(3 istheminimumlimitforANNs).Thiscanbeattributedtomore robustbehavior ofsmall networksdue tothefollowing aspect. Theinfluenceofthejthinputtotheithoutputdependsonallthe alternativepathsthatconnectthemandtheincreaseofthispath number(becauseofhighernumberoflayers)seemstoincrease thestandarddeviationoftheprediction.Asimilarresultappears inthecircuitsynthesisdomain,wheretheincreaseinthenumber ofpaths(laddercompared tolatticesynthesis)resultsinhigher systemsensitivity.
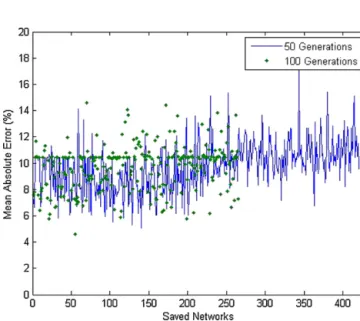
InFig.17theevolutionofthemeanabsoluteerrorofthesaved networksisportrayedforeachrun.Thesenetworksaresavedas theGAprogressesandiftheintermediatevalidationcriterionis met(errorintheintermediatevalidationset<10%).Thelackof sta-bility(continuouslyreducedmeanerror)inthisprocessisdueto
Fig.17.Temporalevolutionoftheperformance(meanabsoluteerroronthe
inde-pendentvalidationset)ofthenetworksthatmeetthesavecriterion(MAE<10%
ontheintermediatevalidationset).Afteraperiodoftime,theGAhasconverged
toasuitablesolution,afterwhichtheperformanceoftheinvestigatednetworks
deteriorates.
thefactthatrandomnessisuptoapointinherentinan evolution-aryapproach duetotheuseof operatorssuchasmutationand crossover.
Furthermore,fromthisgraphitisevidentthatalargenumber ofgoodqualitynetworksareproducedthroughtheproposed opti-mizationprocess.It canalsobeseenthatthenetworksthatare savedinlatergenerationsofonerunappeartobelosingquality. ThiscanbeattributedtothefactthatwhentheGAfindsagood solution,italsofocusesonnearbysimilarconfigurations.Ifthegood solutionisthelocalorglobaloptimum,thenthenearbysolutions willbeunderperformingandalargenumberofthecandidateswill bedevotedtothisareainvain(othersolutionsbasedoncrossover willsearchtheremainingsamplespace).Howeverthisisalsooneof thestrengthsofGAs,sincethroughthisprocessintheearlystages vastareasofthesamplespacearetriedoutandafterwardsthebest onesarethoroughlyexaminedinordertofindtheoptimalsolution inthatparticularinterval.
Thedistributionoftheerrorsofthenetworkinpredictingthe performance(testscores)isdirectlycomparedtothemulti-variate regressionmethodinFig.18.Thisaccuracyisbasedonlyonthe independentvalidationsetonly,forobjectivitypurposes.
6.2. Comparisonwithmulti-variatelinearregression
Inordertocompareourapproach,themultivariateregression methodwaschosen,thatisalsousedinKohetal.(2007).The MAT-LABfunctionmvregresswasused,inthesamenormalizeddataset. Theonlydifferencewasthatnowthetrainingandintermediate validationdatavectorsweremerged.Inthismethod,thereisno needtohaveintermediatevalidationstep.Forthevalidationofthe results,thesame30%independentvalidationdatasetwasused, forobjectivitypurposes.Thedetailsoftheapproximationfunction
Fig.18.Histogramoftheerrorsintheindependentvalidationsetfor50and100
generationrunsoftheGA-ANNmodelcomparedtomulti-variateregression.The
differenceliesonthecenterofthedistributions,whichfortheproposedmethod
isaround0whileformv-regressisaround8%,Thehorizontalaxisistheerror(%)
intheestimation(inbins)whiletheverticalisthenumberofvalidationcasesfor
whichtheerrorwasinthespecificbin.
Table6
Multi-variateregressiondetails.
Coefficients Meanabsoluteerror Standarddeviation Timeneeded
0.0218 8.78% 18.15 ∼1s −0.0171 0.8326 −0.0801 0.0631 0
appearinTable6.Thecoefficientscellcontainsintherespective
orderthemultipliersforeachoneofthe5inputsdepictedinFig.15, plustheconstantfactor.Theirvaluesarelowbecausetheyhave beenderivedforthenormalizedvaluesofthedatasetinthe[−1,1] interval.
TheresultsfromthismethodhavebeenincorporatedinFig.18 fordirectcomparisonwiththebestANNmodelsfromthe optimiza-tionmethod.
Fromthecomparisonofthetwoapproachesitcanbeconcluded thattheoptimizedANNshaveabetterperformanceintermsof meanabsoluteerrorandstandarddeviation.Thisisalsoevident fromthedistributionoftheerrorsasdepictedinthehistogram. WhiletheANNmodelsexhibithighconcentrationoferrorsaround thezerovalue,thisisnotthecasefortheregressionmodel,which concentratesaroundthe8–10%errorpoint.
Thestandarddeviationvaluesarehighforbothmethods,but this is due tospecific values of the328-case validation set for which the measurements have large deviations. This happens for thepeaks ofthe graphspresented in Section 5 and canbe attributedtosomerandomeffectsthataffectsystemperformance (e.g.systemtasks that updatethe OS inside theVM, etc.),like in the case of P=250ms that was mentioned in the previous sections.
However,becausetheproposedmethodhasmuchlarger com-putationalneeds,forenvironmentswhere newmodelsmustbe createdontheflythemulti-variateregression method offersa satisfactoryperformanceinaveryfastway.Inthecontextof inves-tigationinthispaper(infrastructure/Cloudproviderthatwantsto haveamodelformoreefficientallocationofVMsovernodes),the computationalneedsoftheoptimizedANNmethodarenot con-sideredaconstraint.Themodelswillbecreatedonce,andmaybe refreshedinthefuturewithnewdata.However,tighttiming con-straintsfortheproductionofthemodelsdonotexist.Thisisan off-lineprocess.
Detailed percent improvements achieved by the compared methodaredepictedinTable7.
For the response time of the models, that is the duration needed for each model to provide the prediction after the
Table7
ComparisonbetweenmultivariateregressionandGA-optimizedANNs.
Method %Improvement(ANN
meanabsoluteerror comparedto mvregress) %Improvement(ANN standarddeviation comparedto mvregress) 50gen.GA-ANN 42.36% 23.64% 100gen.GA-ANN 47.61% 18.4%
assertion of the conditions of execution to theinput, this was
better for the multivariate regression. However, for the ANN
it was also very fast (∼10ms), thus not making this a critical
limitation.
7. Conclusionsandfuturework
Asaconclusion,theemergenceofvirtualizedandshared
infras-tructureslikeCloudsimposesasignificantchallengeforproviders
and applications. Applications that are running inside virtual
machinesareaffectedbymanyfactorslikevirtualizationand
co-allocationofotherVMs.Inthispaper,theeffectsoftheseallocation
decisionswereinvestigated,bytakingunderconsiderationa
sig-nificantnumberofparameterslikerealtimeschedulingdecisions,
typesofworkloadanddifferentdeploymentscenarios.The
perfor-manceoverheadposedbytheseparameterscanreachupto150%,
whilecarefullyselectingtheco-allocatedtasksandthescenarioof
placementcanminimizeorevencancelthiseffect.Whatismore,
higherschedulingperiodsresultinasignificantreductioninthe
overheadcausedbytheinterference.Furthermore,theapplication
ofsuchaperformanceanalysismethodonnewhardwaredesign
mayleadtooptimizedmulti-corearchitecturesforCloud-specific
environments,throughtheidentificationofbottleneckslikethe
sharedmemorybus.
Inordertoprovideanautomaticdecisionmakingmechanism
thatwill guidetheinfrastructurestoproperconfigurationsand
removetheneedofhumanintervention,aGA-optimizedANNcan
beusedtomodel,quantifyandaccuratelypredicttheperformance
oftheapplicationsforagivenconfiguration.Themodelacquired
fromthisprocess iseffective(error<5%),generic andcanbeat
any time extended in order to include other identified
signifi-cantfactorsorscenarios.Throughtheuseofthismechanism,an
infrastructure/Cloudprovidercanhaveaprioriknowledgeofthe
interference.Thustheyareabletooptimizethemanagementof
thephysicalresources.
Forthefuture,oneinterestingaspecttopursueistheautomatic
detectionofthetypeofworkloadcausedbyeachapplication.Inthis
study,theanalysiswasbasedonthe6Matlabbenchmarktests,that
depictdifferenttypesofcomputations.Forreal-worldapplications
thismeansthattheymust bematchedtooneormoreofthese
elementarytests,basedforexampleonthecomparison oftheir
footprints.
Acknowledgments
ThisresearchispartiallyfundedbytheEuropeanCommission
aspartoftheEuropeanIST7thFrameworkProgramthroughthe
projectsIRMOSundercontractnumber214777andOPTIMISunder
contractnumber257115.
AppendixA. RemainingfiguresfromSection5.1
Fig.A.1.RemainingfiguresfromSection5.1(Fig.4:testscoresfordifferentCPUpercentagesandgranularity(schedulingperiod)whenthetestsarerunningwithoutany
interference(co-scheduledtests).Thetestscore(verticalaxis)indicatesthetimeneededforexecutingonetestrunandhasbeencalculatedfromthemeanvalueofhundreds
oftestrunsinsidea500-sexecutionrun.Theschedulingperiod(horizontalaxis)isthetimeintervalinwhichtheallocationofX%CPUshareisguaranteed).(a)Standalone
test3;(b)standalonetest2;(c)standalonetest5.
AppendixB. RemainingcombinationsfromSection5.4
SeeFig.B.1.
AppendixC. Figuresforpingingperiod=2s(continuation ofSection5.5)
Fig.B.1.RemainingcombinationsfromSection5.4(Fig.6:comparisonofsystemlevel(addedscores)performanceforalldeploymentscenariosand40%CPUallocation
perVM.Ineachofthegraphsaspecificcombinationoftestsisinvestigatedinordertocomparetheiraddedscores(verticalaxis)withregardtodifferentdeployment
scenariosandhowthisperformanceisaffectedbytheschedulingperiodP).(a)Tests1and3combinedperformance;(b)tests4and4combinedperformance;(c)tests4
and5combinedperformance;(d)tests5and5combinedperformance;(e)tests3and4combinedperformance;(f)tests2and3combinedperformance;(g)tests1and6
combinedperformance;(h)tests3and6combinedperformance;(i)tests2and5combinedperformance;(j)tests2and2combinedperformance;(k)tests3and3combined
Fig.C.1.(a)Meantimeoftheresponsetimesforfullloadandvariousconfigurationsofgranularityofassignment(schedulingperiod)Pandpingingperiod2sand(b)Mdev
time(asreportedbythepingcommand)oftheresponsetimesforfullloadandvariousconfigurationsofgranularityofassignment(schedulingperiod)Pandpingingperiod
2s(continuationofSection5.5).
AppendixD. Numberofexecutionsforeachofthedata pointsinsamecorescenariographs
Fig.D.1.Numberoftestrunsfromwhichthemeanvaluesforthescoreswereextractedforthesamecorescenariographs(Fig.5)for(a)test1whenitiscoscheduledwith
allothertests,(b)test2whenitiscoscheduledwithallothertests,(c)test3whenitiscoscheduledwithallothertests,(d)test4whenitiscoscheduledwithallothertests,
(e)test5whenitiscoscheduledwithallothertests,(f)test6whenitiscoscheduledwithallothertests.(a)Test1numberofrunswhenco-scheduledwithallothertests;(b)
test2numberofrunswhenco-scheduledwithallothertests;(c)test3numberofrunswhenco-scheduledwithallothertests;(d)test4numberofrunswhenco-scheduled
Fig.D.1. (Continued).
References
Armbrust, M., Fox, A., Griffith, R., Joseph, A.D., Katz, R., Konwinski, A., Lee,
G.,Patterson,D.,Rabkin,A., Stoica,I.,Zaharia, M.,2010.Aview ofcloud
computing. Commun. ACM 53 (4), 50–58, doi:10.1145/1721654.1721672,
http://doi.acm.org/10.1145/1721654.1721672.
Checconi,F.,Cucinotta,T.,Faggioli,D.,Lipari,G.,2009.Hierarchicalmultiprocessor
CPUreservationsfortheLinuxKernel.In:Proceedingsofthe5thInternational
WorkshoponOperatingSystemsPlatformsforEmbeddedReal-Time
Applica-tions(OSPERT2009),Dublin,Ireland.
Cucinotta,T.,Anastasi,G.,Abeni,L.,2009.Respectingtemporalconstraintsin
vir-tualisedservices.In:Proceedingsofthe2ndIEEEInternationalWorkshopon
Real-TimeService-OrientedArchitectureandApplications (RTSOAA2009),
Seattle,Washington,July.
Cucinotta,T.,Checconi,F.,Kousiouris,G.,Kyriazis,D.,Varvarigou,T.,Mazzetti,
A., Zlatev, Z., Papay, J., Boniface, M., Berger, S., Lamp, D., Voith, T.,
Stein, M., 2010a. Virtualised e-Learning with real-time guarantees on
the IRMOS platform. In: Proceedings of the IEEE International
Confer-enceonService-OrientedComputingandApplications(SOCA2010),Perth,
Australia.
Cucinotta,T.,Giani,D.,Faggioli,D.,Checconi,F.,2010b.Providingperformance
guar-anteestovirtualmachinesusingreal-timescheduling.In:Proceedingsofthe
5thWorkshoponVirtualizationandHigh-PerformanceCloudComputing(VHPC
2010),Ischia(Naples),Italy.
El-Refaey,M.A.,Rizkaa,M.A.,2010.CloudGauge:adynamiccloudandvirtualization
benchmarkingsuite.In:EnablingTechnologies:InfrastructuresforCollaborative
Enterprises(WETICE),201019thIEEEInternationalWorkshopon,vol.,no.,pp.
Fiszelew,A.,Britos,P.,Ochoa,A.,Merlino,H.,Fernández,E.,García-Martínez,R.,
2007.Findingoptimalneuralnetworkarchitectureusinggeneticalgorithms.
Adv.Comput.Sci.Eng.Res.Comput.Sci.27.
García-Guirado,A.,Fernández-Pascual,R.,García, J.M.,2009.Virtual-GEMS:An
infrastructuretosimulatevirtualmachines.In:FifthAnnualWorkshopon
Mod-eling,BenchmarkingandSimulationMoBS2009heldinConjunctionwiththe
36thAnnualInternationalSymposiumonComputerArchitectureSunday.
Giustolisi,O.,Simeone,V.,2006.Optimaldesignofartificialneuralnetworksbya
multi-objectivestrategy:groundwaterlevelpredictions/Constructionoptimale
deréseauxdeneuronesartificielsselonunestratégiemulti-objectifs:prévisions
deniveaupiézométrique.Hydrol.Sci.J.51(3),502–523.
Holland,J.,1975.AdaptationinNaturalandArtificialSystems.UniversityofMichigan
Press,AnnArbor.
http://support.gams-software.com/doku.php?id=platform:aws. http://view.eecs.berkeley.edu/wiki/Dwarfs. http://www.irmosproject.eu/Postproduction.aspx. http://www.javaworld.com/javaworld/jw-12-2000/jw-1229-traps.html?page=4. http://www.linux-kvm.org/. http://www.mathworks.com/help/techdoc/ref/bench.html. http://www.mathworks.com/help/toolbox/nnet/function.html. http://www.mathworks.com/matlabcentral/fileexchange/11984. http://www.vmware.com/. http://www.xen.org/.
Ilonen,J.,Kamarainen,J.K.,Lampinen,J.,2003.Differentialevolutiontraining
algo-rithmforfeed-forwardneuralnetworks.NeuralProcess.Lett.17(February(1)).
IRMOSProjectD5.1.1,2009.Modelsofrealtimeapplicationsonserviceoriented
infrastructures,It-Innovationandotherpartners.
Jin,H.,Cao,W.,Yuan,P.,Xie,X.,2008.VSCBenchmark:benchmarkfordynamic
serverperformanceofvirtualizationtechnology.In:Proceedingsofthe1st
Inter-nationalForumonNext-generationMulticore/ManycoreTechnologies,Cairo,
Egypt.
Khalid,O.,Maljevic,I.,Anthony,R.,Petridis,M.,Parrott,K.,Schulz,M.,2009.Dynamic
schedulingofvirtualmachinesrunningHPCworkloadsinscientificgrids.In:
NewTechnologies,MobilityandSecurity(NTMS),20093rdInternational
Con-ferenceon,vol.,no.,pp.1–5,20–23Dec.,doi:10.1109/NTMS.2009.5384725.
Koh,Y.,Knauerhase,R.C.,Brett,P.,Bowman,M.,Wen,Z.,Pu,C.,2007.Ananalysis
ofperformanceinterferenceeffectsinvirtualenvironments.In:ISPASS,.IEEE
ComputerSociety,pp.200–209.
Kousiouris,G.,Checconi,F.,Mazzetti,A.,Zlatev,Z.,Papay,J.,Voith,T.,Kyriazis,D.,
2010.Distributedinteractivereal-timemultimediaapplications:asampling
andanalysisframework.In:1stInternationalWorkshoponAnalysisToolsand
MethodologiesforEmbeddedandReal-timeSystems(WATERS2010),Brussels,
Belgium.
Leung,F.H.F.,Lam,H.K.,Ling,S.H.,Tam,P.K.S.,2003.Tuningofthestructureand
parametersofaneuralnetworkusinganimprovedgeneticalgorithm.IEEETrans.
NeuralNetwor.14(January(1)).
Liu,C.L.,Layland,J.,1973.Schedulingalgorithmsformultiprogramminginahard
real-timeenvironment.J.ACM20(1).
Makhija,V.,etal.,2006.VMmark:ascalablebenchmarkforvirtualizedsystems.
Technicalreport,VMWare.
Moller,K.T.,Virtualmachinebenchmarking.DiplomaThesis.UniversitatKarlsruhe
(TH).2007.
Moré,J.J.,1978.TheLevenberg–Marquardtalgorithm:implementationand
the-ory.In:Watson,G.A.(Ed.),NumericalAnalysis,Dundee1977.LectureNotesin
Mathematics,vol.630.Springer,Berlin,pp.105–116.
Padala,X.Z.,Wanf,Z.,Singhal,S.,Shin,K.,2007.Performanceevaluationof
vir-tualizationtechnologiesforserver consolidation.HPLabs,Tech.Rep.
HPL-2007-59.
Soror, A.A., Minhas, U.F., Aboulnaga, A., Salem, K., Kokosielis,P., Kamath, S.,
2008.Automaticvirtualmachineconfigurationfordatabaseworkloads.ACM
Trans.DatabaseSyst.35(1),47p,Article7,doi:10.1145/1670243.1670250,
http://doi.acm.org/10.1145/1670243.1670250.
Tickoo,O.,Iyer,R.,Illikkal,R.,Newell,D.,2010.Modelingvirtualmachine
perfor-mance.ACMSIGMETRICSPerform.Eval.Rev.37,55.
Tikotekar,A.,Vallˇıee,G.,Naughton,T.,Ong,H.,Engelmann,C.,Scott,S.L.,Filippi,A.M.,
2008.Effectsofvirtualizationonascientificapplicationrunningahyperspectral
radiativetransfercodeonvirtualmachines.In:Proc.ofHPCVirt’08.USA,ACM,
pp.16–23.
Weng,C.,Wang,Z.,Li,M.,Lu,X.,2009.Thehybridschedulingframeworkfor
virtual machine systems VEE‘09. In:Proceedings of the 2009ACM
SIG-PLAN/SIGOPSInternationalConferenceonVirtualExecutionEnvironments,
ACM,pp.111–120.
White,J.,Pilbeam,A.,2010.ASurveyofVirtualizationTechnologiesWith
Perfor-manceTesting,ArXive-prints,1010.3233.
Youseff,L.,Butrico,M.,DaSilva,D.,2008.Towardaunifiedontologyofcloud
comput-ing.In:GridComputingEnvironmentsWorkshop,2008.GCE‘08gridComputing
EnvironmentsWorkshop,2008,GCE‘08,pp.1–10.
GeorgeKousiourisreceivedhisdiplomainElectricalandComputerEngineering
fromtheUniversityofPatras,Greecein2005.HeiscurrentlypursuinghisPh.D.in
GridandCloudcomputingattheTelecommunicationsLaboratoryoftheDept.of
ElectricalandComputerEngineeringoftheNationalTechnicalUniversityofAthens
andisaresearcherfortheInstituteofCommunicationandComputerSystems(ICCS).
HehasparticipatedintheEUfundedprojectsBEinGRIDIRMOSandOPTIMISandthe
NationalprojectGRID-APP.Inthepasthehasworkedforprivate
telecommunica-tionscompanies.Hisinterestsaremainlycomputationalintelligence,optimization,
computernetworksandwebservices.
TommasoCucinottagraduatedinComputerEngineeringattheUniversityofPisa
in2000,andreceivedthePh.D.degreeinComputerEngineeringfromtheScuola
SuperioreSant’AnnaofPisain2004.HeisAssistantProfessorofComputer
Engineer-ingattheReal-TimeSystemsLaboratory(ReTiS)ofScuolaSuperioreSant’Anna.His
mainresearchactivitiesareintheareasofreal-timeandembeddedsystems,with
aparticularfocusonreal-timesupportforgeneral-purposeOperatingSystems,and
security,withaparticularfocusonsmart-cardbasedauthentication.
TheodoraA.VarvarigoureceivedtheB.TechdegreefromtheNationalTechnical
UniversityofAthens,Athens,Greecein1988,theMSdegreesinElectrical
Engi-neering(1989)andinComputerScience(1991)fromStanfordUniversity,Stanford,
Californiain1989andthePh.D.degreefromStanfordUniversityaswellin1991.
SheworkedatAT&TBellLabs,Holmdel,NewJerseybetween1991and1995.
Between1995and1997sheworkedasanAssistantProfessorattheTechnical
UniversityofCrete,Chania,Greece.Since1997shewaselectedasanAssistant
Pro-fessorwhilesince2007sheisaProfessorattheNationalTechnicalUniversityof
Athens,andDirectorofthePostgraduateCourse“EngineeringEconomicsSystems”.
Prof.Varvarigouhasgreatexperienceintheareaofsemanticwebtechnologies,
schedulingoverdistributedplatforms,embeddedsystemsandgridcomputing.
Inthisarea,shehaspublishedmorethan150papersinleadingjournalsand