Conformational properties, membrane interaction, and antibacterial activity of the
peptaibiotic chalciporin A: multi-technique spectroscopic and biophysical
investigations on the natural compound and labeled analogs
Barbara Biondi*1, Cristina Peggion2, Marta De Zotti2, Chiara Pignaffo2, Annalisa Dalzini2, Marco Bortolus2, Simona Oancea3, Geta Hilma4, Annalisa Bortolotti5, Lorenzo Stella5, Jens Z. Pedersen6, Victoria N. Syryamina7, Yuri D. Tsvetkov7, Sergei A. Dzuba7, Claudio Toniolo1,2, Fernando Formaggio1,2
1 Institute of Biomolecular Chemistry, Padova Unit, CNR, 35131 Padova, Italy 2 Department of Chemical Sciences, University of Padova, 35131 Padova, Italy 3
“Lucian Blaga” University of Sibiu, Department of Agricultural Sciences and Food Engineering, 550012 Sibiu, Romania
4
“Lucian Blaga” University of Sibiu, Department of Medicine, 550012 Sibiu, Romania
5 Department of Chemical Sciences and Technologies, University of Rome Tor Vergata, 00133 Rome,
Italy
6 Department of Biology, University of Rome Tor Vergata, 00133 Rome, Italy
7 Institute of Chemical Kinetics and Combustion, 630090 Novosibirsk, Russian Federation
Correspondence
Barbara Biondi, Institute of Biomolecular Chemistry, Padova Unit, CNR, via Marzolo 1, 35131 Padova, Italy. Email: [email protected]
Funding Information
Part of this work was financially supported by the Russian Science Foundation, project # 15-15-00021, the Italian Ministry for Education. University and Research (PRIN 20157WW5EH), and the University of Rome Tor Vergata (Consolidate the Foundations, AMPSA).
8 9 10 11 12 13 14 15 16 17 18 19 20 21 22 23 24 25 26 27 28 29 30 31 32 33 34 35 36 37 38 39 40 41 42 43 44 45 46 47 48 49 50 51 52 53 54
Abstract
In this work, an extensive set of spectroscopic and biophysical techniques (including FT-IR absorption, CD, 2D-NMR, fluorescence, and CW/PELDOR EPR) was used to study the conformational preferences, membrane interaction, and bioactivity properties of the naturally occurring, synthetic 14-mer peptaibiotic chalciporin A, characterized by a relatively low (≈20%), uncommon proportion of the
strongly helicogenic Aib residue. In addition to the unlabeled peptide, we gained in-depth information from the study of two labeled analogs, characterized by one or two residues of the helicogenic, nitroxyl radical-containing TOAC. All three compounds were prepared using the SPPS methodology, which was carefully modified in the course of the syntheses of TOAC-labeled analogs in view of the poorly reactive α-amino function of this very bulky residue and the specific requirements of its free-radical side chain. Despite its potentially high flexibility, our results point to a predominant, partly amphiphilic, α-helical conformation for this peptaibiotic. Therefore, not surprisingly, we found an effective membrane affinity and a remarkable penetration propensity. However, chalciporin A exhibits a selectivity in its antibacterial activity not in agreement with that typical of the other members of this peptide class.
KEYWORDS
biological activity, chalciporin, conformation, membrane penetration, peptaibiotics
8 9 10 11 12 13 14 15 16 17 18 19 20 21 22 23 24 25 26 27 28 29 30 31 32 33 34 35 36 37 38 39 40 41 42 43 44 45 46 47 48 49 50 51 52 53 54
1 INTRODUCTION
The discoveryof bacteria resistant to drugshas important implications in modern medicinal chemistry. The isolation and characterization of new antibiotics, e.g. peptide antibiotics stable to enzymatic
degradation and exhibiting novel mechanisms of action, is imperative to help treat these infections.[1-12]
Peptaibiotics[13-25] are constituents of a family of naturally occurring, linear peptides, 4- to 21-amino acid residue long, with membrane and antibiotic activities, characterized by a very high percentage of the effective helix-supporting, Cα-tetrasubstituted Aib (α-aminoisobutyric acid) residue.[26-28] Their well known, relevant peculiarity for drug development (peptide bond stability in the presence of plasma enzymes) is strictly related to the multiple presence of this sterically highly hindered, quaternary amino acid[29-33] in the primary structure. Further stability to peptidase attack is provided by their acylated N-terminus and amidated C-terminus. Petaibiotics, produced by soil fungi, play a pivotal role during infection of the Boletus host by working synergistically with membrane degrading enzymes, thus allowing penetration of the cell wall which ultimately leads to tha invasion process. A commonly used classification of peptaibiotics, referring to how many amino acids occur in their primary structure, involves three subclasses: (i) long (17-21 residue) sequences,[13,20] (ii) medium-length (14-16 residue) sequences,[13,20] and (iii) short (4-11 residue) sequences. [17,18] Subclasses (i) and (ii) are Nα-acetylated, while subclass (iii) is Nα-fatty acylated.
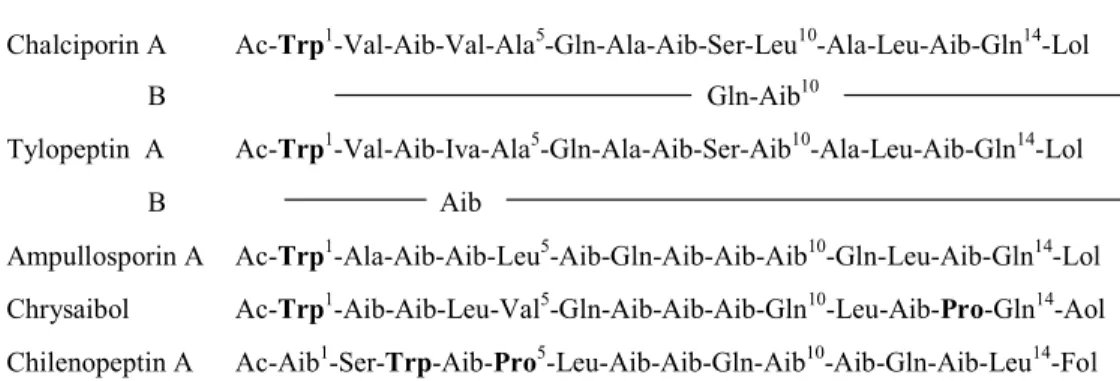
In the last few years, we have been particularly attracted by the medium-length compounds (ampullosporin,[34-36] tylopeptin, [37-40] and heptaibin[37,41]) mainly because, only this subclass of peptaibiotics has been poorly studied. A more in-depth inspection of their sequences revealed that some of them exhibit a useful property, namely the presence of a Trp residue at (or very near) the N-terminus. The side-chain indole moiety of this aromatic amino acid can be not only utilized as an excellent, intrinsic spectroscopic (fluorophoric) probe, but it has also been demonstrated to effectively promote anchoring of transmembrane peptides at the hydrophylic/hydrophobic interface. [42-55] The published amino acid sequences of the shortest (14-mer) peptaibiotics of this subclass containing a Trp residue[34-40, 56-58] are given in Table 1.
8 9 10 11 12 13 14 15 16 17 18 19 20 21 22 23 24 25 26 27 28 29 30 31 32 33 34 35 36 37 38 39 40 41 42 43 44 45 46 47 48 49 50 51 52 53 54
TABLE 1 Sequences of Known 14-Amino Acid Peptaibiotics Containing Trpa
Chalciporin A Ac-Trp1-Val-Aib-Val-Ala5-Gln-Ala-Aib-Ser-Leu10-Ala-Leu-Aib-Gln14-Lol B Gln-Aib10
Tylopeptin A Ac-Trp1-Val-Aib-Iva-Ala5-Gln-Ala-Aib-Ser-Aib10-Ala-Leu-Aib-Gln14-Lol B Aib
Ampullosporin A Ac-Trp1-Ala-Aib-Aib-Leu5-Aib-Gln-Aib-Aib-Aib10-Gln-Leu-Aib-Gln14-Lol Chrysaibol Ac-Trp1-Aib-Aib-Leu-Val5-Gln-Aib-Aib-Aib-Gln10-Leu-Aib-Pro-Gln14-Aol Chilenopeptin A Ac-Aib1-Ser-Trp-Aib-Pro5-Leu-Aib-Aib-Gln-Aib10-Aib-Gln-Aib-Leu14-Fol
aAc, acetyl; Aib, α-aminoisobutyric acid; Iva, isovaline; Aol, alaninol; Fol, phenylalaninol. All chiral
residues have the L-configuration. In addition to the characteristic Trp signature, also the non-helicogenic Pro residues occurring in some sequences are highlighted.
In this work, we focused on chalciporin A[56] because, in addition to Trp at position 1, its sequence is characterized by a potentially higher conformational flexibility (in its amino acid sequence only 3 foldameric Aib residues are present out of 14) as compared to those of other peptaibiotics given in Table 1, including ampullosporin[34,36] and tylopeptin B,[37-40] already investigated by our groups. In the only available paper on chalciporins A and B, isolated from a strain of the mycoparasitic Sepedonium
chalcipori, the authors described the sequences and chiralities of the constituent α-amino acids and of
the C-terminal 1,2 amino alcohol as well. Its good peptide solubility in the organic solvents commonly used for spectroscopic measurements and poor solubility in water were also reported. Here, we discuss the results of our detailed investigation of the synthetic wild-type peptide and two nitroxyl-containing analogs mono- and double-labeled at appropriate positions with TOAC (4-amino-1-oxyl-2,2,6,6-tetramethylpiperidine-4-carboxylic acid),[59-66] another α-amino acid member of the helicogenic Aib family. A large array of spectroscopic (FT-IR absorption, CD, 2D-NMR, fluorescence, and EPR) experiments and antibacterial activity assays were performed. The main purpose of this investigation was indeed to establish the role of the overall backbone 3D-structure of chalciporin A (flexibility vs. rigidity) and the presence at its N-terminus of the sequence of the aromatic Trp residue as well, in
Comment [N1]: Name? Reference?
8 9 10 11 12 13 14 15 16 17 18 19 20 21 22 23 24 25 26 27 28 29 30 31 32 33 34 35 36 37 38 39 40 41 42 43 44 45 46 47 48 49 50 51 52 53 54
comparison with those of the other members of the medium-length subclass of peptaibiotics, on membrane interaction and antibacterial activity.
2 EXPERIMENTAL
2.1 Synthesis and characterization
Fmoc (9-fluorenylmethyloxycarbonyl)-amino acids were obtained from Novabiochem (Merck Biosciences, La Jolla, CA). All other protected amino acids and reagents for peptide synthesis were
supplied by Sigma–Aldrich (St. Louis, MO). Assembly of peptides on the Advanced ChemTech (Louisville, KY) 348-Ω peptide synthesizer was carried out on a 0.05 mmol scale by the FastMoc methodology, beginning with the H-Lol-substituted 2-chlorotrityl resin (Iris Biotech, Marktredwitz, Germany) (110 mg, loading 0.44 mmol/g). The peptide was cleaved from the resin, filtered and collected. This step was repeated three times; then, the solution was concentrated under a flow of nitrogen. The crude peptides were purified by preparative RP-HPLC on a Vydac C18 column (22 × 250 mm, 10 µ, 300 Å) using a Shimadzu (Kyoto, Japan) LC-8A pump system equipped with a SPD-6A UV-detector (flow rate 15 ml/min, λ = 216 nm) and a binary elution system: A, H2O; B, CH3CN/H2O
(9 : 1 v/v); gradient 40–70% B in 30 min. The purified fractions were characterized by analytical RP-HPLC on a Vydac C18 column (4.6 × 250 mm, 5 µ, 300 Å) with a Dionex (Sunnyvale, CA) P680 HPLC pump and an ASI-100 automated sample injector. The binary elution system used was as follows: A, 0.05% TFA (trifluoroacetic acid) in H2O/ CH3CN (9:1 v/v); B, 0.05% TFA in CH3CN/H2O
(9:1 v/v); gradient 50–90% B in 30 min (flow rate 1.5 ml/min); spectrophotometric detection at λ = 216 nm. Electrospray ionization (ESI-MS) was carried out by use of a PerSeptive Biosystem Mariner
apparatus (Framingham, MA).
2.2 Antibacterial, antifungal,and hemolytic activities
Antibacterial and antifungal activities of chalciporin A were checked against positive and Gram-negative bacteria, and the fungus Candida as well, by the standardized disk diffusion Kirby–Bauer method[67] using the Müller–Hinton culture agar medium pH 7.2–7.4 [68] recommended by the National Committee for Clinical Laboratory Standards. Blank paper disks of 6-mm diameter (Macherey-Nagel 615, Germany), previously autoclaved and saturated with the peptide solution, were prepared. The peptide samples were dissolved in dimethylsulfoxide (DMSO) such as to give a 100 µg/disk solution. An inoculum of 0.5 McFarland was swabbed onto the test medium and dried at room temperature for
8 9 10 11 12 13 14 15 16 17 18 19 20 21 22 23 24 25 26 27 28 29 30 31 32 33 34 35 36 37 38 39 40 41 42 43 44 45 46 47 48 49 50 51 52 53 54
about 15 min. The peptide-impregnated disks were placed aseptically onto inoculated plates and incubated at 37°C. The results were read after 24 h of incubation by measuring the inhibition zones (in millimeters). The hemolytic activity was determined according to the method described by Yamada and Natori.[69] Briefly, a suspension of sheep erythrocytes, previously washed with phosphate buffer saline (PBS) solution, was incubated with an 1% DMSO solution of the peptide at five different concentrations (100, 50, 25, 12.5 and 6.25 µg/mL) at 37°C for two h. After centrifugation at 2000 g for five min, the absorbtion of the supernatant was measured at 576 nm. The 100% hemolysis was measured by incubation of the erythrocytes suspension in distilled water. An 1% DMSO solution in PBS (blank) was found not to be hemolytic.
2.3 FT-IR absorption
The FT-IR absorption curves were obtained at 293 K by use of a Perkin-Elmer model 1720X FT-IR spectrophotometer, nitrogen flushed, equipped with a sample-shuttle device, at 2 cm−1 nominal resolution, averaging 100 scans. Solvent (baseline) spectra were obtained under the same conditions. For spectral elaboration, the software SPECTRACALC from by Galactic (Salem, MA) was used. Cells with path lengths of 1.0 and 10 mm (with CaF2 windows) were employed. Spectrograde deuterated
chloroform (99.8%, d2) was a Merck (Darmstadt, Germany) product.
2.4 Circular dichroism
The CD curves were recorded on a Jasco (Tokyo, Japan) model J-715 spectropolarimeter equipped with a Haake thermostat (Thermo Fisher Scientific, Waltham, MA). Baselines were corrected by subtracting the solvent contribution. A fused quartz cell of 1.0 mm pathlength (Hellma, Mühlheim, Germany) was employed. The values are expressed in terms of [θ]T, the total molar ellipticity (deg ×
cm2 × dmol−1). Spectrograde methanol 99.9% (Acros Organic, Geel, Belgium) was employed as solvent. The CD experiments in 1-palmitoyl-2-oleyl-sn-glycero-3-phosphocholine (POPC) vesicles were performed out with a fused quartz cell of 0.5-mm pathlength (Hellma, Mühlheim, Germany).
2.5 Nuclear magnetic resonance
Samples for NMR spectroscopy were prepared in methanol (MeOH)-d3 solution (peptide concentrations: 1.2 mM). The spectrum was obtained at 298 K. All NMR experiments carried out using
a Bruker AVANCE DMX-600 spectrometer and the TOPSPIN software package. Presaturation of the H2O solvent signal was achieved by use of a WATERGATE gradient program. All homonuclear 8 9 10 11 12 13 14 15 16 17 18 19 20 21 22 23 24 25 26 27 28 29 30 31 32 33 34 35 36 37 38 39 40 41 42 43 44 45 46 47 48 49 50 51 52 53 54
spectra were acquired by collecting 512 experiments, each one consisting of 64–80 scans and 2 K data points. The spin systems of coded amino acid residues were identified using standard DQF-COSY[70] and CLEAN-TOCSY[71] spectra. In the latter case, the spin-lock pulse sequence was 70 ms long. ROESY experiments were utilized for sequence-specific assignment.[72] To avoid the problem of spin diffusion, the build-up curve of the volumes of NOE cross-peaks as a function of the mixing time (50– 500 ms) was obtained first (data not shown). The mixing time of the ROESY experiment used for interproton distance determination was 150 ms (i.e. in the linear part of the NOE build-up curve). Interproton distances were obtained by integration of the ROESY spectrum with SPARKY 3.111 software package.
2.6 Electron paramagnetic resonance
The two TOAC spin-labeled chalciporin A analogs were dissolved in a 95:5 (v/v) MeOH/ethanol (EtOH) mixture (both solvents from Ekros-Analytics, St. Petersburg, Russian Federation). The peptide concentrations were 1.0 ±0.1 and 1.4±0.1 mM. The solutions were placed in 2.9-mm o.d. EPR tubes, degassed, and sealed. The sample formed a transparent glass after shock freezing in liquid nitrogen. The room-temperature continuous-wave (CW) EPR experiments were carried out on an X-band Bruker E380 EPR spectrometer using a dielectric Bruker ER 4118 X-MD-5 cavity and an Oxford Instruments CF-935 cryostat for cooling. The cavity was cooled down to 90 K by use of gaseous nitrogen. The modulation amplitude was 0.05 mT, the modulation frequency 12.5 kHz, and the microwave power set to a level low enough to avoid spectra saturation. The low-temperature PELDOR experiments were
carried out on an X-band Bruker ELEXSYS E580 EPR spectrometer using a split-ring Bruker ER 4118 X-MS-3 cavity, which was cooled to 78 K. The 3-pulse PELDOR sequence was employed. The artifacts induced by overlapping of the detecting and pumping pulses in this sequence were removed on the basis of the protocol reported in ref. [73]. The experimental sequence was π/2A ̶ T ̶ πB ̶ (T ̶ τ) ̶ πA ̶
τ ̶ echo, where the subscripts A and B indicate the observing νA and pumping νB frequencies. The
position of the pumping pulse πB was scanned beginning from a negative delay d0 = -0.2 µs. The time delay τ was 1 µs in all experiments. A two-step phase cycling was employed to get rid of undesired
signals. The echo signal was integrated within the time gate of 60 ns. The duration of pulses at the observation frequency νA was 24 ns, their amplitudes were set to provide 90° and 180° pulse sequences
that were controlled by the echo lineshape. The length of the pumping pulse was 24 ns, its amplitude was set to invert the magnetization during the measurements with νB = νA, d0 = -0.2 µs. The observing 8 9 10 11 12 13 14 15 16 17 18 19 20 21 22 23 24 25 26 27 28 29 30 31 32 33 34 35 36 37 38 39 40 41 42 43 44 45 46 47 48 49 50 51 52 53 54
frequencies νA was set in all measurements to excite the spectral maximum and the (νA ̶ νB) frequency
difference in the PELDOR measurements was set at different values between 40 and 90 MHz.
MeOH, 99.9%, spectrophotometric grade, and [4-(2-hydroxyethyl)-1-piperazinyl]-1-ethanesulfonic acid (HEPES) were Sigma-Aldrich products. A 5 mM, pH 7.0, HEPES buffer solution was used with liposomes. POPC was obtained from Avanti Polar Lipids, Alabaster (AL) as a CHCl3 solution. EPR
spectra of chalciporin A analogs were recorded in MeOH and in POPC liposomes obtained in the manner used for CD experiments. The peptides were inserted in the liposomes as follows. A MeOH solution of the peptide was evaporated in an Eppendorf tube. The preformed liposomes were added.
Then, the solution was sonicated for 3 min. The peptide-to-lipid ratio was 1:20 and the peptide concentration was 10-4 M (the same for peptides in SUV and in MeOH). The room-temperature CW-EPR experiments were carried out by use of an ER200D spectrometer that operated at X-band (~9.5 GHz), equipped with a rectangular cavity, ER4102ST, fitted with a cryostat, and a variable-temperature controller, ER4111VT (all of them produced by Bruker BioSpin GmbH, Rheinstetten, Germany). The microwave frequency was obtained by use of a frequency counter, HP5342A. All spectra were
recorded using the following parameters: modulation amplitude 0.10 mT; modulation frequency 100 kHz; time constant 41 ms; conversion time 82 ms; scan width 1.50 mT; 1024 points; temperature 293 K. The spectra were averaged 25 times. The spectra in SUV and MeOH were simulated with a program based on the stochastic Liouville equation,[74] that is typically utilized for nitroxides.[75-78] The simulation method is based on several reference systems: the g and 14N hyperfine (A) tensors of the TOAC label are considered co-linear and their orientation relative to the rotational diffusion reference frame is determined by a set of Euler angles. However, in this work, we simplified the simulation approach using a single isotropic value (Diso) for the diffusion tensor. The rotational correlation times τ reported here are related to the diffusion tensor via the classic equation: τ =1/(6Diso). We performed a global fitting of the spectra letting the Diso and hyperfine tensors free to float. The principal values of the g tensor (gxx=2.0096, gyy=2.0064, gzz=2.0027) were obtained from the literature.[76]
2.7 Membrane penetration
Leakage from small unilamellar vesicles (SUV) induced by peptides was measured at 293 K by use of
5,6-carboxyfluorescein (CF)-entrapped vesicle technique[79] and a Perkin–Elmer model MPF-66 spectrofluorimeter. CF-encapsulated SUV of egg phosphatidylcholine (PC)/cholesterol (Ch) (7:3), and phosphatidylethanolamine (PE)/ phosphatidylglycerol (PG) (7:3), purchased from Avanti Polar Lipids, were obtained by sonication in HEPES buffer, pH 7.4. The phospholipid concentration was kept
8 9 10 11 12 13 14 15 16 17 18 19 20 21 22 23 24 25 26 27 28 29 30 31 32 33 34 35 36 37 38 39 40 41 42 43 44 45 46 47 48 49 50 51 52 53 54
constant (0.06 mM), and increasing peptide/lipid molar ratios (R-1) were achieved by adding dimethylsulfoxide aliquots solutions of peptides, while mantaining the final concentration below 5% by volume. After a rapid and vigorous stirring, the time course of fluorescence change corresponding to the CF escape was measured at 520nm (6 nm-band pass) with λexc 488 nm (3 nm-band pass). The percentage of released CF at time t was obtained as (Ft ̶ F0)/(FT ̶ F0) x 100, with F0 = fluorescence intensity of vesicles in the absence of peptide, Ft = fluorescence intensity at time t in the presence of peptide, and FT = total fluorescence intensity determined by disrupting the vesicles by addition of 50 µl of a 10% Triton X-100 solution. The kinetics experiments were stopped at 20 min.
The doxyl-labeled phospholipids [1-palmitoyl-2-stearoyl(n-doxyl)-sn-glycero-3-phosphocholine], with
n=7, 12, 14 and 16, and [1,2-dipalmitoyl-sn-glycero-3-phospho(TEMPO)choline] were purchased from
Avanti Polar Lipids, iodide potassium and sodium thiosulfate pentahydrate from C. Erba (Milan, Italy). Large unilamellar vesicles for water-membrane partition and quenching experiments were obtained by dissolving POPC lipids in a 1:1 (v/v) MeOH/CHCl3 solution. The solvents were evaporated under
reduced argon atmosphere until a thin film was formed. Complete evaporation was obtained by applying a rotary vacuum pump for at least 2 h. The lipid film was hydrated with a 10 mM phosphate buffer (pH 7.4) and 0.1 mM EDTA to the final lipid concentration. After rapid and vigorous stirring and 10 freeze and thaw cycles, the liposome suspension was extruded for 31 times through two stacked polycarbonate membranes (Avestin, Ottawa, ON, Canada) with pores of 100 nm. Lipid concentrations in the final samples were measured by the Stewart model.[80] Nitroxide-labeled liposomes were
obtained by adding the labeled lipids to the initial CHCl3 solution to a 2.5% molar content of
doxyl-labeled lipids. In this case, the lipid concentration of the stock solution was 1.3 mM. The extent of labeling of the nitroxide-containing lipids used for depth-dependent quenching investigations was
determined by double integration of the EPR spectra, both on the lipid stock solutions and the final liposome suspensions. Absorption curves were recorded on a V-770 (Jasco, Tokyo, Japan) spectrophotometer. Molar concentrations of chalciporin A were determined in MeOH solution at λ = 280 nm [Trp absorption, ε (280nm) = 5630 cm-1 M-1].[81] Fluorescence experiments were performed on a Fluoromax-4 fluorimeter (Horiba-Jobin Yvon, France), under the following conditions: λexc = 280
nm, λem = 290 - 500 nm, band pass: 3 nm in excitation, 5 nm in emission; integration time 0.1 s, peptide
concentration 1 µM; T = 25°C. Water–membrane partition experiments were performed by titrating a 1 µM peptide solution (in buffer B) with increasing amounts of a lipid vesicles solution and by following the variation in the emission intensity. The fluorescence intensity was integrated in the range 310 - 410 nm. The values obtained are the average of double experiments. Iodide quenching experiments were
8 9 10 11 12 13 14 15 16 17 18 19 20 21 22 23 24 25 26 27 28 29 30 31 32 33 34 35 36 37 38 39 40 41 42 43 44 45 46 47 48 49 50 51 52 53 54
carried out by titrating a 500 µM vesicle solution, containing 1 µM of chalciporin A, with aliquots of a solution containing 4 M KI and 10 mM Na2S2O3, prepared on the same day of the experiment.
Quenching of Ac-Trp-NH2(Ac, acetyl) in the absence of liposomes was also carried out for
comparison. The depth-dependent quenching measurementswere performed by adding the peptide to the different nitroxide-labeled liposomes (at a lipid concentration of 500 µM) and to a reference unlabeled liposome solution, and steady-state fluorescence intensities were assessed after a 10 min of equilibration period. The values obtained from the average of double experiments were reported.
3 RESULTS AND DISCUSSION
3.1 Peptide synthesis
For the solid-phase peptide synthesis (SPPS) of the medium-length, 14-mer peptaibiotic chalciporin, we employed the standard Fmoc/tert-butoxy (OtBu) approach.[82] Moreover, the preparation of two analogs, where one or two Aib residues are substituted by TOAC, also Cα-tetrasubstituted and achiral, are reported.
All syntheses were carried out on a leucinol (Lol)-substituted 2-chlorotrityl resin[83,84] with a checked loading of 0.44 mmol/g and with the tert-butyloxycarbonyl, trityl, and tert-butyl protections for the side chains of Trp, Gln, and Ser residues, respectively. For the synthesis of the native chalciporin A, the protein amino acids from Gln14 to Ala5 were introduced using the [2-(1H)-1,2,3-benzotriazolyl]-1,1,3,3-tetramethyluronium hexafluorophosphate (HBTU)/1-hydroxy-1,2,3-benzotriazole (HOBt) C-activation method,[85,86] while the double coupling with the more efficient [2-(1H)-7-aza-1,2,3-benzotriazolyl]-1,1,3,3-tetramethyluronium hexafluorophosphate (HATU) C-activation method[87] was employed when the poorly reactive Aib3,8,13 residues[88-90] were involved. All residues from Val4 to Trp1 were incorporated using the latter procedure. Finally, on-resin Nα-acetylation was obtained by use of AcOH preactivated with N-[3-(dimethylamino)-propyl]-N’-ethylcarbodiimide (EDC)/7-aza-1-hydroxy-1,2,3-benzotriazole (HOAt) [87] and N-methylmorpholine (NMM).
SPPS of the two analogs containing TOAC proved to be more difficult due to two additional problems:[59, 62-64] (i) the poor reactivity of the TOAC α-amino function, which severely hampers the
insertion of the next amino acid, and (ii) the negative influence to the nitroxide radical probe of the acidic conditions required for the final peptide cleavage from the resin and side-chain deprotection procedure. In these cases, neither the HATU nor the EDC/HOAt (in the presence of NMM) methodology was successful in the insertion of the bulkier β-branched Val2 residue on the very scarcely reactive α-amino group of the TOAC residue at position 3. This finding is in contrast with the less
8 9 10 11 12 13 14 15 16 17 18 19 20 21 22 23 24 25 26 27 28 29 30 31 32 33 34 35 36 37 38 39 40 41 42 43 44 45 46 47 48 49 50 51 52 53 54
bulky Leu12-TOAC13 coupling (the γ-branched Leu residue is less sterically hindered than Val). It is for this reason and for a closer comparison between the two analogs that we decided to replace Val4 with the still aliphatic but much less hindered Ala4 in the SPPS of both compounds (Table 2).
TABLE 2 Amino Acid Sequences of Chalciporin A and Its Two TOAC-Containing Analogs
Investigated in This Work
Chalciporin A Ac-Trp1-Val-Aib-Val-Ala5-Gln-Ala-Aib-Ser-Leu10-Ala-Leu-Aib-Gln14-Lol [Ala2, TOAC13]analog Ac-Trp1-Ala-Aib-Val-Ala5-Gln-Ala-Aib-Ser-Leu10-Ala-Leu-TOAC-Gln14-Lol [Ala2, TOAC3,13]analog Ac-Trp1-Ala-TOAC-Val-Ala5-Gln-Ala-Aib-Ser-Leu10-Ala-Leu-TOAC-Gln14-Lol
Cleavage of all 1,2-aminoalcohol C-terminated peptides from the resin was obtained by repeated use of
30% 1,1,1,3,3,3-hexafluoropropan-2-ol (HFIP) in CH2Cl2 solution.[84] The filtrates were collected,
concentrated in vacuo, and subjected to reaction with the TFA/triisopropylsilane (TIS)/water mixture
for removal of the side-chain protections.
Unfortunately, in the presence of TOAC residues, this latter, rather harsh, methodology converts the nitroxide free radical to its N-hydroxylated species.[59, 62-64] However, the recovery of the nitroxyl radical is readily achieved upon alkaline treatment with 1 M ammonium hydroxide for 180 min. The reaction was effectively checked by analytical HPLC since the free radicals and their hydroxylated species exhibit remarkably different retention times. The final proof for the regeneration of the free radical character was given by EPR spectroscopy. Even if we did not obtain a complete conversion of the hydroxylated species to the free radical (about 70%), we observed that an elongation of the reaction time did not increase the yield of the target peptide because of the concomitant formation of degradation products arising from the TOAC side-chain moiety. Using HPLC, we succeeded in purifying sufficient amounts of the wild-type, mono-labeled TOAC mono-radical, and double-labeled TOAC double-radical chalciporin A peptides, to be subsequently used for our physico-chemical, biophysical, and biological studies. Mass spectral analyses of each purified chromatographic fraction (Table 3) confirmed our structural assignments.
8 9 10 11 12 13 14 15 16 17 18 19 20 21 22 23 24 25 26 27 28 29 30 31 32 33 34 35 36 37 38 39 40 41 42 43 44 45 46 47 48 49 50 51 52 53 54
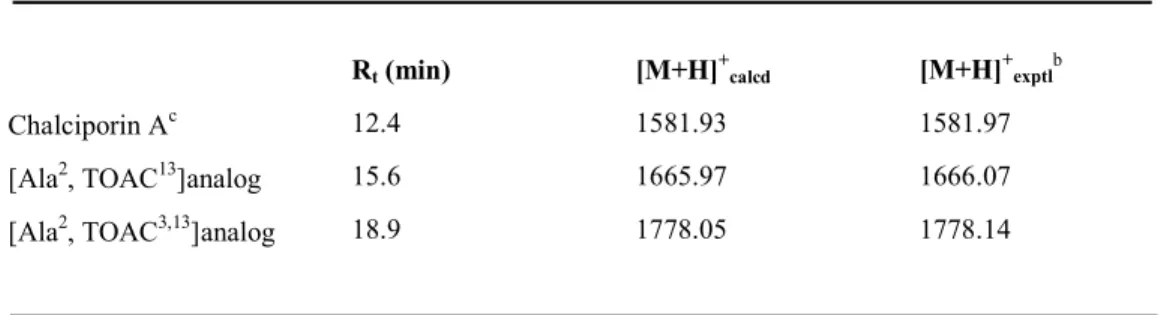
TABLE 3 RP-HPLC Retention Timesa and ESI-MS Data for Chalciporin A and the Two TOAC Analogs Synthesized in This Work
Rt (min) [M+H]+calcd [M+H]
+ exptlb
Chalciporin Ac 12.4 1581.93 1581.97
[Ala2, TOAC13]analog 15.6 1665.97 1666.07 [Ala2, TOAC3,13]analog 18.9 1778.05 1778.14
aRetention times (R
t) for the synthetic peptides obtained from RP-HPLC.
bMolecular weights for the synthetic peptides experimentally determined by ESI-MS spectrometry. cSee also ref.[56]
3.2 Antibacterial, antifungal, and hemolytic activities
The antimicrobial activity assays of chalciporin A were performed using standard strains or clinical isolates of Gram-positive and Gram-negative bacteria, and of the fungus Candida.
TABLE 4 Antibacterial and Antifungal Activities of Chalciporin A
Bacterial strain Gram-type I. D. (mm)a
Streptococcus pyogenes ATCCb 19615 + 9
Streptococcus agalactiaec
+ 8
Staphylococcus aureus ATCC 25923 + 0
Enterococcus faecalis ATCC 29212 + 8
Escherichia coli ATCC 25922 - 8
Enterobacter aerogenes ATCC 13048 - 0
Shigella sonnei ATCC 25931 - 0
Salmonella typhimurium ATCC 14028 - 0
Acinetobacter baumannii complexc - 0
8 9 10 11 12 13 14 15 16 17 18 19 20 21 22 23 24 25 26 27 28 29 30 31 32 33 34 35 36 37 38 39 40 41 42 43 44 45 46 47 48 49 50 51 52 53 54
Fungal strain I. D. (mm)
Candida albicans ATCC 10231 0
Candida glabratab 0
aInhibition diameter; bAmerican Type Culture Collection; cClinical isolate.
As reported in Table 4, we found that this peptaibiotic exhibits antibacterial activity by inhibiting mainly the growth of Gram-positive bacteria (a standard strain and a clinical isolate of Streptococcus, and a standard strain of Enterococcus faecalis). Moreover, it is also active against a Gram-negative standard strain of Escherichia coli. No antifungal activity was detected against the two strains of the fungus Candida selected for this study. The antimicrobial activity against Gram-positive bacteria and fungi is a property typically exhibited by peptaibiotics.[13,16-19,91-93] However, the surprising lack of activity against the Gram-positive Staphylococcus aureus ATCC 25923 and the observed activity againstthe Gram-negative Escherichia coli ATCC 25922 clearly support the view that the Gram-type is not a decisive parameter for the antibacterial activity of chalciporin A. Overall, these results point to an intriguing, only partly selective, mixed type of antibacterial behavior for chalciporin A. Any conclusive explanation for its mechanism of action should also take into consideration that Gram-staining is essentially determined by the nature of the cell wall peptidoglycans, whereas chalciporin A exerts its action by modifying the integrity of the cell membrane lipid bilayer.
We also checked the extent of cytotoxicity generated by chalciporin A and found that it is hemolytic at high concentration (>25 µg/mL), in the same range as that used for the antibacterial assays, while at lower concentrations (≤ 12.50 µg/mL) its toxicity is reduced to the level of the blank. This finding suggests that the use of chalciporin A as an antibacterial needs further investigations. Our current aim is to develop new analogs with selectively incorporated positive charges (e.g., Lys residues) showing a significantly enhanced antibacterial/hemolytic ratio, as we already did with the peptaibiotic trichogin GA IV.[94]
3.3 Conformational analysis
A detailed investigation on the 3D-structure of chalciporin A and its two TOAC-containing analogs was performed by use of a combination of FT-IR absorption, CD, 2D-NMR, fluorescence, and EPR
spectroscopies under different experimental conditions.
In CDCl3, a solvent of limited polarity, and in the conformationally sensitive N ̶ H stretching (amide A)
region (3450-3200 cm-1),[95-98] a very intense absorption maximum is shown in the FT-IR absorption
8 9 10 11 12 13 14 15 16 17 18 19 20 21 22 23 24 25 26 27 28 29 30 31 32 33 34 35 36 37 38 39 40 41 42 43 44 45 46 47 48 49 50 51 52 53 54
spectrum at about 3300 cm-1 by all three chalciporin A compounds (Figure 1). We assigned this band to NH vibrators of strongly H-bonded peptide groups (the corresponding band for classical intramolecularly H-bonded, helical structures is typically seen near 3330 cm-1).[97,98] The stability of this 3D-structure is further certified by the absence of any significant spectral change upon a 10-time dilution. A very weak absorption associated to solvated N ̶ H vibrators of the N-terminal peptide groups not partecipating in intramolecular H-bonds is also present in the spectra near 3410 cm-1. In conclusion, in dilute CDCl3, the preferred conformation of chalciporin A and its analogs, rich in the strongly helix- forming Cα-tetrasubstituted α-amino acids Aib[26-28] and TOAC,[59-61, 66] is significantly folded and remarkably supported by intramolecular C=O···H ̶ N H-bonds. Analogous results were recently reported for the 14-mer peptaibiotics heptaibin[41] and tylopeptin B.[39]
3450 3400 3350 3300 3250 3200 Ab s o rb a n c e wavenumbers (cm-1)
FIGURE 1 FT-IR absorption spectra in the in the N ̶ H stretching region of [Ala2, TOAC13] chalciporin A in CDCl3 solution at 0.5 mM (full line) and 0.05 mM (dashed line) peptide concentrations.
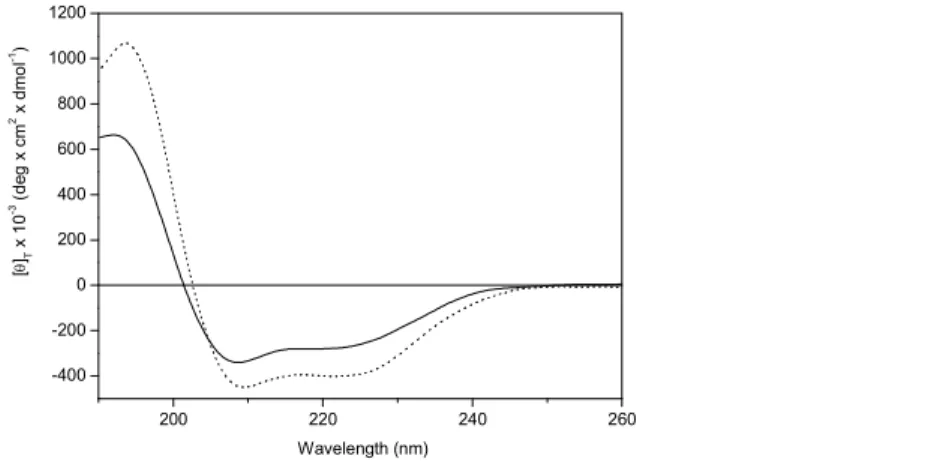
The shape of the far-UV CD spectra of chalciporin A and the two labeled analogs in methanol (MeOH) and POPC vesicles is similar, in that they show two negative peaks positioned at 222-224 nm and 208-209 nm of moderate intensities accompanied by a stronger positive band at about 190 nm (Figure 2). They are assigned to the n→π* transition, and to the parallel and perpendicular components of the π →π* transition of the peptide chromophores, respectively.[99-101] This spectroscopic signature is typically exhibited by right-handed, predominantly helical peptides. As in tylopeptin B and its analogs,[39] the side-chain indole aromatic chromophore of the potentially partially fraying N-terminal Trp residue[100,101] and the TOAC nitroxyl chromophores[61,66] do not seem to contribute significantly to
8 9 10 11 12 13 14 15 16 17 18 19 20 21 22 23 24 25 26 27 28 29 30 31 32 33 34 35 36 37 38 39 40 41 42 43 44 45 46 47 48 49 50 51 52 53 54
the CD spectra. The general observation that a membrane-mimetic environment (POPC vesicles) would induce the onset of a helix CD spectrum is common to most types of peptide molecules. In the specific case of the peptides (characterized by about 20% of helix-inducing Cα-tetrasubstituted α-amino acids) discussed here, this finding is even less surprising. A decision on the type of helix (whether 310-[102,103]
or α-) can be easily obtained by determining the ratio (R) of the intensities of the two negative Cotton effects near 222 and 208 nm.[104,105]In the spectra shown in Figure 2 the R values are 0.86 for MeOH and 0.96 for POPC vesicles. Since typical R values for a fully developed α-helix are close to 1.0 and for a fully developed 310-helix are equal to or below 0.4, these results clearly point to a largely
predominant α-helix (over the 310-helix) structure for this 14-mer peptaibiotic under these experimental
conditions, in agreement with our published data on the closely related compounds (Table 1) tylopeptin B[39] and ampullosporin A.[35,36] 200 220 240 260 -400 -200 0 200 400 600 800 1000 1200 Wavelength (nm) [ θ ]T x 1 0 -3 ( d e g x c m 2 x d m o l -1)
FIGURE 2 Far-UV CD spectra in the 190-260 nm region of chalciporin A in MeOH (full line), and
POPC vesicles (dotted line). Peptide concentration: 0.1 mM.
From 2D-NMR study, we obtained a more in-depth view on the conformational preference of chalciporin A in MeOH-d3 solution. The assignments of the C ̶ H and N ̶ H proton resonances were established on the basis of the Wüthrich procedure.[106] The complete assignment of the proton resonances is reported in Table S1.
8 9 10 11 12 13 14 15 16 17 18 19 20 21 22 23 24 25 26 27 28 29 30 31 32 33 34 35 36 37 38 39 40 41 42 43 44 45 46 47 48 49 50 51 52 53 54
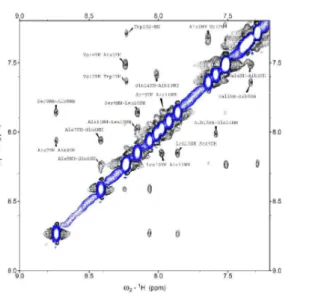
FIGURE 3 Amide NH proton region of the ROESY spectrum of chalciporin A in MeOH-d3 solution. Peptide concentration: 1.2 mM.
FIGURE 4 Fingerprint region of the ROESY spectrum of chalciporin A in MeOH-d3 solution. Peptide concentration: 1.2 mM. CαHi→NHi+2, CαHi→NHi+3, and CαHi→NHi+4, cross peaks are highlighted in red, green and blue, respectively.
8 9 10 11 12 13 14 15 16 17 18 19 20 21 22 23 24 25 26 27 28 29 30 31 32 33 34 35 36 37 38 39 40 41 42 43 44 45 46 47 48 49 50 51 52 53 54
The ROESY spectrum of chalciporin A highlighted the presence of all of the NHi–NHi+1 sequential
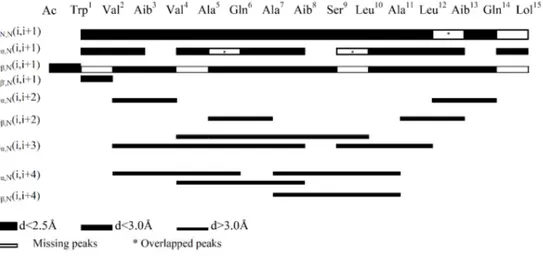
cross peaks, which indicate the presence of a helical structure (Figure 3), confirming the information obtained from FT-IR absorption and CD experiments. The ROESY fingerprint region showed most of the CαHi→NHi+3 (in green) cross peaks and three well resolved CαHi→NHi+4 (in blue) connectivities typical of the α-helical conformation (Figure 4). Moreover, some CβHi→NHi+2 and CβHi→NHi+4 cross peaksare obtained from the ROESY spectrum (Figure S1). A complete overview of conformationally relevant ROESY connectivities is reported in Figure 5.
FIGURE 5: Summary of the significant interresidue ROESY cross peaks for chalciporin A in MeOH- d3. Peptide concentration: 1.2 mM.
The chalciporin A amphiphilic properties, although partial, stand out clearly in Figure 6, with the three hydrophilic residues (Gln6, Ser9, Gln14) position on the same side of the α-helix.
8 9 10 11 12 13 14 15 16 17 18 19 20 21 22 23 24 25 26 27 28 29 30 31 32 33 34 35 36 37 38 39 40 41 42 43 44 45 46 47 48 49 50 51 52 53 54
FIGURE 6. Representations of chalciporin A in the α-helical conformation (Left: side-view; Right:
top-view).
The CW EPR spectra for the two TOAC-containing chalciporin A analogs are shown in Figure 7. These curves are typical for a mono-nitroxide radical. As the spectra in MeOH/EtOH are not noticeably broadened, one may conclude that aggregation of peptides is not taking place. In addition,
intramolecular dipole···dipole interactions between the two labels in the double-TOAC-labeled analog
are too weak to increase the EPR linewidth. Analogous results were already reported for the related peptaibiotic tylopeptin B in a very similar environment.[37]
335 340 345 350 355 360
2
B0, mT
1
FIGURE 7 CW EPR spectra in frozen glassy MeOH/EtOH solution at 90 K for the
mono-TOAC-labeled chalciporin A analog [Ala2, TOAC13] (curve 1) and the double-labeled analog [Ala2, TOAC3,13] (curve 2). Gln14 Gln6 Ser9 8 9 10 11 12 13 14 15 16 17 18 19 20 21 22 23 24 25 26 27 28 29 30 31 32 33 34 35 36 37 38 39 40 41 42 43 44 45 46 47 48 49 50 51 52 53 54
Original PELDOR time traces are shown in a semi-logarithmic plot in Figure 8 for the mono- and double-TOAC-labeled chalciporin A analogs [when (νA-νB)=70 MHz]. The linear T-dependence of
the data for the mono-TOAC-labeled highlights the random, homogeneous distribution of the spin labels in the sample.[107] The slope depends on both the excitation parameter of the pumping pulse and the spin label concentration. For this compound, the calculated value (see ref. [35] for details) of the excitation parameter pB was found to be pBcalcd=0.31±0.01, which is quite close to the experimental
one, exptl =0.29±0.03
B
p .
For the double-TOAC-labeled analog the PELDOR time trace is typical for a biradical: the fast initial decay is replaced by a slow decay at longer T. Theory predicts that the fast decay is caused by strong intramolecular interactions, while the slow decay is due to weak intermolecular interactions. These interactions are independent, so that the total PELDOR time trace V(T) is extractedfrom their multiplication: V(T)=VINTRA(T)VINTER(T). The asymptotic curves of the PELDOR time trace is different from that of the mono-TOAC-labeled analog. It is approximated by a third-order polynomial [curve 3 in Figure 8(a)]. The reason for this divergence may be related to a slight repulsion between the peptide molecules of the double-TOAC-labeled analog because of a somewhat enhanced concentration. Subtraction of curve 3 from curve 2 in Figure 8(a) allows obtaining the pure intramolecular time trace [shown in Figure 8(b)].
The strength of the intermolecular interaction, denoted as λ, depends on the pB excitation value. For the double-TOAC-labeled analog, within experimental uncertainty, it concurs with the calculated
one: tl tl B calcd B p p 0.32 0.01 exp 0.335 0.037 1 exp λ − = ± = ≈ ±
= . The good agreement of the calculated and experimental values and the exponential PELDOR decay observed for the mono-labeled peptide analog point to the absence of peptide micellization in MeOH.
8 9 10 11 12 13 14 15 16 17 18 19 20 21 22 23 24 25 26 27 28 29 30 31 32 33 34 35 36 37 38 39 40 41 42 43 44 45 46 47 48 49 50 51 52 53 54
0.0 0.2 0.4 0.6 0.8 1.0 -0.9 -0.8 -0.7 -0.6 -0.5 -0.4 -0.3 -0.2 -0.1 0.0 3 2 ln (V (T )/ V I (0 )) T, µs 1 a 0.0 0.2 0.4 0.6 0.8 1.0 b ln(λ) ln (V IN T R A (T )/ V IN T R A (0 )) T, µs -0.4 -0.3 -0.2 -0.1 0.0
FIGURE 8 (a) Three-pulse PELDOR time traces for the mono-TOAC-labeled chalciporin A analog [Ala2, TOAC13] (curve 1) and the double-TOAC-labeled analog [Ala2, TOAC3,13] (curve 2). Curve 3 shows the intermolecular contribution in the PELDOR time trace. (b) The pure VINTRA(T) contribution,
obtained by subtracting curve 3 from curve 2 in (a).
The normalized intramolecular time trace contribution is determined as
) ( ) 0 ( ) ( ) ( ) ( ∞ − ∞ − = INTRA INTRA INTRA INTRA INTRA n V V V T V T V ,
where VINTRA(∞) is the asymptotic value at large T [Figure 8(b)]. These normalized time traces are
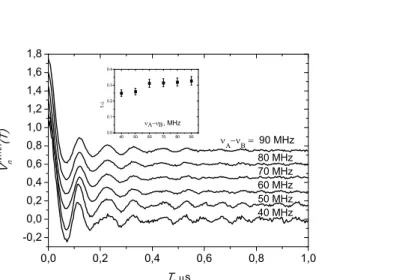
plotted in Figure 9 for different (νA-νB) values between the detecting and pumping frequencies. The slight discrepancies observed both in the time traces and modulation depths at different (νA-νB) values indicate a slight orientation selectivity in the PELDOR effect. The orientation selectivity can be reduced by averaging the data for all orientations.[108] Figure 10 illustrates the Fourier transforms of the time traces reported in Figure 9, along with the averaged ones. The well-resolved Pake-like patterns illustrated here demonstrate that the distance distribution between the spin labels is narrow.
8 9 10 11 12 13 14 15 16 17 18 19 20 21 22 23 24 25 26 27 28 29 30 31 32 33 34 35 36 37 38 39 40 41 42 43 44 45 46 47 48 49 50 51 52 53 54
0,0 0,2 0,4 0,6 0,8 1,0 -0,2 0,0 0,2 0,4 0,6 0,8 1,0 1,2 1,4 1,6 1,8 40 50 60 70 80 90 0.0 0.1 0.2 0.3 0.4 1 -λ νΑ−νΒ, MHz V IN T R A n (T ) T, µs ν Α−νΒ = 90 MHz 80 MHz 70 MHz 60 MHz 50 MHz 40 MHz
FIGURE 9 Normalized intramolecular PELDOR time traces for the double-TOAC-labeled chalciporin A analog at different (νA-νB) separations. For convenience, each data set is shifted upward by 0.2. The inset shows the modulation depth at different (νA-νB) values.
-25 -20 -15 -10 -5 0 5 10 15 20 25 -2 0 2 4 6 8 10 12 14 16 18 20 40 MHz 50 MHz 60 MHz 70 MHz 90 MHz 80 MHz S p e c tr a l d e n s it y , M H z -1 Frequency, MHz averaging
FIGURE 10 Frequency-domain PELDOR spectra extracted from cosine Fourier transformations of the data shown in Figure 9 for the double-TOAC-labeled analog. For convenience, all spectra are shifted upward by 2. The averaged spectrum is added on the top.
8 9 10 11 12 13 14 15 16 17 18 19 20 21 22 23 24 25 26 27 28 29 30 31 32 33 34 35 36 37 38 39 40 41 42 43 44 45 46 47 48 49 50 51 52 53 54
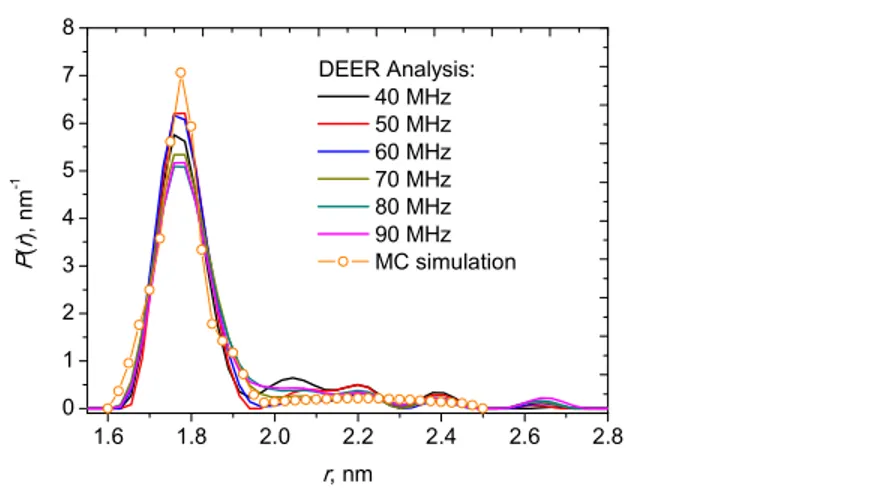
The distance distribution function was obtained by two methods: (i) using the PELDOR Analysis 2006 software,[109] in which the regularization parameter was chosen in the L-curve to avoid over-smoothing at short distances, and (ii) Monte Carlo simulations of the averaged curve.[35,110] The results are given in Figure 11. In the Monte Carlo approach, a weak peak at long distances was approximated by a broad Gaussian line. Both approaches provide similar data: a main narrow peak centered at 1.76 ± 0.01 nm with half-width at half-height of 0.065 ± 0.005 nm, accompanied by small broad peaks at longer distances. The total contribution of the main peak is about 90 %.
1.6 1.8 2.0 2.2 2.4 2.6 2.8 0 1 2 3 4 5 6 7 8 DEER Analysis: 40 MHz 50 MHz 60 MHz 70 MHz 80 MHz 90 MHz MC simulation P (r ), n m -1 r, nm
FIGURE 11 Calculated distance distribution function from data at different (νA-νB) values obtained by the PELDOR Analysis 2006 software (solid curves) and Monte Carlo simulations (circles) for the double-TOAC-labeled chalciporin A analog.
At this point, it is interesting to compare the distance distribution function presented in Figure 11 with our data for the peptide antibiotic tylopeptin B, double-TOAC-labeled at the same chain positions (3, 13).[37] The sequences of tylopeptin B and chalciporin A differ by two amino acids only: Aib instead of Val at the 4th position and Aib instead of Leu at the 10th position, for tylopeptin B and chalciporin A, respectively. In both cases, the peak position (1.76 nm) and the half-width at half-height (0.07 nm) are the same, which we assign to the α-helix conformation.[111] Therefore, the double amino acid replacement does not influence the nature of the major peptide conformation. However, while tylopeptin B was found only in the α-helix conformation, the broad peak at a longer interspin distance (2.1-2.2 nm) in Figure 11 for chalciporin A most likely corresponds to a modest admixture (~10%) of
8 9 10 11 12 13 14 15 16 17 18 19 20 21 22 23 24 25 26 27 28 29 30 31 32 33 34 35 36 37 38 39 40 41 42 43 44 45 46 47 48 49 50 51 52 53 54
more elongated conformations. The observed conformational flexibility of chalciporin A higher than
that of tylopeptin B is not surprising considering that two out of five of the effectivehelix-former, Cα -tetrasubstituted Aib residues[26-28] in the amino acid sequence of tylopeptin B are missing in that of chalciporin A. In this work, the three-pulse PELDOR method was primarily employed for investigating in detail the conformation of the double-TOAC-labeled chalciporin A analog. The PELDOR data allowed us to conclude that the main portion (90 %) of the molecules of this compound occurs in the α-helix conformation with an interspin distance of 1.76 ± 0.01 nm and a half-width at half-height of 0.065 ± 0.005 nm.
3.4 Membrane penetration
We initially tested the interactions of chalciporin A and its two mono-labeled [Ala2, TOAC13] and double-labeled [Ala2, TOAC3,13] analogs with membranes and compared them with those of our reference peptaibiotic trichogin GA IV,[17,18,91] by determining the induced leakage of the fluorescent probe CF entrapped in PC/Ch and PE/PG SUVs (Figure 12).
0 100 200 300 400 500 0 20 40 60 80 100 % C F R-1 103
FIGURE 12 Peptide induced CF leakage at 20 min for different R-1=[peptide]/[lipid] for 7:3 PC/Ch vesicles (A) and 7:3 PE/PG (B) vesicles for trichogin (̶ ■̶ ), chalciporin A (̶●̶ ), and its mono-labeled [Ala2, TOAC13] (̶ ○ ̶) and double-labeled [Ala2, TOAC3,13] (̶ □ ̶ ) analogs.
The PC/Ch SUVs are used to mimic eukaryotic membranes, whereas PE/PG SUVs closely simulate the membranes of Gram-negative bacteria. The sigmoidal shape of the plots supports the view that the permeability mechanism is cooperative to a large extent. All three compounds exhibit a significant
activity in both environments. In particular, synthetic, unlabeled chalciporin A is in general slightly
A 0 100 200 300 400 500 0 20 40 60 80 100 % C F R-1103 B 8 9 10 11 12 13 14 15 16 17 18 19 20 21 22 23 24 25 26 27 28 29 30 31 32 33 34 35 36 37 38 39 40 41 42 43 44 45 46 47 48 49 50 51 52 53 54
more effective than trichogin GA IV. When incorporation of a single TOAC residue (in the C-terminal segment of chalciporin A) is examined, the activity of the peptaibiotic is reduced, but only to a limited extent. This result is not unexpected considering the well known similar conformational preferences of peptides having Aib and TOAC residues.[59-61,66] The most interesting results are observed for the double-TOAC-labeled analog. This compound, being the most effective in membrane permeability of the PC/Ch SUVs, but the least effective in PE/PG SUVs, is therefore membrane-selective. Moreover, these data point to the N-terminal segment (position 3) of the peptide backbone as the key region for the modulation of the membranolytic activity.
Chalciporin A association to membranes was examined by measuring the change of its Trp fluorescence intensity upon increasing concentration of unilamellar POPC liposomes (Figure 13A). The observed substantial enhancement is indicative of an effective membrane binding. [48,112] This finding is not unexpected considering of the overall high hydrophobicity of chalciporin A and the extensively reported ability of an exposed Trp residue to act as a hook for a peptide at an aqueous/membrane interface.[42-55] The binding curve is comparable to those reported previously for fluorescent analogs of trichogin GA IV (although in membranes of different composition[113,114]) and is consistent with the similar membrane-perturbing properties reported above.
To investigate the depth of insertion of chalciporin A in the bilayer, we initially determined Trp accessibility using iodide anion as a water-soluble quencher. Figure 13B describes the effect of
enhancing concentration of I- on the fluorescence of the peptide and of the classical model compound Ac-Trp-NH2 (NATA), taken as a control for a completely accessible fluorophore. The much higher
slope observed for NATA in these Stern-Volmer plots indicates that the Trp residue in chalciporin A has a very low water exposure and is considerably inserted into the membranes.[115] However, it should be noted that a modest quenching is taking place, suggesting that the fluorophore is not completely buried in the hydrophobic environment.
More information on the mode of chalciporin A interaction with liposomes was obtained from further study of depth-dependent Trp fluorescence quenching with lipids characterized by a nitroxide radical (doxyl) moiety at five diverging distances from the bilayer center.[35,36,39,48,59,112,116] Rather surprisingly, the results obtained (not shown) indicate the degree of fluorescence quenching as almost independent from the quencher position in the lipid chain, with a slightly more pronounced effect (but within experimental error) when the quencher is positioned near the bilayer surface. A much stronger depth dependence is usually observed with cationic peptides, which attain a well defined position on the membrane surface.[117] For fluorescent analogs of the short peptaibiotic trichogin GA IV, we
8 9 10 11 12 13 14 15 16 17 18 19 20 21 22 23 24 25 26 27 28 29 30 31 32 33 34 35 36 37 38 39 40 41 42 43 44 45 46 47 48 49 50 51 52 53 54
previously observed a bimodal distribution corresponding to both surface bound and inserted states.[118] By contrast, the quenching efficiency was found to be completely independent of the depth of the quencher position for fluorescent analogs of the long peptaibiotic alamethicin in the absence of transmembrane potential.[119] Chalciporin A seems to have an intermediate behavior. On the basis of these data, we are inclined to conclude that the Trp-containing N-terminus of the peptide may be able to reach diverse depths in the interior of the membrane bilayer.
FIGURE 13 (A) Variation of fluorescence intensity (integrated in the range 310-410 nm) of chalciporin A in the presence (F) and absence (F0) of unilamellar POPC liposomes. Peptide
concentration: 1 µM. (B) Stern-Volmer plots of the I- induced fluorescence quenching for chalciporin A (full line) and the model compound Ac-Trp-NH2 (dashed line) in the presence of 0.5 mM POPC
liposomes. Peptide concentration: 1 µM.
In our final study on membrane penetration, we recorded the CW EPR spectra for the mono-labeled [Ala2, TOAC13] chalciporin A analog in MeOH and POPC SUVs and the spectrum of the double-labeled [Ala2, TOAC3,13] analog in SUVs at 293 K and at low microwave power (2 mW) (Figure 14). The parameters for the [Ala2, TOAC13] analog are reported in Table 5.
A B 8 9 10 11 12 13 14 15 16 17 18 19 20 21 22 23 24 25 26 27 28 29 30 31 32 33 34 35 36 37 38 39 40 41 42 43 44 45 46 47 48 49 50 51 52 53 54
332 334 336 338 340 342 344 346 [Ala2 , TOAC13 ] analog (POPC SUV) [Ala2 , TOAC3,13 ] analog (POPC SUV) Magnetic Field /mT [Ala2 , TOAC13 ] analog (MeOH)
Figure 14 CW EPR spectra (black lines) and simulations (grey lines) of the two TOAC-labeled chalciporin A analogs. Peptide concentration: 0.1 mM; lipid concentration: 2 mM; T = 293K.
TABLE 5 Parameters Obtained from the Fitting of the EPR Spectra for the Mono-Labeled [Ala2,TOAC13] Chalciporin A Analoga
Hyperfine tensor /mT Diffusion tensor
/MHz
Correlation time /ns
Axx Ayy Azz Diso τ
MeOH 0.50 0.56 3.55 223.8 0.74
POPC SUV bound 0.50 0.61 3.51 14.1 11.8 unbound 0.51 0.68 3.68 794.3 0.21
aThe g tensor for all simulations is g
xx = 2.0096; gyy = 2.0064; gzz = 2.0027. 8 9 10 11 12 13 14 15 16 17 18 19 20 21 22 23 24 25 26 27 28 29 30 31 32 33 34 35 36 37 38 39 40 41 42 43 44 45 46 47 48 49 50 51 52 53 54
The simulations provided insights on the rotational dynamics of the compounds, expressed by the diffusion tensor D. The dynamics are more appropriately discussed using the rotational correlation time[120]: τ= , where Diso is the diffusion tensor for an isotropic rotational motion. From the simulations, we also obtained the principal values of the hyperfine tensor A, the Azz component of
which reflects the environment polarity experienced by the nitroxide.
Figure 14 (top) shows the spectrum of the mono-labeled [Ala2, TOAC13] chalciporin A analog in MeOH at 293 K (peptide concentration: 0.1 mM). It presents a single component with three lines (∆Bpp
= 0.29 mT), typical of a TOAC nitroxide in relatively fast motion (τ= 0.74 ns) (Table 5). On the contrary, the spectrum of this compound in POPC SUVs (Figure 14, middle) is the sum of two contributions: three sharp lines (∆Bpp = 0.15 mT) are indicative of a fast moving nitroxide (τ = 0.21 ns),
attributed to unbound peptide molecules in aqueous buffer solution, while the broader lineshape points to a relatively slow nitroxide motion (τ = 11.8 ns), which we associate to peptide molecules bound to the phospholipid bilayer. The Azz value of the bound component, 3.51 mT, is significantly lower than
that of the unbound component, 3.68 mT, confirming that the nitroxide is surrounded by an apolar environment. The presence of two components implies that the rate of exchange between the membrane and the aqueous solution is very slow on the EPR timescale, slower than hundreds of microseconds. From the areas of the two simulations, we calculated that 96% of the peptide interacts with the membrane. The spectrum of the double-labeled [Ala2, TOAC3,13] analog (Figure 14, bottom) could not be reliably simulated, likely due to the different contributions of the two TOAC labels to the overall lineshape. Nevertheless, it is possible to observe that this analog as well exhibits a great affinity for the POPC bilayer, with an estimated binding percentage >95%.
8 9 10 11 12 13 14 15 16 17 18 19 20 21 22 23 24 25 26 27 28 29 30 31 32 33 34 35 36 37 38 39 40 41 42 43 44 45 46 47 48 49 50 51 52 53 54
4 CONCLUSIONS
With the support of two TOAC-labeled analogs, our unprecedented approach,involving a very large set of spectroscopic and biochemical techniques, was exploited to unveil the 3D-structural preferences of
the medium-length peptaibiotic chalciporin A, potentially less rigid than the other members of this subclass, and to investigate its behavior in a membrane environment and its antibacterial activity. Specifically, we found that this compound is characterized by some flexibility as it is largely, but not completely, folded in an α-helix: 10% of the chalciporin A molecules are found to be more elongated than an α-helix, either possibly folded in the 310-helix,[102,103] a consecutive stretch of type-III β-turns,[121-123] or adopting an extended conformation. The general observation of a large majority of α-helical rather than 310-helical molecules in these 14-mer peptides is not unexpected considering the
well established main-chain length dependence of peptides heavily based on Cα-tetrasubstituted α-amino acids,[102,103] the α-helix stability of which becomes critically higher than that of the 310-helix
when the number of amino acids in the primary structure in the sequence exceeds seven or eight.[124]
We have also clearly established that both the (partial) amphiphilic helical character and the presence of the N-terminal Trp residue of chalciporin A are responsible to a significant extent for its good affinity to model membranes and a remarkable ability of membrane penetration. Nevertheless, the reason for the observed uncommon selectivity in antibacterial activity remains to be fully understood. In summary, this first step of our chalciporin A investigation has offered useful hints for our future exploration of further, appropriately designed, synthetic analogs of this promising peptide-based platform aiming at the production of novel antibacterial materials.
AUTHORSHIP CREDITS
B. Biondi and C. Pignaffo were responsible for the solid-phase peptide syntheses and chemical characterizations. C. Peggion and M. De Zotti recorded and discussed the FT-IR absorption, CD and 2D-NMR spectra. S. Oancea and G. Hilma tested the antibacterial, antifungal, and cytotoxic activities. A. Bortolotti, L. Stella, and J. Z. Pedersen investigated and discussed the membrane penetration properties by fluorescence experiments. A. Dalzini and M. Bortolus carried out the CW-EPR study and interpreted the results in liposomes. V. N. Syryamina, Yu. D. Tsvetkov, and S. Dzuba were responsible for the CW-EPR experiments in a glassy solution and the low-temperature PELDOR experiments, and calculated the related distance distribution functions. F. Formaggio coordinated the results from the different research groups and built-up the helical model of the peptaibiotic. C. Toniolo wrote the manuscript. 8 9 10 11 12 13 14 15 16 17 18 19 20 21 22 23 24 25 26 27 28 29 30 31 32 33 34 35 36 37 38 39 40 41 42 43 44 45 46 47 48 49 50 51 52 53 54
REFERENCES
[1] R.E.W. Hancock, H.-G. Sahl, Nat. Biotech. 2006, 24, 1551-1557. [2] R.M. Epand, R.F. Epand, J. Pept. Sci. 2011, 17, 298-305. [3] R. Chait, K. Vetsigian, R. Kishony, Nat. Chem. Biol. 2012, 8, 2-4. [4] J. Berdy, J. Antibiot. 2012, 65, 385-395.
[5] E. F. Haney, R.E.W. Hancock, Biopolymers (Pept. Sci.) 2013, 100, 572-583. [6] A.L. Hilchie, K. Wuerth, R.E.W. Hancock, Nat. Chem. Biol. 2013, 9, 761-768.
[7] K.M.G. O’Connell, J.T. Hodgkinson, H.F.Sore, M. Welch, G.P.C. Salmond, D.R. Spring,
Angew. Chem. Int. Edit. 2013, 52, 10706-10733.
[8] M.S. Butler, M.A. Blaskovic, M.A. Cooper, J. Antibiot. 2013, 66, 571-591. [9] O. Nolte, Protein Pept. Lett. 2014, 21, 330-335.
[10] C.T. Walsh, T. Wencewicz, J. Antibiot. 2014, 67, 7-22. [11] S.B. Singh, Bioorg. Med. Chem. Lett. 2014, 24, 3683-3689.
[12] S. Ramesh, T. Govender, H.G. Kruger, B.G. de la Torre, F. Albericio, J. Pept. Sci. 2016,
22, 438-451.
[13] C. Toniolo, H. Brückner, Peptaibiotics: Fungal Peptides Containing α-Dialkyl α-Amino
Acids, Wiley-VCH, Weinheim, Germany 2009.
[14] R. Nagaraj, P. Balaram, Acc. Chem. Res. 1981, 14, 356-362. [15] M.S.P. Samson, Prog. Biophys. Mol. Biol. 1991, 55, 139-235.
[16] S. Rebuffat, C. Goulard, B. Bodo, M.-F. Roquebert, Recent Res. Devel. Org. Bioorg.
Chem. 1999, 3, 65-91.
[17] C. Toniolo, M. Crisma, F. Formaggio, C. Peggion, R.F. Epand, R.M. Epand, Cell. Mol.
Life Sci. 2001, 58, 1179-1188.
[18] C. Peggion, F. Formaggio, M. Crisma, R.F. Epand, R.M. Epand, J. Pept. Sci. 2003, 9, 679-689.
[19] H. Duclohier, Curr. Pharm. Des. 2010, 16, 3212-3223.
[20] J.F. de S. Daniel, E. Rodrigues Filho, Nat. Prod. Res. 2007, 24,1128-1141. [21] Chem. Biodivers., Topical Issue (Eds.: H. Brückner, C. Toniolo) 2013, 10, issue 5.
[22] C. Peggion, B. Biondi, M. De Zotti, S. Oancea, F. Formaggio, C. Toniolo, J. Pept. Sci.
2013, 19, 246-256. 8 9 10 11 12 13 14 15 16 17 18 19 20 21 22 23 24 25 26 27 28 29 30 31 32 33 34 35 36 37 38 39 40 41 42 43 44 45 46 47 48 49 50 51 52 53 54
[23] S. Oancea, G. Hilma, C. Peggion, F. Formaggio, C. Toniolo, Chem. Biodivers. 2008, 5, 681-692.
[24] M. De Zotti, B. Biondi, C. Peggion, F. Formaggio, Y. Park, K.-S. Hahm, C. Toniolo,
Org. Biomol. Chem. 2012, 10, 1285-1299.
[25] S. Bobone, M. De Zotti, A. Bortolotti, B. Biondi, G. Ballano, A. Palleschi, C. Toniolo, F. Formaggio, L. Stella, Biopolymers 2015, 104, 521-532.
[26] I. L. Karle, P. Balaram, Biochemistry 1990, 29, 6747-6756.
[27] C. Toniolo, M. Crisma, F. Formaggio, C. Peggion, Biopolymers (Pept. Sci.) 2001, 60, 396-419.
[28] G. Valle, M. Crisma, C. Toniolo, R. Beisswenger, A. Rieker, G. Jung, J. Am. Chem.
Soc. 1989, 111, 6828-6833.
[29] M. De Zotti, B. Biondi, F. Formaggio, C. Toniolo, L. Stella, Y. Park, K.-S. Hahm, J.
Pept. Sci. 2009, 15, 615-619.
[30] H.-H. Nguyen, D. Imhof, M. Kronen, B. Schlegel, A. Härtl, U. Gräfe, L. Gera, S. Reissmann, J. Med. Chem. 2002, 45, 2781-2787.
[31] S. Zikou, A.-I. Koukkou, P. Mastora, M. Sakarellos-Daitsiotis, C. Sakarellos, C. Drainas, E. Panou-Pomonis, J. Pept. Sci. 2007, 13, 481-486.
[32] C. Juhl, S. Els-Heindl, R. Schönauer, G. Redlich, E. Haaf, F. Wunder, B. Riedl, N. Burkhardt, A. G. Beck-Sickinger, D. Bierer, ChemMedChem 2016, 11, 2378-2384.
[33] S. M. K. McKinnie, W. Wang, C. Fisher, T. McDonald, K. R. Kalin, X. Iturrioz, C. Llorens-Cortes, G. Y. Oudit, J. C. Vederas, J. Med. Chem. 2017, 60, 6408-6427.
[34] V. N. Syryamina, R. I. Samoilova, Yu. D. Tsvetkov, A. V. Ischenko, M. De Zotti, M. Gobbo, C. Toniolo, F. Formaggio, S. A. Dzuba, Appl. Magn. Reson. 2016, 47, 309-320. [35] A. D. Milov, Yu. D. Tsvetkov, M. Bortolus, A. L. Maniero, M. Gobbo, C. Toniolo, F.
Formaggio, Biopolymers (Pept. Sci.) 2014, 102, 40-48.
[36] M. Bortolus, A. Dalzini, F. Formaggio, C. Toniolo, M. Gobbo, A. L. Maniero, Phys.
Chem. Chem. Phys. 2016, 18, 749-760.
[37] A. D. Milov, Yu. D. Tsvetkov, A. G. Maryasov, M. Gobbo, C. Prinzivalli, M. De Zotti, F. Formaggio, C. Toniolo, Appl. Magn. Reson. 2013, 44, 495-508.
[38] A. D. Milov, Yu. D. Tsvetkov, M. De Zotti, C. Prinzivalli, B. Biondi, F. Formaggio, C. Toniolo, M. Gobbo, J. Struct. Chem. 2013, 54, S73-S85.
8 9 10 11 12 13 14 15 16 17 18 19 20 21 22 23 24 25 26 27 28 29 30 31 32 33 34 35 36 37 38 39 40 41 42 43 44 45 46 47 48 49 50 51 52 53 54
[39] M. Gobbo, E. Merli, B. Biondi, S. Oancea, A. Toffoletti, F. Formaggio, C. Toniolo, J.
Pept. Sci. 2012, 18, 37-44.
[40] M. Gobbo, C. Poloni, M. De Zotti, C. Peggion, B. Biondi, G. Ballano, F. Formaggio, C. Toniolo, Chem. Biol. Drug Des. 2010, 75, 169-181.
[41] M. De Zotti, B. Biondi, C. Peggion, Y. Park, K.-S. Hahm, F. Formaggio, C. Toniolo, J.
Pept. Sci. 2011, 17, 585-594.
[42] X. Bi, C. Wang, W. Dong, W. Zhu, D. Shang, J. Antib. 2014, 67, 361-368.
[43] I. Schiopu, L. Mereuta, A. Apetrei, Y. Park, K.-S. Hahm, T. Luchian, Mol. BioSyst.
2012, 8, 2860-2863.
[44] Y. H. Nan, B. Jacob, Y. Kim, S. Y. Shin, J. Pept. Sci. 2012, 18,740-747.
[45] D. Lousa, A. R. T. Pinto, B. L. Victor, A. Laio, A. S. Veiga, M. A. R. B. Castanho, C. M. Soares, Sci. Rep 2016, 6, 28099.
[46] C. D. Fjell, H. Jenssen, W. A. Cheung, R. E. W. Hancock, A. Cherkasov, Chem. Biol.
Drug Des. 2011, 77, 48-56.
[47] N. Shagaghi, R. L. Alfred, A. H. A. Clayton, E. A. Palombo, M. Bhave, J. Pept. Sci.
2016, 22, 492-500.
[48] T. N. Kropacheva, E. S. Salnikov, H.-H. Nguyen, S. Reissmann, Z. A. Yakimenko, A. A. Tagaev, T. V. Ovchinnikova, J. Raap, Biochim. Biophys. Acta (Biomembranes) 2005,
1715, 6-18.
[49] M. Schiffer, C.-H. Chang, F. J. Stevens, Protein Eng. 1992, 5, 213-214. [50] D. V. Tulumello, C. M. Deber, Biochemistry 2011, 50, 3928-3935. [51] W. Liu, M. Caffrey, Biochemistry 2006, 45, 11713-11726.
[52] A. J. Johnston, Y. Zhang, S. Busch, L. C. Pardo, S. Imberti. S. E. McLain, J. Phys.
Chem. B 2015, 119, 5979-5987.
[53] J. E. Hare, S. C. Goodchild, S. N. Breit, P. M. G. Curmi, L. J. Brown, Biochemistry
2016, 55, 3825-3833.
[54] M. R. R. de Planque, J. A. W. Kruijtzer, R. M. J. Liskamp, D. Marsh, D. V. Greathouse, R. E. Koeppe II, B. de Kruijff, J. A. Killian, J. Biol. Chem. 1999, 274, 20839-20846.
[55] V. V. Vostrikov, B. A. Hall, M. S. P. Samson, R. E. Koeppe II, J. Phys Chem. B 2012,
116, 12980-12990.
[56] T. Neuhof, A. Berg, H. Besl, T. Schwecke, R. Dieckmann, H. von Döhren, Chem.
Biodivers. 2007, 4, 1103-1115. 8 9 10 11 12 13 14 15 16 17 18 19 20 21 22 23 24 25 26 27 28 29 30 31 32 33 34 35 36 37 38 39 40 41 42 43 44 45 46 47 48 49 50 51 52 53 54
![FIGURE 1 FT-IR absorption spectra in the in the N ̶ H stretching region of [Ala 2 , TOAC 13 ] chalciporin A in CDCl 3 solution at 0.5 mM (full line) and 0.05 mM (dashed line) peptide concentrations](https://thumb-eu.123doks.com/thumbv2/123dokorg/8039713.122754/15.918.250.648.479.708/figure-absorption-spectra-stretching-chalciporin-solution-peptide-concentrations.webp)
![FIGURE 7 CW EPR spectra in frozen glassy MeOH/EtOH solution at 90 K for the mono-TOAC- mono-TOAC-labeled chalciporin A analog [Ala 2 , TOAC 13 ] (curve 1) and the double-labeled analog [Ala 2 , TOAC 3,13 ] (curve 2)](https://thumb-eu.123doks.com/thumbv2/123dokorg/8039713.122754/19.918.63.678.169.367/figure-spectra-frozen-glassy-solution-labeled-chalciporin-labeled.webp)
![FIGURE 12 Peptide induced CF leakage at 20 min for different R -1 =[peptide]/[lipid] for 7:3 PC/Ch vesicles (A) and 7:3 PE/PG (B) vesicles for trichogin (̶ ■̶ ), chalciporin A (̶●̶ ), and its mono-labeled [Ala 2 , TOAC 13](https://thumb-eu.123doks.com/thumbv2/123dokorg/8039713.122754/24.918.93.662.572.762/figure-peptide-different-vesicles-vesicles-trichogin-chalciporin-labeled.webp)
