UNIVERSIT `A DEGLI STUDI DI ROMA
”TOR VERGATA”
FACOLT ´A DI SCIENZE MM.FF.NN.
Dottorato di ricerca in ASTRONOMIA
Ciclo XXI
Classical Cepheids as
distance indicators and tracers of the
disk abundance gradient
Silvia Pedicelli
A.A. 2008/2009
Docenti guida/Tutors: Prof. R. Buonanno, G. Bono and M. Romaniello
Coordinatore: Prof. P. Mazzotta
ABSTRACT
Classical Cepheids are the most popular primary distance indicator. They obey to well defined optical and near-infrared (NIR) Period-Luminosity (PL) relations and their distances can be estimated with an accuracy of a few percent. They also are, the best tracers of intermediate-mass stars. In particular, since they are distributed across the Galactic disk they can be adopted to trace the iron and heavy element radial gradients. In the past few years, significant progress has been made to understand and characterize the influence that chemical composition may have on the Cepheids Period-Luminosity relation but this issue is still unsettled. Although the existence of the Galactic abundance gradient is now widely accepted, its value still need to be established. To better understand these fundamental points, we focused our attenc-tion on two main topics:
i) the influence of the stellar iron content on the PL relation in the V and in the K band.
ii) the behavior of the Galactic iron gradient between 5 and 17 kpc, using homogeneous iron abundances for 270 Galactic Cepheids located across the disk together with accurate distance determinations. To asses the effect of the metallicity on the PL relation, we have related the V and the K-band residuals from the standard PL relations of Freedman et al. (2001) and Persson et al. (2004), respectively, to iron abundance ([Fe/H]). We used iron measurements for 68 Galactic and Magellanic Cepheids based on high resolution and high signal-to-noise ratio (S/N) spectra collected with [email protected] and UVES@VLT (ESO, Telescopes). We have found a mean [Fe/H] ∼ solar (σ = 0.10) for our Galactic sample (32 stars), -0.33 dex (σ = 0.13) for the Large Magellanic Cloud (LMC, 22 stars) and -0.75 dex (σ = 0.08) for the Small Magellanic Cloud (SMC, 14 stars). Our abundance measurements of the Magellanic Cepheids double the number of stars studied up to now at high resolution. Our results show that the metallicity affects the Cepheid PL relation and this finding does not depend on the adopted LMC distance modulus. Results based on the canonical LMC distance (µLMC =18.5) indicate a well defined effect in the V and
a mild effect in the K-band PL relations. In particular, the metal-poor and the metal-rich bins are, in the visual band, at ∼ 2σ and ∼ 9σ, respectively, from the null hypothesis and the two bins differ at 3σ level. In the infrared band, the metal-poor bin is within 1σ consistent with zero while the metal-rich bin differs from the null hypothesis by ∼ 4σ. Moreover, the magnitude residuals in the two metallicity bins differ by ∼ 2σ. These findings support the evidence that the Cepheid PL relation is not Universal.
To investigate the Galactic abundance gradient, we provided new calibrations of two photometric metal-licity indices based on Walraven photometry. The best results have been obtained by the theoretical Metallicity-Index Color (MIC) relations. They rely on a homogeneous set of scaled-solar evolutionary tracks for intermediate-mass stars and on pulsation predictions concerning the topology of the instability strip. The intrinsic accuracy of the MIC relations are ∼ 0.1 dex. Using the calibrated relations we have estimated photometric metallicities for the entire Walraven sample (122 Cepheids). Among them, 51 had accurate iron abundaces available in litterature and 71 are new estimates. We added four metal-rich Cepheids for which we collected high resolution spectra and for which we derived accurate distances based on the Baade-Wesselink technique. Moreover, to improve the number of tracers, we have also in-cluded 116 Cepheids from Andrievsky et al. (2002), 63 from Lemasle et al. (2007), 6 from Szil´adi et al. (2007) and 10 from Romaniello et al. (2008) to end up with 270 Galactic Cepheids. Our result, over the entire data set, indicates that the iron gradient in the Galactic disk presents a slope of -0.048 ± 0.004 dex kpc−1which is in very good agreement with the most recent literature values. However, the hypothesis
of a linear gradient is still widely debated. Several investigations suggest a bimodal distribution with a steeper slope toward the bulge and a flattening of the gradient toward the outer disk with a discontinuity at RG ∼10 kpc. Our data do not support the discontinuity hypothesis but we have found that Cepheids present an increase in the spread in iron abundance and that it may depend on the Galactocentric longi-tude. The occurrence of this spread indicates that linear radial gradients should be cautiously treated to
RIASSUNTO
Le Cefeidi Classiche sono gli indicatori primari di distanza pi´u utilizzati. Relazioni ben definite intercorrono tra il loro periodo e la loro luminosit´a, sia nella banda ottica che in quella del vicino in-frarosso. Grazie a queste relazioni ´e possibile determinare le loro distanze con grade accuratezza. Inoltre sono i migliori traccianti di stelle di massa intermedia. Infatti, poich´e sono distribuite lungo tutto il disco Galattico, possono essere adottate per tracciare i gradienti radiali di abbondanza di ferro e ele-menti pesanti. Negli ultimi anni sono stati fatti molti progressi verso la comprensione e caratterizzazione dell’influenza che la composizione chimica potrebbe avere sulla relazione Periodo-Luminosit´a (PL) delle Cefeidi, ma tale problema rimane ancora irrisolto. Inoltre, nonostante l’esistenza di un gradiente di ab-bondanza Galattico sia oggi largamente accettata, il suo preciso valore ´e ancora da definire. Con lo scopo di comprendere meglio questi punti fondamentali, abbiamo rivolto la nostra attenzione su due obiettivi principali:
i) valutare l’influenza della metallicit´a sulla PL nelle bande V e K.
ii) dare una stima accurata del gradiente di abbondanza Galattico tra 5 e 17 kpc, utilizzando misure omo-genee di composizione chimica per un campione che comprende 270 Cefeidi situate lungo il disco e delle quali abbiamo ottenuto una buona stima delle distanze.
Per valutare l’effetto che la metallicit´a ha sulla PL, abbiamo messo in relazione, per le bande V e K, i residui dalla PL standard di Freedman et al. (2001) e Persson et al. (2004), rispettivamente, all’abbondanza di ferro ([Fe/H]). A tale scopo, abbiamo usato misure dirette del ferro per 68 Cefeidi Galattiche e Magellaniche ricavate dall’analisi di spettri ad alta risoluzione e alto rapporto segnale ru-more (S/N) ottenuti con strumenti e telescopi ESO ([email protected] e UVES@VLT). In questo studio, abbiamo trovato una metallicit´a media circa solare (σ = 0.10) per il campione Galattico (32 stelle), -0.33 dex (σ = 0.13) per quello della grande Nube di Magellano (LMC, 22 stelle) e -0.75 dex (σ = 0.08) per la Piccola Nube di Magellano (SMC, 14 stelle). Il numero delle nostre misure di abbondanza per le Cefeidi Magellaniche risulta essere pi´u del doppio di quello totale studiato fino ad ora ad alta risoluzione. I nostri risultati mostrano che la metallicit´a influisce sulla PL delle Cefeidi e questa constatazione non dipende dal modulo di distanza adottato per LMC. Risultati basati sulla distanza canonica di LMC (µLMC =18.5) indicano un ben definito effetto nella banda visuale V e un effetto pi´u lieve in quella nel vicino infrarosso K. In dettaglio, abbiamo visto che i due bin di metallicit´a, quello povero di metalli e quello ricco, nella banda visuale, si trovano rispettivamente a ∼ 2σ e a ∼ 9σ, rispetto all’ipotesi di indipendenza e i due bins hanno una differenza di 3σ. Nella banda infrarossa, il bin povero di metalli si trova entro 1σ con-sistente con zero mentre quello ricco di metalli differisce dall’ipotesi di indipendenza di ∼ 4σ. Inoltre, i due bins differiscono tra loro ∼ 2σ. Questi risultati suggeriscono che la PL delle Cefeidi non pu ´o essere considerata Universale. Per indagare il gradiente di abbondanza Galattico, abbiamo fornito due nuove calibrazioni, una empirica e una teorica, di due indici di metallicit´a basati sulla fotometria di Walraven. I migliori risultati sono stati ottenuti con le relazioni teoriche tra la metallicit´a e gli Indici di Colore (MIC). Queste sono basate su un insieme omogeneo di tracce evolutive solar-scaled per stelle di massa intermedia e su previsioni pulsazionali riguardanti la topologia della striscia di instabilit`a. Lo scatter intrinseco delle relazioni ´e ∼ 0.1 dex. Usando le relazioni calibrate, abbiamo ottenuto metallicit´a foto-metriche per l’intero campione di Walraven (122 stelle). Di queste, 51 disponevano di misure accurate di abbondanza di ferro in letteratura, per le rimanenti 71 abbiamo fornito noi una nuova stima. Abbi-amo, inoltre, aggiunto le 4 per cui avevamo stimato le distanze con il metodo del Baade-Wesselink. Per aumentare ulteriormente il numero dei traccianti, abbiamo incluso anche 116 Cefeidi dal set di dati di Andrievsky et al. (2002b), 63 da quello di Lemasle et al. (2007), 6 dal campione di Szil´adi et al. (2007) e 10 da quello di Romaniello et al. (2008). In questo modo siamo riusciti ad ottenere un campione di 270 stelle. Il risultato ottenuto facendo un fit lineare dell’intero dataset, indica che il gradiente di abbondanza Galattico presenta una pendenza di -0.048 ± 0.004 dex kpc−1, in ottimo accordo con le stime pi´u recenti.
dello spread in contenuto di ferro e che questo spread possa dipendere dalla longitudine Galattocentrica. Il verificarsi di uno spread in metallicit´a in funzione della longitudine Galactocentrica indica che il gra-diente radiale dovrebbe essere utilizzato con cautela nel porre dei limiti per l’evoluzione chimica in tutto il disco. Infine, con questi risultati, abbiamo deciso di fare un fit esponenziale del gradiente ottenendo uno scarto quadratico medio di 0.129 dex.
Contents
Table of Contents . . . III List of Figures . . . VI List of Tables . . . VIII
1 INTRODUCTION 1
1.1 Cepheids: a brief history . . . 1
1.2 Cepheids: characteristics . . . 4
1.3 Cepheids: evolution . . . 8
1.4 The distance scale . . . 9
1.5 The Baade-Wesselink Method . . . 11
1.6 Period-Luminosity relation . . . 12
1.6.1 The metallicity problem . . . 13
1.7 The disk abundance gradient . . . 17
1.7.1 A brief review . . . 17
1.7.2 The Cepheid contribution . . . 19
1.7.3 The linear gradient . . . 20
1.8 This thesis project . . . 21
2 Observations 23
2.1.2 The ESO-VLT telescope and UVES . . . 25
2.1.3 The Dutch telescope and the Walraven photometer . . . 28
2.1.4 The SAAO-0.75m telescope and the Mk II IR photometer . . . 30
2.2 Data . . . 32
2.2.1 PL-data: the Galactic sample . . . 33
2.2.2 PL-data: the Magellanic sample . . . 36
2.2.3 BW-data . . . 36
2.2.4 Walraven-data . . . 38
3 Overview of the analysis of stellar spectra 40 3.1 Line list . . . 46
3.2 Equivalent widths . . . 48
3.3 Stellar Parameters . . . 48
3.4 FITLINE . . . 49
3.5 Abundances and their uncertainties . . . 53
4 The effect of metallicity on the PL relation 58 4.1 The adopted standard PL relations . . . 59
4.2 Results . . . 60
4.3 Uncertainties . . . 64
4.4 Comparison with previous results . . . 64
4.5 LMC distances: ”short” vs ”long” scale . . . 66
4.6 Conclusions . . . 68
5 Baade-Wesselink method 70
5.1 The model . . . 70
5.2 Radial velocities . . . 71
5.3 Distances . . . 72
5.4 Conclusions . . . 82
6 The Galactic abundance gradient 83 6.1 Interstellar reddening corrections . . . 83
6.2 MIC Relations . . . 84
6.3 Metallicity estimates . . . 86
6.4 The Galactic abundance gradient . . . 93
6.5 Conclusions . . . 95 7 Conclusions 97 A Light Curves 100 B Line list 141 Curriculum Vitae . . . 159 III
1.1 PL Relation of Shapley 1918 . . . 3
1.2 Classification diagram for variable stars . . . 4
1.3 Light Curve of δ Cephei . . . 6
1.4 Light and Radial velocity Curve of δ Cephei . . . 6
1.5 Light curve vs wavelength . . . 7
1.6 Instability strip schema . . . 9
1.7 PL relations in Magellanic Clouds at seven wavelengths . . . 12
1.8 Recent results for the metallicity sensitivity of Cepheid distances . . . 15
2.1 The FEROS complete system . . . 25
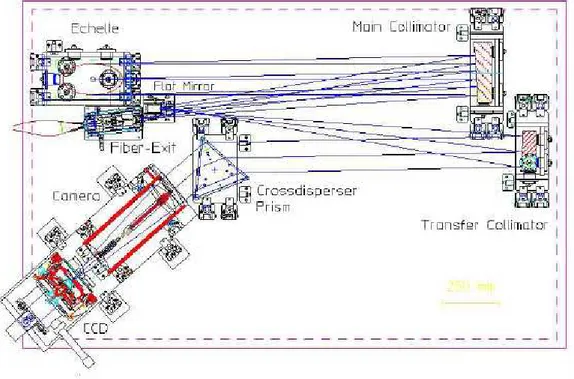
2.2 The UVES spectrograph . . . 27
2.3 The Dutch Telescope . . . 28
2.4 Optical layout of the Walraven photometer . . . 29
2.5 The 0.75m telescope . . . 31
2.6 NIR light curves . . . 37
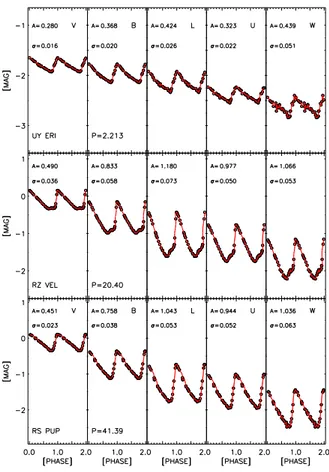
2.7 Light curves in the Walraven V,B,L,U,W bands . . . 38
3.1 The spectral sequence . . . 41
3.2 The Hertzsprung-Russell diagram . . . 42
3.3 Spectral range as observed in three Galactic Cepheids . . . 43
3.4 Definition of the equivalent width W . . . 44
3.5 The equivalent width and the profile changes with the chemical abundance . . . 45
3.6 The distributions of the equivalent widths (EW) . . . 47
3.7 Examples of measurements of equivalent widths with fitline . . . 52
3.8 Histograms of the metallicity derived for the Galaxy, the LMC and the SMC . . . 54
4.1 PL relations for our sample . . . 59
4.2 PL relations calculated in each bin for the V band . . . 62
4.3 PL relations calculated in each bin for the K band . . . 63
4.4 The V-band residuals compared to Freedman et al. (2001) PL relation . . . 65
4.5 The V-band residuals at ”long” and ”short” distance scale . . . 67
5.1 Radial Velocity Curve of our BW sample . . . 73
5.2 Optical, Infrared and radial velocity Curve for UZ Sct . . . 74
5.3 Optical, Infrared and radial velocity Curve for AV Sgr . . . 75
5.4 Optical, Infrared and radial velocity Curve for V340 Ara . . . 76
5.5 Optical, Infrared and radial velocity Curve for VY Sgr . . . 77
5.6 Baade-Wesselink method for UZ Sct . . . 78
5.7 Baade-Wesselink method for AV Sgr . . . 79
5.8 Baade-Wesselink method for V340 Ara . . . 80
5.9 Baade-Wesselink method for VY Sgr . . . 81
6.1 Comparison between theory and empirical data . . . 85
6.2 Theoretical MIC relation (V-B) . . . 87
6.3 Theoretical MIC relation (V-K) . . . 88
6.4 Empirical MIC relation (V-K) . . . 90
6.7 Galactic abundance gradient from the entire sample . . . 94
List of Tables
1.1 Overview of recent results for the metallicity sensitivity of Cepheid distances . . . 14
2.1 Main parameters and performances for FEROS . . . 24
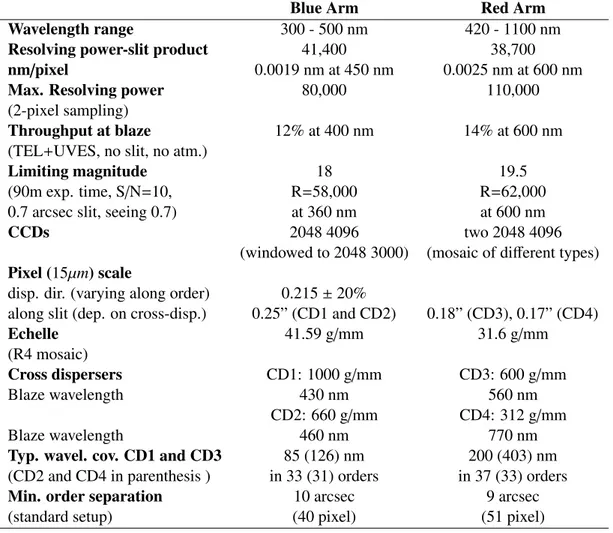
2.2 Main parameters and performances for UVES . . . 26
2.3 The bandwiths and effective wavelengths of the five photometric passbands . . . 30
2.4 Mk II System Parameters . . . 32
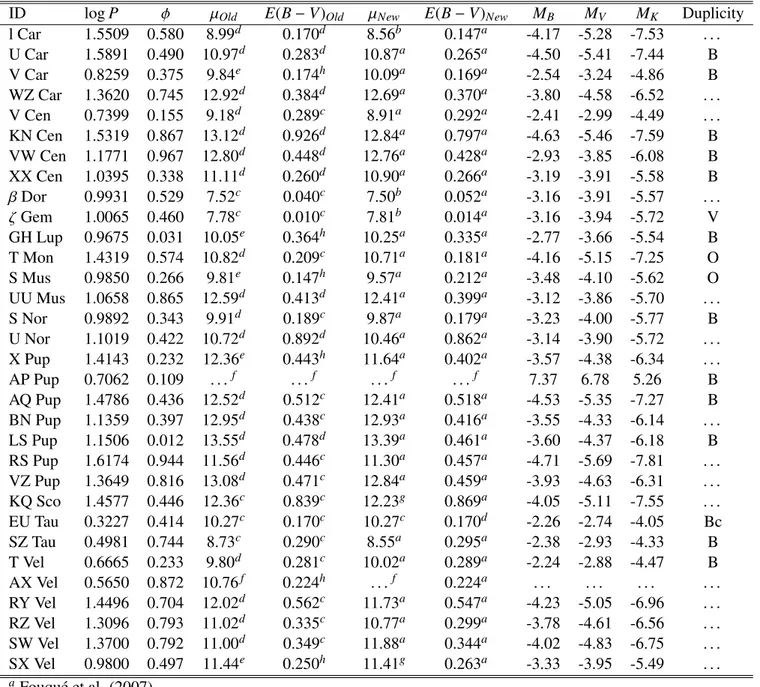
2.5 Pulsation phases (φ) and intrinsic parameters of the Galactic Cepheids . . . 34
2.6 Pulsation phases (φ) and intrinsic parameters of the Magellanic Cepheids . . . 35
2.7 BW-data parameters . . . 37
3.1 Stellar parameters and FeI and FeII abundances of our Galactic sample . . . 50
3.2 Stellar parameters and FeI, FeII abundances of our Magellanic Cepheids . . . 51
3.3 Effects on measured FeI and FeII abundances caused by changes in atmospheric parameters. 54 3.4 Comparison of the mean metallicities of the Magellanic Clouds with previous studies . . 56
5.1 Distances and radii from the BW-analysis . . . 72
6.1 Coefficients of the MIC relations . . . 86
6.2 Mean values and dispersions of the residuals of MIC relations . . . 86
6.3 Theoretical vs empirical MIC relations . . . 89
A.1 Physical parameters of Walraven sample . . . 101
A.4 Mean VBLUW magnitudes type II Cepheids . . . 110
A.5 NIR Photometry of Galactic Cepheids . . . 111
A.6 NIR Photometry of type II Cepheids . . . 115
B.1 Complete line list . . . 142
Ad Eleonora...
”Das anschaulichste Beispiel f¨ur die gewaltige Anziehungskraft eines
schwarzen Loches ...
ist und bleibt die Schwabinger 7”
1
C
1
INTRODUCTION
Cepheids variables have played an important role in astronomy since it was recognized that they could be used to determine distances through their Period-Luminosity relation. In the comparison between theory and observations, the physical properties of a star, such as absolute age and flux, radius size or effective temperature, depend significantly on how well one is able to determine the object distance. Therefore, measuring distances is a crucial point at the core of astrophysical research.
For over one hundred years Cepheids have served as an effective tool for studying the Universe. Cepheids provide one of the best means of determining the distances to nearby galaxies and they are used to calibrate secondary distance indicators, thus they play a crucial role to establish the extragalactic distance scale, being the first rung of the distance ladder. Furthermore the measurement of the Hubble constant (H0), which sets the scale of the universe in space and time, depends heavily on accurate extragalactic
distance measurements.
1.1 Cepheids: a brief history
The first two Cepheids were discovered by two pioneers in the systematic observation of variable stars, E. Pigott and J. Goodricke, in 1784. These were η Aquilae and δ Cephei, the latter supplied the name now used for this class of stars.
In 1894 A.A. Belopolskii detected periodic variation in the radial velocities1 of Cepheid and, in 1899,
K. Schwarzschild found the amplitude of a Cepheid luminosity variation to be considerably higher in photographic light than in visual light. This pointed to a variability of the temperature, as well as of the luminosity. These facts found their natural explanation in the hypothesis of Cepheids intrinsic variability, first proposed by Ritter in 1879 and later by Umov, Plummer and Shapley (see H. Shapley 1914). Theoretical work of Sir Arthur Eddington put the pulsation hypotesis on a firmer basis (A. Eddington 1927, 1941, 1942). He showed that Cepheids are single stars that undergo radial pulsation hence their variability is intrinsic and does not depend on the presence of a companion. Later work by S. A. Zhevakin (1963), R. F. Christy (1966), J. P. Cox (1980, and references therein) provided a deeper understanding
1The radial velocity of a star is the velocity in the direction of the line of sight. This can be measured from the stellar
of the mechanism driving Cepheid pulsation, know as k, γ − mechanisms. If the star is compressed, the fraction of the Partially Ionized Regions (PIR, where T ∼ 13, 000 K) increases, raising the opacity of the material and blocking the photons trying to escape from the interior. The increased heat and pressure built up in this layer, push the outer layers of the star outward. As these outer layers fall back inward again under the force of gravity, the ionization region gets compressed again, restarting the cycle. The variation in brightness is caused by changes in temperature and in radius caused by this motions. Cepheid pulsation are therefore restricted to stars in a limited temperature range, due to the requirement that the partial ionization zone lies close to the transition from the nearly adiabatic interior to the non-adiabatic exterior of the stellar envelope.
Following the examination of hundreds of photographic plates obtained between 1893 and 1906 at the Harward College Observatory in Per´u, Henrietta Leavitt (1868 - 1921) produced a catalogue of 1777 variable stars in the Magellanic Clouds (MCs)2. She classified 47 of these in one of the two clouds
as Cepheid variables because of their similarities with the well documented Galactic variable δ Cephei and she noticed that those with longer periods were brighter than the shorter-period ones. She correctly inferred that as the stars were in the same distant cloud they were all at the same relative distance from us, therefore any difference in apparent magnitude3 was related to a difference in absolute magnitude4.
When she plotted her results, she noted that they formed distinct relationships between brightness and period. Her plot showed what is now known as the period-luminosity (PL) relationship: Cepheids with longer periods are intrinsically more luminous than those with shorter ones. The Danish astronomer, Ejnar Hertzsprung (1873-1967) quickly realized the significance of this discovery: by measuring the pe-riod of a Cepheid from its light curve, the distance to that Cepheid could be determined. He realized that if the PL relation could be independently calibrated, then the distance moduli5of these variable stars can
be determinated directly from their periods. In those days, the main topic was about the Sun position in-side our Galaxy. Hertzsprung realized the importance to calibrate the PL relation related to this problem. With his data on nearby Cepheids, he calculated the distance of the Small Magellanic Cloud (SMC) as 37,000 light years6(∼ 11 kpc) away.
At the beginning of nineteenth century, Harlow Shapley using a larger number of Cepheids, recalibrated the absolute magnitude scale and revised the value of the distance to the SMC to 95,000 light years (∼ 29 kpc). However, it was eventually realized that, due mainly to systematic errors and a failure to take into account extinction7, his zero point was approximately 1.5 magnitudes too dim. Nevertheless, an
extraordinary coincidence led to this not being realized for over 30 years. He also studied Cepheids in 86 Globular Clusters8(GCs), Leavitt herself had remarked upon the similarity of the bright globular cluster
variables (GCv) to those in the SMC and he found that the few dozen brightest non-variable stars in each cluster was about 10 times brighter than the average Cepheid magnitude. On the basis of this evidence he could estimate the distance of a large number of globular clusters. He found that these clusters pre-sented the same luminosity. Shapley examined the PL relation for the ”long-period” variables in the GC and he found that its slope was very similar to the slope of the SMC Cepheids, accordingly he included these stars in his PL relation. In his 1918 paper, variables from seven stellar systems were combined
2Two dwarf irregular galaxies, satellites of the Milky Way.
3The logarithmic measure of the brightness of an object, measured in a specific wavelength or passband. 4The absolute magnitude of an astrophysical object is its magnitude at fixed distance of 10 pc.
5The true distance modulus µ = m − M is the difference between the apparent magnitude m and the absolute magnitude M
of an astronomical object, corrected for reddening.
6The light year (ly) is the distance cover by the light in one year and correspond to 9.461 · 1012km or 3.26 pc. 7Absorption of light from astronomical objects by matter between them and the observer.
8Globular Cluster (GC) are gravitationally bound concentrations of approximately hundred thousand to more than one
1.1. CEPHEIDS: A BRIEF HISTORY 3
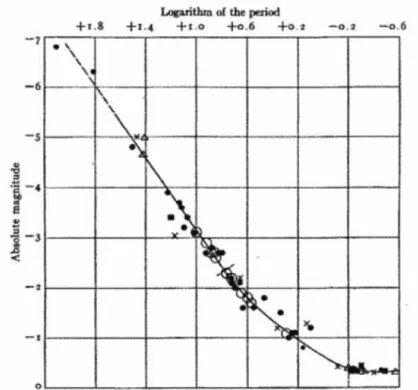
Figure 1.1: The Period-Luminosity relation found by Shapley (1918). Figure from his original paper.
into the single PL relation showed in Fig. 1.1. This figure suggests that Shapley had gone even further than this: the linear relationship breaks down at bottom right due to his inclusion of faint, short period variables. He called these stars ”cluster-type Cepheids”; now known as RR-Lyrae variables, which are central He-burning low-mass stars but characterized by the same pulsating mechanism (see Fig. 1.2). By applying this PL relation, Shapley estimated for the first time the distance of the Sun from the Galactic center and found a distance of the order of ten kpc. This demonstrated that the old common believe concerning the central position of the Sun in the Milky Way was wrong. In 1924 Edwin Hubble detected Cepheids in the Andromeda nebula, M31 and the Triangulum nebula M33. Using these, he determined that their distances were 900,000 (∼ 270 kpc) and 850,000 (∼ 260 kpc) light years respectively. He thus established that these ”spiral nebulae” were in fact other galaxies and not part of our Milky Way. This was a seminal discovery and dramatically expanded the scale of the known Universe. Hubble later went on to observe the redshift of galaxies and propose that this was due to their recession velocity, with more distant galaxies moving away at a higher speed than nearby ones. This relationship is now called Hub-ble’s Law and it means that the Universe is expanding.
The Hubble discoveries changed completely the current view of the Universe: all the galaxies are moving away from each other.
In the next three decades several studies of the Cepheids PL relation had been carried out, in particu-lar revisions of Shapley’s zero-point for this relation. From 1944 to 1952, Baade’s works revealed the existence of two kind of Cepheids with distinct PL relations, the first, known as Classical Cepheids, associated with the disk component of our Galaxy (young stellar population) and the second with the spherical component (old stellar population. These results and the studies of Cepheids in open stellar clusters9(e.g. Sandage, 1958; Kraft 1961) led to the correction of zero-point of the PL relation of a value
Figure 1.2: Classification diagram for variable stars.
of -1.5 magnitudes and to new estimates of galactic and extragalactic distances (nearly doubled respect to the previous estimates).
With the advent of new technologies and increased use of infrared (IR) wavelengths, the approach of modern studies to the Cepheid calibration shifted towards the empirical, rather than the speculative. Multi-wavelength observations of Cepheid magnitudes, better estimates of reddening effects (i.e. extinc-tion, Freedman 1988), of individual distances of Galactic Cepheids (Feast & Catchpole 1997) and for the Magellanic Clouds distances (see Benedict 2002 for a review on methods and results) greatly improved the determination of the zero-point and slope of the PL relation. In particular, the calibration of the PL relation in the Large Magellanic Cloud (LMC) is essential because this galaxy is the first rung of the extragalactic ladder, since it is the closest external system to our Galaxy, it has a low extinction and little depth on the line of sight (all its Cepheids are roughly, at the same distance).
With the launch of the Hubble Space Telescope (HST) in 1990, it has also been possible to extend the Cepheid distance scale out to the Virgo and Fornax galaxies clusters (HST Key Project, Freedman et al. 2001). In this work, Cepheids play a significant role in the distance determination of galaxies and resulting cosmological implications.
1.2 Cepheids: characteristics
When we look up at the night sky it is easy to imagine that the stars are unchanging. Apart from twinkling due to the effects of our atmosphere stars appear fixed and constant to the untrained eye.
1.2. CEPHEIDS: CHARACTERISTICS 5
Careful observations, some even done with the naked eye, show that some stars do in fact appear to change in brightness over time. Some exhibit periodic behavior, brightening quickly then diminishing in brightness slowly only to repeat themselves. Some of these changes take place on a time scale of several days, while others occur either on a period of hours or on many months. Other stars exhibit a once-off dramatic change in brightness by orders of magnitude before fading away to obscurity. All of these are examples of what are termed variable stars. A variable star is simply one whose brightness changes over time. At a fundamental level all stars are variable as they evolve and change over time (e.g. from a main sequence to a red giant star). Furthermore, we can infer that all stars are likely to vary their light output to some extent due to variations caused by phenomena such as sunspots. In the section however, we focus our attention on stars with a measurable change in brightness. In order to understand variable stars, astronomers classified them according to observable properties. The diagram in Fig. 1.2 shows the main types of variable stars. The first criteria for classification is whether a star in an intrinsic or an extrinsic variable. Intrinsic variables are those in which the change in brightness is due to some change within the star itself such as in pulsating stars. Extrinsic variables are those in which the light output changes due to some process external to the star itself. As shown in the diagram (Fig. 1.2), Cepheids are variable stars which belong to the group of intrinsic variable and to the class of Pulsating stars. They can be divided in two categories:
1. Type I or Classical Cepheids: they are intermediate-mass stars (Population I) and we will discuss
their characteristics in more details afterwards.
2. Type II or W Virginis Cepheids : they are low-mass stars (Population II), intrinsically less
lumi-nous, at given period, and older than the Classical Cepheids.
Both types of Cepheids exhibit distinct PL relations. Since the goal of this thesis project is the study of a sample of Classical Cepheids we will not discuss Type II Cepheids. For this reason the adjective ”Classical” will be omitted in the following.
Cepheids are supergiant stars with luminosities 500-300,000 times greater than of the Sun (L¯ = 3.3 · 1033
erg s−1) and their surface temperatures are similar to the Solar temperature (T
¯ ∼6000 K). The masses
of this type of variables are between 3 and 15 Solar Masses (M¯ = 1.99 · 1033 g). They undergo
regular radial pulsation (i.e. the star expands and contracts) with periods ranging from 1 to 90 days, and in the Magellanic Clouds they have been observed to have periods ranging up to 200 days. More than 400 Cepheids are known in the Milky Way, 1300 and 2000, respectively, have been found in the Large and in the Small Magellanic Clouds (thanks to the large survey of the Optical Gravitational Lensing Ex-periment, OGLE), as well as substantial numbers in other nearby galaxies.
Cepheids are easily recognized by their distinctive light-curves (LCs)10, which are characterized by a
rapid rise to maximum brightness, followed by a slow decline to their minimum (see Fig. 1.3). This pat-tern of changing brightness is repeated in a very regular cycle. The light curve of a Cepheid is matched by its radial velocity curve, which is almost a mirror image of the light curve with minimum radial ve-locity at the light maximum. An example is shown in Fig. 1.4. We only note that in this light curve, the magnitude has been plotted as a function of phase11. The positive (redshifted) half of the velocity curve
corresponds to the contraction of the star from its maximum to minimum radius, which is the later part of the decreasing of the light curve to minimum brightness and the beginning of the rising to maximum brightness. The negative (blueshifted) half of the velocity curve corresponds to the expansion of the star and the brightest part of the light curve. During the same period the surface temperature reaches
10The variation of the luminosity of the stars as a function of time.
Figure 1.3: The light curve of δ Cephei, the prototype of this class (from Hoskin 1999).
Figure 1.4: Top panel: The light curve of δ Cephei in B band (data from Moffett et al. 1984). Bottom panel: Radial Velocity Curve of δ Cephei (data from Bersier et al. 1994. In both panels we plot two periods of their cycle.
1.2. CEPHEIDS: CHARACTERISTICS 7
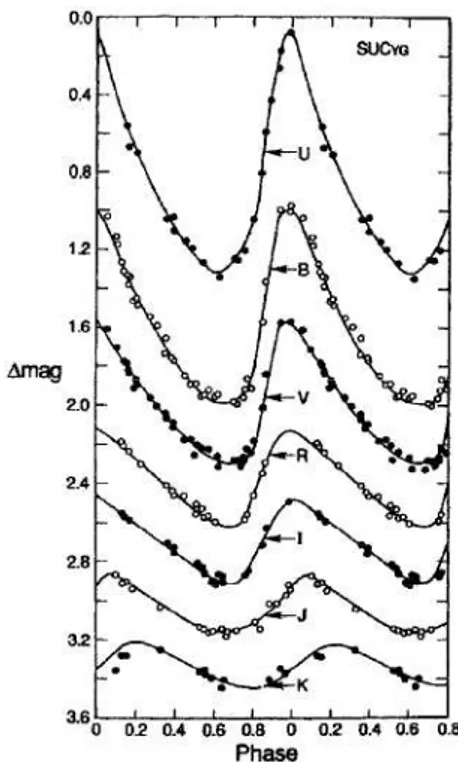
Figure 1.5: Light curves in different colors for a Galactic Cepheid, showing the change in amplitude and phase with the selected bands (from Madore & Freedman 1991).
its highest effective temperature and gradually cools as the star completes its expansion. The amplitude usually lies in the range 30 - 60 km · s−1.
Because of their characteristic light curve and intrinsic brightness, these stars can be identified at great distances and make excellent markers for determining distances through their period-luminosity relation-ship.
The first study of Cepheid light curves which gave useful results were those of E. Hertzsprung (1926). He selected 37 of the most reliable curves and described the main futures of their variations with an increase in period. The principal result of this and other studies of the time can be summarized as follows:
• up to a period of 6 days the light curves are usually smooth, with a rapid rise in luminosity and a more gradual drop;
• at about 6 days a hump appears on the descending branch of the light curve, and then the hump grows and approaches the principle maximum;
• close to a period of 9 or 10 days the hump is so large that the light curve sometimes has two nearly identical peaks;
• with a further increase in the period, the secondary feature becomes the maximum and the true maximum becomes a hump on the ascending branch.
The changes in the shape of the light curve with the period is now known as the Hertzsprung progres-sion.
Applying Fourier analysis to the light curve, the existence of the Cepheids that do not pulsate in the fundamental mode (as in general a Cepheid does) has been discovered. Cepheids can pulsate in the first overtone mode (Pel & Lub 1978; B¨ohm-Vitesse 1994), the second overtone mode (Udalsky et al. 1999b; Bono et al. 2001) and also in the two modes simultaneously (Fitch 1970; King et al. 1975; Pardo & Poretti 1997). Theoretical predictions and observations suggest that first overtone periods range from logP ∼ 0.6 to 0.9 for the Milky Way, from logP ∼ 0.7 to 0.8 for LMC and from logP ∼ 0.6 to 0.8 for SMC (Bono et al. 2002). The double-mode Cepheids usually pulsate in the fundamental and the first overtone modes and the longer of the two is between 2 and 4 days. Appendix A includes all the LCs of our photometric sample (∼ 170 Cepheids).
Photometric observations of Cepheids have shown a number of other interesting characteristics. The am-plitude of variation is observed to decrease with increasing wavelength (see Fig. 1.5). The B and V band photometric variations are due primarily to changes in the surface temperature, while in the near infrared, the observed luminosity changes are primarily due to the variation in the radius of the star. From B to K band a typical Cepheid amplitude drops from 1.0 mag to 0.2 mag. As shown in Fig. 1.5 the variation of the amplitude in the infrared is relatively small, it means that a single observation in the near infrared can be enough to estimate the average luminosity and give a useful distance determination while, at bluer wavelengths, to obtain the same results would be required several dozen observations (see also section 1.6).
Another important characteristic of Cepheids has emerged from radial velocity measurements: the inci-dence of binaries (mainly spectroscopic12) among these variables exceeds 50% (Szabados 1995). The
orbital periods of these binary systems are generally long (1-5 yrs) and a typical companion is a main sequence star. It means that the companion is much hotter (temperature between 20,000 K and 10,000 K) therefore its light contribution is in the ultraviolet while the Cepheid dominates at visible wavelengths (Evans 1991).
1.3 Cepheids: evolution
Cepheids are evolved intermediate-mass stars, in particular they are experience central He-burning and hydrogen shell burning evolutionary phases. They are associated with the so-called Blue Loops and are crossing the Cepheid instability strip13(Becker & Iben 1979; Bono et al. 1999) in the Herzsprung-Russell
(HR) diagram14(see Fig. 1.6). Cepheids cross the instability strip more than once during their lifetime
and the crossing times also depend on the stellar mass. The first crossing of the instability strip occurs during the hydrogen-shell burning phase as the star evolves on its way to become a red giant15. The
occurrence of the blue loop causes the second and third crossing of the instability strip. The morphology of the Blue Loops depends on several mechanisms (convection, mass-loss, rotation) and on input physics (radiative opacities). We still lack a firm knowledge of the phenomena driving its temperature extention and occurrence (Bono et al. 2000b). However, current theoretical prediction indicate that Cepheids spend
12Two stars that are gravitationally bound to each other and that cannot be visually resolved. Their components are
distin-guished spectroscopically.
13The Cepheid instability strip define a range of luminosities and effective temperatures within which stars are pulsationally
stable.
14The Herzsprung-Russell diagram is a plot of luminosity vs temperature, except that the temperature is decreasing to the
right of the horizontal axis. It is used to classify stars according to their luminosity, spectral type, color, temperature and evolutionary stage.
15Stars of Solar mass or higher which have exhausted the hydrogen in their cores and started burning hydrogen in a shell
1.4. THE DISTANCE SCALE 9
Figure 1.6: Schematic representation of the instability strip in the HR diagram.
a significant fraction of their lifetime in the second and third crossing of the instability strip.
1.4 The distance scale
Classical Cepheids are the keystone of both Galactic and extragalactic distance scale. In fact they are the best known primary distance indicators, they are used to provide the step from our Galaxy to the nearby universe and to calibrate secondary distance indicators, such as supernovae type Ia (SNeIa) and the Tully-Fisher relation16. During the last years microlensing experiments (MACHO, EROS) detected and
measured a large sample of Cepheids in the Magellanic Clouds (MCs). At the same time space telescopes such as Hipparcos supplied very accurate distance determinations of Galactic Cepheids by means of trigonometric parallaxes (Feast & Catchpole 1997), while HST detected a good sample of Cepheids in galaxies in the Virgo cluster (Ferrarese et al. 1996). In spite of this unprecedented observational effort several long-standing problems concerning the properties of Cepheids and thus the determination of the distances need to be firmly assessed. In fact even though it has been suggested (Gould 1994) that the Cepheid intrinsic luminosity depends on the chemical composition both the sign and the value of the scaling factor for correcting the distance modulus obtained by Sasselov et al (1997) are at odds with theoretical predictions (Bono et al. 1998a,b).
Classical Cepheids present several advantageous features when compared with other stellar distance indicators. These are illustrated by the points below:
• they are bright giants that can be easily identified due to their intrinsic variability and for which accurate photometric and spectroscopic data can be collected;
16The Tully-Fisher relation measures the distance to rotating spiral galaxies by the width of galactic spectral lines. This
empirically-derived relation states that the luminosity of a galaxy is directly proportional to the fourth power of its rotational velocity, which can be calculated from the width of the spectral line, especially the 21-cm hydrogen line.
• they obey to well defined optical and near-infrared (NIR) Period-Luminosity (PL) relations and their distances can be estimated with an accuracy of the order of a few percent (Benedict et al. 2006; Marconi et al. 2006; Natale et al. 2007; Fouque et al. 2007);
• they are distributed across the Galactic disk, and therefore, they can be adopted to trace the radial distribution of intermediate age stars (Kraft & Schmidt 1963). In particular, they provide robust constraints on the iron and heavy elements radial gradients (Lemasle et al. 2007, and references therein).
• are common enough in the spiral galaxies that large samples can be collected to beat down statis-tical noise.
However, Classical Cepheids also present a few drawbacks:
• the lifetime they spend inside the instability strip is approximately two orders of magnitude shorter than the central hydrogen burning (Bono et al. 2000). This together with the low spatial density and the high reddening account for the limited sample of Galactic Cepheids currently known (Fernie et al. 1995)
• they cannot be observed far enough, with current technology, to measure directly the Hubble con-stant H0, i.e. they can only be observed in galaxies among which the gravitational interactions
are more important (local universe) than the relative motion of non-interacting galaxies due to the expansion of the universe.
• Accurate mean magnitudes and colors require a detailed time sampling along the pulsation cycle. The Cepheid periods range from a few days to hundred days. Therefore, well sampled multiband light curves require long observing runs.
• They are intermediate-mass objects so they are not found in the elliptical galaxies;
• In the Milky Way are barely within the reach of geometrical distance determination and tend to suffer high extinction due to dust in the disk;
• Are still difficult to model in some respects, particularly concerning the location of the red edge of the instability strip in the HR diagram (Bono et al. 1997, 1999).
On the other hand a lot of work has been accomplished using these stars as first step of the extragalac-tic distance scale and to calibrate several secondary distance indicators. The PL relations are calibrated locally in the Milky way and in the Magellanic Clouds. In recent years, extragalactic studies have mostly used PL relations derived in the LMC. Prior to HST, Cepheids had only been well studied in the Local Group and other galaxies within about 4 Mpc (Cepheids had been detected in more distant galaxies but only in very small numbers). At that time very few of these galaxies were useful for checking and cali-brating secondary distance indicators. With HST the situation has changed dramatically so that 30 new galaxies have been observed for Cepheids reaching to 30 Mpc and more. Furthermore, these were mostly chosen specifically to be useful from the point of view of secondary indicators (Freedman et al 2001). Establishing accurate distances over cosmologically significant scales is crucial to pin down the value of the Hubble constant (see Jensen et al 2003 for a review on the extragalactic distance scale). This constant sets the correlation between the recession velocity v of a galaxy and its distance d, i.e. the Hubble law: v = H0d. The inverse of H0 sets the age of the universe, t0, and the size of the observable universe,
1.5. THE BAADE-WESSELINK METHOD 11
Robs=ct0, given a knowledge of the total energy density of the universe. The square of the Hubble
con-stant relates the total energy density of the universe to its geometry (Peacock 1999). The current value of H0is now known with an accuracy better then 10% and this is largely due to the tremendous increase
in the number of galaxies in which Cepheids have been discovered that we have mentioned above (HST Key Project, Freedman et al 2001). Increasingly accurate secondary distance indicators, many calibrated using Cepheids, now provide largely concordant measurements of H0. The value found by Freedman et
al (2001) is H0=72 ± 8km−1Mpc−1. The largest sources of errors result from photometric calibration of
the HST Wide Field and Planetary Camera 2, uncertainties in the distance to the LMC and the effects of the metallicity on the Cepheid PL relation.
1.5 The Baade-Wesselink Method
Obtaining accurate distances to stars is a non-trivial matter. Cepheids are considered an important stan-dard candle as they are bright and are thus the link between the distance scale in the nearby universe and that further out via those galaxies that contain both Cepheids and SNeIa. Distances to local Cepheids may be obtained via main sequence fitting for those Cepheids in clusters (e.g. Feast 1999) or via determi-nation of the parallax. Until recently only Polaris had an accurate parallax determidetermi-nation via Hipparcos (Evans et al 2008). Benedict et al. (2007) recently published absolute trigonometric parallaxes for nine Galactic Cepheids using the Fine Guidance Sensor on board the Hubble Space Telescope and revised, more accurate, Hipparcos parallaxes have also become available (van Leeuwen et al. 2007; van Leeuwen 2007). In addition, distances to Cepheids can be obtained from the Baade-Wesselink method (BW). This method relies on the availability of Infrared Surface-Brightness (IRSB) relations to link variations in color to variations in angular diameters and understanding of the projection (p-) factor that links radial velocity to pulsational velocity variations. The IRSB relations can be obtained using Cepheids that have accurate interferometrically determined angular diameters over the pulsation phase and accurate multi-wavelength light curves. This has allowed Kervella et al. (2004) and Groenewegen (2007, hereafter G07) to derive such relations, in particular using the (V − K) color, which gives the highest precision in the derived angular diameter. The p-factor can also be obtained from Cepheids with interferometrically determined angular diameters over the pulsation phase when in addition accurate radial velocity (RV) curves are available (see e.g. M´erand et al. 2005). G07 assembled all currently available data to find that a constant p-factor represents the best fit to the available data. A strong dependence on period, like p ∼ −0.15 · logP as proposed by Gieren et al. (2005), could be ruled out. A moderate dependence of p ∼ −0.03 · logP as used in the Gieren et al. papers (1993, 1997, 1998; Storm et al. 2004; Barnes et al. 2003), or p ∼ −0.064 · logP as advocated by Nardetto et al. (2007) are also consistent with the available data. The distances to the galactic Cepheids mostly came from BW-distances available at that time from Fouqu´e et al. (2003). In the last few years significant progress has been made in several areas. On the one hand more Cepheids have interferometrically determined angular diameters. Combined with improved theoretical studies (Nardetto et al. 2007, and references therein) this has led to an improved understanding of the p-factor and IRSB relations, as was studied in G07. On the other hand, more basic photometric light curves and radial velocity data have become available and new studies have presented metallicity determinations for significant samples.
Figure 1.7: Magellanic Clouds Cepheid PL relation at seven wavelengths, from the blue to the near-infrared. The LMC Cepheids are shown as filled circles; the SMC data, shifted to the LMC distance, are shown as open circles (from Madore & Freedman 1991). Note the decreased width of the relations as longer and longer wavelengths are considered.
1.6 Period-Luminosity relation
As we have already mentioned before Cepheids are good distance indicator through their Period-Luminosity relation. Its general form is:
< M >= α + β · logP (1.1)
where < M > is the mean absolute magnitude of the Cepheid at a given wavelength, P is the period of the variable, α is the zero point and β is the slope of the relation. The PL relation presents an intrinsic scatter in luminosity at a given period. This scatter is correlated to the finite width of the instability strip hence to a color term (see Fig 1.6). At constant period, the B-magnitude total width of the PL relation is about 1.2 mag while the V-magnitude width is measured to be about 0.9 mag. The intrinsically bluest17
Cepheids are expected to have the brightest absolute magnitudes for a given period. The PL relation is, then, a statistical relation, which provides the average of the Cepheid absolute magnitudes. In estimating distances, any individual Cepheid could deviate from the statistical ridge line by up to ±0.6 mag in B band; such an error (if applied to one Cepheid) would translate into an equivalent error of about ±30% in distance. Large samples can decrease the error on the magnitude inversely with the square root of the number of stars, a formal error of only 10% being possible with a sample containing as few as a dozen Cepheids. However this is true only if the sample of Cepheids well-populated the whole PL relation, i.e. covers a wide range in period. As we have already mentioned in section 1.2, different works (e.g. Pel et al 1981; B¨ohm-Vitense, 1994; Bono et al 2002) pointed out the existence of two distinct PL relations
1.6. PERIOD-LUMINOSITY RELATION 13
for Cepheids that pulsate in the fundamental (F) mode and in the first overtone (FO) mode. The range of periods for the FO PL relation and the width of their instability region is significantly smaller than for the fundamental one. Current predictions (Bono et al, 2002) suggest that, at logP = 0.3, the width of the FO instability strip is 400 K, while for F Cepheids it is 900 K at logP = 1. Therefore, distances based on FO PL relation are less affected by intrinsic spread when compared with F one. Regrettably complete and accurate samples of FO variables are available only for Magellanic Cepheids and the detection of this type of stars in external galaxies is more difficult than for the F Cepheids, since they are fainter and the luminosity amplitudes are smaller. Regarding double mode Cepheids, theoretical models and observations support the evidence that F and FO modes of double-mode Cepheids follow very well the PL relations of pure F and pure FO pulsators. As we have already mentioned in section 1.2, the amplitudes of individual Cepheids (see Fig. 1.5) decrease with the wavelength of the observation, this is due to a much decreased sensitivity of the infrared surface brightness to the temperature. For exactly the same reason, the observed width of the PL relation decreases dramatically with the wavelength (see Fig 1.7). In the infrared bands the PL relation shows a remarkably small scatter (±0.2 mag). Thus, Cepheids observed at long wavelengths and at random points in their cycle are closer to their time-averaged mean magnitudes than the equivalent observation at shorter wavelengths. From B band to K band the width of the PL relation decreases from 1.2 mag to 0.5 mag. As a result, for distance determinations even single, random-phase observations of known Cepheids, when made in the near-infrared, are comparable in accuracy to complete time-averaged magnitudes (derived from a dozen or more observations) in the blue.
1.6.1 The metallicity problem
The debate on the role played by the chemical composition on the pulsational properties of Cepheids is still open, with different theoretical models and observational results leading to markedly different con-clusions.
From the theoretical point of view pulsational models by different groups lead to substantially different results. Linear models (e.g. Chiosi et al 1992; Sandage et al 1999; Baraffe & Alibert 2001), based on non adiabatic pulsational models, suggest a moderate dependence of the PL relation on the metallicity. The predicted change is less than 0.1 mag over the metallicity18interval from Z = 0.004 to Z = 0.02 at
log(P) = 1, independent of wavelengths. Non-linear convective models (e.g. Bono et al 1999; Caputo et al 2000; Caputo 2008) instead predict a larger dependence on the same interval of metallicity: the change is 0.4 mag in V, 0.3 mag in I and 0.2 mag in K, again at log(P) = 1. Moreover, the predicted change in these latter models is such that metal-rich Cepheids are fainter than metal-poor ones, at variance with the results of the linear models. Fiorentino et al (2002) and, more recently, Marconi, Musella & Fiorentino (2005) investigations, also based on non-linear models, suggested that there may be also a dependence on the helium abundance.
On the observational side, the majority of the constraints comes from indirect measurements of the metallicity, mostly in external galaxies, such as oxygen nebular abundances derived from spectra of HII regions at the same Galactocentric distance of the Cepheid field (e.g. Sasselov et al 1997; Kennicutt et al 1998; Sakai et al 2004). These analyses indicate that metal-rich Cepheids are brighter than metal-poor ones (hence at variance with the predictions of non-linear convective models), but it is important to note that the results span a disappointingly large range of values (see Table 1.1 and Fig. 1.8). In order to better constrain a possible dependence of the Cepheid PL relation on the metallicity, a better approach
18The metallicity of an object is the proportion in mass of its matter made up of chemical elements other than hydrogen and
Table 1.1: Overview of recent results for the metallicity sensitivity of Cepheid distances. In the first column is listed the variation of the distance modulus µ per dex of metallicity, the negative sign indicates that the true distance is longer than the one obtained neglecting the effect of the metallicity. In the second column is listed the elemental abundance used as reference for the metallicity. The third and fourth columns give the method and the reference of the different studies. See also Fig. 1.8
δµ/δ[M/H] Method Reference
(mag/dex)
-0.32 ± 0.21 [Fe/H] Analysis of Cepheids in 3 fields of M31 (BVRI bands)
Freedman & Madore (1990) -0.88 ± 0.16 [Fe/H] Comparison of Cepheids from 3 fields of M31
and LMC (BVRI bands) Gould (1994)
-0.40 ± 0.20 [O/H] Simultaneous solution for distances to 17
galaxies (UBVRIJHK bands) Kochanek (1997) -0.44+0.10
−0.20 [O/H] Comparison of EROS observations of SMC
and LMC Cepheids (VR bands)
Sasselov et al. (1997) -0.24 ± 0.16 [O/H] Comparison of HST observations of inner and
outer fields of M101 Kennicutt et al. (1998) -0.12 ± 0.08 [O/H] Comparison of 10 Cepheid galaxies with Tip
of the Red Giant Branch distances Kennicutt et al. (1998) -0.20 ± 0.20 [O/H] Value adopted for the HST Key Project final
result
Freedman et al. (2001) 0 [Fe/H] OGLE result comparing Cepheids in IC1613
and MC (VI bands) Udalski et al. (2001) 0 [O/H] Comparison of Planetary Nebula luminosity
function distance scale and Surface Bright-ness fluctuation distance scale
Ciardullo et al. (2002)
-0.24 ± 0.05 [O/H] Comparison of 17 Cepheid galaxies with Tip
of the Red Giant Branch distances Sakai et al. (2004) -0.21 ± 0.19 [Fe/H] Baade-Wesselink analysis of Galactic and
SMC Cepheids (VK bands)
Storm et al. (2004) -0.23 ± 0.19 [Fe/H] Baade-Wesselink analysis of Galactic and
SMC Cepheids (I band) Storm et al. (2004) -0.29 ± 0.19 [Fe/H] Baade-Wesselink analysis of Galactic and
SMC Cepheids (W index)
Storm et al. (2004) -0.27 ± 0.08 [Fe/H] Compilation from the literature of distances
and metallicities of 53 Galactic and MC Cepheids (VIWK bands)
Groenewegen et al. (2004)
-0.39 ± 0.03 [Fe/H] Cepheid distances to SNe Ia host galaxies Saha et al. (2006) -0.29 ± 0.09 [O/H] Cepheids in NGC 4258 and [O/H] gradient
from Zaritsky et al. (1994)
Macri et al. (2006) -0.10 ± 0.03 [Fe/H] Weighted mean of Kennicutt, Macri and
Groenewegen estimates Benedict et al. (2007) -0.017 ± 0.113 [O/H] Comparison between Cepheid and TRGB
dis-tances for 18 galaxies Tammann et al. (2007) 0 [Fe/H] Comparison between the slopes of Galactic
and LMC Cepheids
Fouqu´e et al. (2007) +0.05 ± 0.03 [Fe/H] Predicted Period-Wesenheit (V, I) relation Bono et al. (2008)
1.6. PERIOD-LUMINOSITY RELATION 15
Figure 1.8: Comparison of recent results for the metallicity sensitivity of Cepheid distances. FM1990: Freedman & Madore (1990); G1994: Gould (1994); Ko1997: Kochanek (1997); S1997: Sasselov et al. (1997); Ke1998: Kennicutt et al. (1998); F2001: Freedman et al. (2001); U2001: Udalski et al. (2001); C2002: Ciardullo et al. (2002); Sa2004: Sakai et al. (2004); Sto2004: Storm et al. (2004); Gro2004: Groenewegen et al. (2004); M2006: Macri et al. (2006); Sah2006: Saha et al. (2006); Be2007: Benedict et al. (2007); Fo2007: Fouqu´e et al. (2007); Tam2007: Tammann et al. (2007); B2008: Bono et al. (2008). See Table 1.1
is to measure directly the metal content of Cepheid stars, which, so far, has been attempted only by few studies, primarily focused on stars of our own Galaxy (cf Fry & Carney 1997; Andrievsky et al 2002a, 2002b, 2002c and 2004; Luck et al 2003). Fry & Carney (1997, hereafter FC97), for instance, have derived iron and α element19abundances for 23 Galactic Cepheids from high resolution and high
signal-to-noise spectra. They found a spread in [Fe/H]20 of about 0.4 dex, which they claim it is real.
With approximately half of their sample (stars belonging to clusters or associations) they have made a preliminary evaluation of metallicity effects on the zero point of the PL relation, finding that metal-rich Cepheids are brighter than metal-poor ones at the same period. Thus, finding a result similar to the stud-ies based on indirect measurements of the metallicity.
The impressive observational effort carried out by Andrievsky and collaborators (Andrievsky et al 2002a, 2002b, 2002c; Luck et al 2003; Andrievsky et al 2004) has instead taken advantage of high resolution spectra of 130 Galactic Cepheids (collected with different instruments at different telescopes) in order to determine their chemical composition and study the Galactic abundance gradient (see also section 1.7). In relation to our work, it is important to note that Andrievsky and collaborators did not investigate the effects of the chemical composition on the Cepheid PL relation: on the contrary, they used the PL relation to determine the distances of their stars. Outside our Galaxy, Luck & Lambert (1992, hereafter LL92) have studied 10 Cepheids in the Magellanic Clouds (5 in LMC and 5 in the SMC). For LMC, they found a mean [Fe/H] of −0.36 dex with a dispersion of 0.3 dex, while for the SMC the mean [Fe/H] is −0.6 dex with a rather small dispersion (less than 0.15 dex). In subsequent investigation, Luck et al. (1998, hereafter L98), based on ten LMC Cepheids and six SMC Cepheids, four of which in common with LL92, confirmed the mean [Fe/H] value of LMC (−0.30 dex), found very little evidence of a signif-icant metallicity dispersion in the LMC (contrary to LL92, but similarly to the SMC) and slightly revised downwards the mean [Fe/H] of the SMC (−0.74 vs −0.60 from LL92).
It is worth mentioning two studies that have followed slightly different approaches. Groenewegen et al (2004) have selected from the literature a sample of 37 Galactic, ten LMC and six SMC Cepheids for which individual metallicity estimates and BVIK photometry were known. Their work aimed at in-vestigating the metallicity dependence of the PL relation using individual metallicity determinations as well as good individual distance estimates for Galactic Cepheids. They inferred a metallicity effect of about −0.27 ± 0.08 mag/dex in the zero point in the V, I, K bands and the Wesenheit index W21, in
the sense that metal-rich Cepheids are brighter than the metal-poor ones (see Table 1.1 and Fig. 1.8, for a comparison with other studies). Also Storm et al (2004) discussed the effect of the metallicity on the PL relation using 34 Galactic and five SMC Cepheids, for which they determined accurate individ-ual distances with the Baade-Wesselink method. Using an average abundance for the SMC Cepheids of [Fe/H] = −0.7 and solar metallicity for the Galactic ones, they determined, in a purely differential way, the following corrections: −0.21 ± 0.19 mag/dex for the V and K bands, −0.23 ± 0.19 mag/dex for the I band and −0.29 ± 0.19 mag/dex for the Wesenheit index W. These are in quite good agreement with Groenewegen et al (2004). More recently Macri et al. (2006) found, by adopting a large sample of Cepheids in two different fields of NGC 4258 and the [O/H] gradient based on HII regions provided by Zaritsky et al. (1994), a metallicity effect of γ = −0.29 ± 0.09 mag/dex. This galaxy has been adopted as a benchmark for estimating the metallicity effect, since an accurate geometrical distance based on water maser emission is available (Herrnstein et al. 2005). However, in a thorough investigation Tammann et al. (2007) suggested that the flat slope of the Period-Color relation of the Cepheids located in the inner metal-rich field could be due to a second parameter, likely helium, other than the metal abundance. Furthermore, Bono et al. (2008) found, using the new and more accurate nebular oxygen abundances
19Isotopes that are integer multiples of the mass of the helium nucleus: C, O, Mg, Si, S, Ar, Ca, Ti 20[Fe/H]=log
10(Zstar/Z¯), where Z¯=0.0198
21Reddening-free index defined as: W = V − 2.42 · (V − I), where 2.42 is the value of AV E(V−I).
1.7. THE DISK ABUNDANCE GRADIENT 17
for a good sample of HII region in NGC4258 provided by D´ıaz et al. (2000), a shallower abundance gradient. In particular, the new estimates seem to suggest that both the inner and the outer field might have a mean oxygen abundance very similar to LMC. They also found a very good agreement between predicted and observed Period-Wesenheit (V, I) relation. Nonlinear convective models predict for this relation a metallicity effect of γ = +0.05 ± 0.03 mag/dex. On the basis of independent distances for 18 galaxies based on Cepheid and on the Tip of the Red Giant Branch, Tammann et al. (2007) found a small metallicity effect ( γ = 0.017±0.113 mag/dex). On the other hand, Fouqu´e et al. (2007) using a sample of 59 Galactic Cepheids whose distances were estimated using different methods - HST trigonometric par-allaxes (Benedict et al. 2007), revised Hipparcos parpar-allaxes (van Leeuwen et al. 2007), infrared surface brightness method (Fouqu´e & Gieren 1997), and interferometric Baade-Wesselink method (Kervella et al. 2004), zero-age-main-sequence fitting of open clusters (Turner & Burke 2002) - found no significant difference between optical and Near-Infrared (NIR) slopes of Galactic and LMC Cepheids (Udalski et al. 1999; Persson et al. 2004).
Despite these ongoing observational efforts, it is important to underline that none of the observational studies undertaken so far has directly determined elemental abundances of a large sample of Cepheids in order to explicitly infer the metallicity effect on the PL relation, taking advantage of a sample that has been homogeneously analyzed. Therefore, this kind of analysis is the necessary step to improve our knowledge about the metallicity effect and put tight constraints to the theoretical models. The novelty of our approach consists exactly in this, i.e. in the homogeneous analysis of a large sample of stars (more than 300) spanning a factor of ten in metallicity and for which we have high-resolution and high-signal-to-noise spectra and optical and NIR photometry. Preliminary results based on a subsample of the data discussed here were presented by Romaniello et al. (2005) and Romaniello et al. 2008.
1.7 The disk abundance gradient
Abundance gradients as observational characteristics of the Galactic disc are among the most important input parameters in any theory of Galactic chemical evolution. Chemodynamical evolutionary models provide interesting predictions concerning the formation and evolution of the Milky Way. However, the plausibility and accuracy of these predictions need to be validated with observational data. Further de-velopment of theories of Galactic chemodynamics is dramatically hampered by the scarcity of this obser-vational data, their large uncertainties and, in some cases, apparent contradictions between independent observational results. For these reasons, many questions concerning the present-day abundance distribu-tion in the galactic disc, its spatial properties, and evoludistribu-tion with time, still have to be answered. The most commonly adopted observables are the star formation rate and the abundance gradients across the Galactic disk. In recent years the problem of radial abundance gradients in spiral galaxies has emerged as a central problem in the eld of Galactic chemodynamics.
1.7.1 A brief review
Abundance gradients were discovered first by Searle (1971) in six external galaxies using HII regions. However, their occurrence in our Galaxy remained controversial as they are not easy to observe due to the fact we are embedded in the Galactic disk. Other discussions of the galactic abundance gradient, as
determined from several studies, were provided by Friel (1995), Gummersbach et al. (1998), Hou et al. (2000). Here we briefly summarize some of the more pertinent results.
1. A variety of objects (planetary nebulae, cool giants/supergiants, F-G dwarfs, old open clusters) seem to give evidence that an abundance gradient exists. Using DDO, Washington, UBV pho-tometry and moderate resolution spectroscopy combined with metallicity calibrations for open clusters and cool giants the following gradients were derived (d[Fe/H]/dRG): -0.05 dex kpc−1
(Janes 1979), -0.095 dex kpc−1(Panagia & Tosi 1981), -0.07 dex kpc−1(Harris 1981), -0.11 dex
kpc−1 (Cameron 1985), -0.017 dex kpc−1 (Neese & Yoss 1988), -0.13 dex kpc−1 (Geisler et al.
1992), -0.097 dex kpc−1 (Thogersen et al. 1993), -0.09 dex kpc−1 (Friel & Janes 1993), -0.091
dex kpc−1(Friel 1995), -0.09 dex kpc−1(Carraro et al. 1998), -0.06 dex kpc−1(Friel 1999; Phelps
2000). The slopes based on old Open Clusters still show a large spread. By adopting a sample of 40 clusters distributed between the solar circle and RG ∼ 14 kpc, Friel et al. (2002) found a slope of -0.06 dex kpc−1. More recently, Carraro et al. (2007) using new accurate metal abundances
for five old open clusters located in the outer disk together with the sample adopted by Friel et al. (2002) found a much shallower global iron gradient, namely -0.018 dex kpc−1. One must also
add that there have been attempts to derive the abundance gradient (specially d[Fe/H]/dRG) using high-resolution spectroscopy of cool giant and supergiant stars. Harris & Pilachowski (1984) ob-tained -0.07 dex kpc−1, while Luck (1982) found a steeper gradient of -0.13 dex kpc−1. The latest
slopes based on Planetary Nebulae range from -0.05 dex kpc−1(Costa et al., 2004) to the lack of a
Galactic metallicity gradient (Stanghellini et al., 2006). Oxygen and sulphur gradients determined from observations of planetary nebulae are -0.058 dex kpc−1 and -0.077 dex kpc−1 respectively
(Maciel & Quireza 1999), with slightly flatter values for neon and argon, as in Maciel & K ¨oppen (1994). A smaller slope was found in an earlier study of Pasquali & Perinotto (1993). According to those authors the nitrogen abundance gradient is -0.052 dex kpc−1, while that of oxygen is -0.030
dex kpc−1.
2. From young B main sequence stars, Smartt & Rolleston (1997) found a gradient of -0.07 dex kpc−1, while Gehren et al. (1985), Fitzsimmons et al. (1992), Kaufer et al. (1994) and
Kilian-Montenbruck et al. (1994) derived significantly smaller values: -0.03 - 0.00 dex kpc−1. No
sys-tematic abundance variation with Galactocentric distance was found by Fitzsimmons et al. (1990). The studies of Gummersbach et al. (1998) and Rolleston et al. (2000) support the existence of a gradient (-0.07 dex kpc−1). The elements in these studies were C − N − O and Mg − Al − S i. More
recently, Daflon et al. (2004) obtained a slope value of -0.042 dex kpc−1.
3. Studies of the abundance gradient (primarily nitrogen, oxygen, sulphur) in the Galactic disc based on young objects such as HII regions give positive results: either significant slopes from -0.07 to -0.11 dex kpc−1according to: Shaver et al. (1983) for nitrogen and oxygen, Simpson et al. (1995)
for nitrogen and sulphur, Rudolph et al. (1997) for nitrogen and sulphur, or intermediate gradients of about -0.05 to -0.06 dex kpc−1 according to: Simpson & Rubin (1990) for sulphur, Aerbach et
al. (1997) for oxygen and sulphur; and negative ones: weak or nonexistent gradients as concluded by Fich & Silkey (1991); Vilchez & Esteban (1996), Rodriguez (1999). Pe ˜na et al. (2000) derived oxygen abundances in several HII regions and found a rather flat distribution with Galactocentric distance (coefficient -0.04 dex kpc−1). The same results were also reported by Deharveng et al.
(2000).
4. From a theoretical point of view, Cescutti et al (2007), modeled the abundance gradients in the disk for several chemical elements (O, Mg, Si, S, Ca, Sc, Ti, Co, V, Fe, Ni, Zn, Cu, Mn, Cr, Ba,