i
SCUOLA DI SCIENZE
Dipartimento di Chimica Industriale “Toso Montanari”
Corso di Laurea Magistrale in
Chimica Industriale
Classe LM-71 - Scienze e Tecnologie della Chimica Industriale
Purification and preliminary structural
characterization by NMR spectroscopy of
“HoLaMa” DNA Polymerase
CANDIDATO
Sara Caramia
RELATORE
Prof. Alejandro Hochkoeppler
CORRELATORE
Dott.sa Alessandra Stefan Prof. Michael Kovermann (Konstanz University)
________________________________________________________________________________________________________________________
Anno Accademico 2017-2018
________________________________________________________________________________________________________________________
ii
INDEX
1. INTRODUCTION ... 1
-1.1 Mechanism of polymerase reaction ... - 2 -
1.2 HoLaMa ... - 4 -
1.3 Production of recombinant proteins ... - 6 -
1.3.1 Host strain ... - 6 -
1.3.2 pBAD expression vector ... - 6 -
1.4 Nucleic acids ... - 8 -
1.5 NMR ... 9
-2. AIM OF THE WORK ... - 16 -
3. MATERIALS AND METHODS ... - 17 -
3.1 Bacterial strain ... - 17 -
3.2 Medium ... - 17 -
3.3 Buffers ... - 17 -
3.4 Expression protocol ... - 17 -
3.5 Evaluation of bacterial growth ... - 18 -
3.6 Extraction of proteins ... - 19 -
3.7Ultrafiltration ... - 19 -
3.8 Purification steps ... - 20 -
3.9 Affinity chromatography: Cibacron blue resin ... - 21 -
3.10 Affinity chromatography: HiTrap Heparin HP ... - 21 -
3.12 Anion exchange chromatography: HiTrap Q HP ... - 23 -
3.13 Determination of protein concentration ... - 24 -
3.14 SDS-PAGE ... - 24 -
3.15 NMR ... 26
4. RESULTS AND DISCUSSION ... 28
iii
4.2 First purification procedure ... - 28 -
4.3 Second purification ... - 33 -
4.4 Third purification ... - 39 -
4.5 NMR ... 43
5. CONCLUSION ... 52
-iv
Abstract
HoLaMa is a Klenow sub-fragment lacking the 3’-5’ exonuclease domain, whose gene codes for residues 515-928 of Escherichia coli DNA polymerase I. The enzyme was designed in a previous study starting from different Klenow enzymes, with the aim of studying a mini-DNA polymerase with NMR spectroscopy.
In the present work, we studied a new purification protocol for the production of HoLaMa in order to obtain an appropriate quantity for NMR analysis. We tested three different purification procedure and at the end, we collected 5.8 mg of HoLaMa (Volume 1.8 mL, concentration 67 μM).
After the purification, we started the study of HoLaMa by NMR spectroscopy, focusing on the nature of enzyme-substrate interactions and studying the kinetics of the reaction. Our preliminary studies were designed to understand the characteristic NMR signals of HoLaMa under different conditions of temperature and buffer; finally, we also focused our analysis on the interactions between protein, DNA and nucleotides.
- 1 -
1. INTRODUCTION
DNA polymerases are enzymes universally responsible for replication and repair of DNA. These enzymes vary in sequence and structure depending on their cellular function.
In Escherichia coli there are 5 different DNA polymerases, i.e. I, II, III, IV and V. DNA polymerase II possesses both 5’→3’ polymerase and 3’ → 5’ exonuclease (proofreading) activities. It features good fidelity of replication and very low processivity.1,a
DNA polymerase III is the largest polymerase, composed by 10 different subunits, it is expressed in a low number of copies in E. coli (about 20) but sustains a very high reaction rate.2,1
DNA polymerase IV and V are enzymes involved in DNA repair mechanisms in bacteria, and they are expressed during the SOS response.3
DNA polymerase I is the most abundant in E. coli (about 400 copy/cell), and was the first discovered DNA polymerase (by A. Kornberg in 19564).
DNA pol I is composed of 928 amino acids, accounting for a molecular mass equal to 103 kDa5,6.
E. coli DNA pol I is competent in 3 distinct functions:
5’→3’ exonuclease activity, provided by amino acids 1-323 3’→5’ exonuclease activity, provided by amino acids 324-517 5’→3’ polymerase activity, provided by residues 521-928.
Its tertiary structure looks like an open right hand, with the 3’-5’ exonuclease domain protruding from the palm.4
Proteolytic treatment splits DNA pol I into two fragments, i.e. containing the 1-232 a.a. and 324-928 a.a., respectively; the largest fragment is called Klenow enzyme (containing the 3’→5’ exonuclease and 5’→3’ DNA polymerase domains), and is characterized by a molecular mass equal to 68 kDa. The exonuclease activity is necessary to remove incorrect nucleotides at the end of the DNA chain by hydrolysis of the phosphodiester bond between the 3′-hydroxyl (-OH) and the 5' phosphate group.
a An important characteristic of DNA polymerases is the processivity, defined as the average
number of nucleotides added by the enzyme after binding to and before dissociating from the DNA substrate.
- 2 -
FIG 1: Structure of DNA polymerase I of Thermus aquaticus (Taq): the structural elements of fingers, thumb and palm are shown; fingers and thumb recognize and lock the DNA in the right position near the active site, for the extension reaction, inside the palm.
1.1 Mechanism of polymerase reaction
The mechanism of DNA polymerase action occurs in four steps, accompanied by conformational changes of the enzyme: binding of the DNA, of a deoxynucleoside triphosphate (dNTP), phosphodiester bond formation, and pyrophosphate release.
In the first step, the binding of the double‐stranded primer/template substrate to the enzyme is followed by a conformational change of the thumb domain to wrap the DNA. Important interactions occur at the end of the primer, in order to position it in proximity of the active site (palm domain).7
In the second step, the dNTP binds to the binary enzyme-DNA complex and during this step the enzyme is able to discriminate between correct versus incorrect nucleotides. The negative charge of the dNTP interacts with positively charged amino acids, i.e. Arg754, Lys758, Arg682 and with the two Mg2+ ions coordinated with Asp705 and Asp882;
- 3 -
A further conformational change from the open to the closed state is achieved by the rotation of the O-helix, located in the fingers domain. In this closed ternary complex, an active state is reached with all components in place for the catalysis of the phosphodiester bond formation.
In the third step, two divalent metal ions are involved (Mg2+ A and B, respectively), both of them are coordinated by the oxygen of the triphosphate of an incoming dNTP and the carboxyl oxygen of a residue in the active site, thus stabilising the structure and charging of the expected pentacovalent transition state. 8,7
Ion A activates the terminal 3’-OH group of the primer to facilitate the nucleophilic attack to the α‐phosphate of the dNTP.
The fourth step is the release of pyrophosphate, which is assisted by the metal ion B and involves another conformational change, from a close to an open state.
During the opening of the fingers domain, DNA-Pol I translocates to ensure the processivity of the reaction.
The scheme of the reaction catalysed by DNA polymerases is:
dNTP + DNAn PPi + DNAn+1
dNTP - deoxynucleotide triphosphates PPi - inorganic pyrophosphate
FIG 2: Schematic structure of the DNA polymerase I active site.
- 4 -
1.2 HoLaMa
HoLaMa is a Klenow sub-fragment lacking the 3’-5’ exonuclease domain, whose gene codes for residues 515-928 of Escherichia coli DNA polymerase I. The enzyme was designed in a previous study by Alejandro Hochkoeppler, Fabio Lapenta and Cristina Elisa Martina, thanks to protein engineering and analysis of different tertiary structures of the Klenow enzyme stored in the “RCSB Protein Data bank”: 2KZZ [BRAUTIGAM CA 1999]9, 1D8Y [TEPLOVA M 1999]10, 1KFD [BEESE LS 1993], 1DPI [OLLIS DL 1985].
The first modification planned was to eliminate the 3’-5’ exonuclease domain (from amino acid M324 to H519), but this deletion was thought to produce a Klenow sub-fragment featuring very low solubility, probably due to the exposure to the solvent of the α-helix G521-N543 (normally interacting with the exonuclease domain) which does contain some hydrophobic amino acids.
Some specific mutations were therefore inserted with the aim to confer to HoLaMa satisfactory solubility in water:
P522E L523K F526E M531R V534E P535R
To verify the stability of HoLaMa upon the introduction of these site-specific mutations, the energy scoring functions of DeepView and Foldit were used.
Few other specific site-specific mutations were then introduced to optimize the protein:
K520M L561K L646D L744C C907S
The mutation of lysine with methionine (K520M) was introduced to provide the start codon to the gene coding for HoLaMa.
The two leucines (L561 and L646) were partially exposed to the solvent, while the new substitutions with lysine and aspartic acid should increase the enzyme solubility (L561K and L646D).
L744C and C907S mutations were designed to obtain a protein useful for FRET studies, hence a new cysteine inside the fingers domain was introduced and the only natural cysteine present was substituted (C907S).
- 5 -
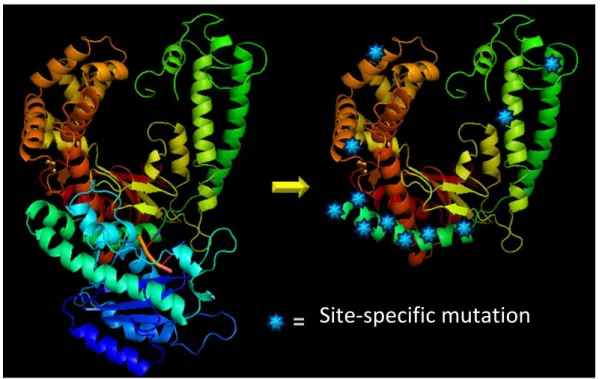
The final primary structure of HoLaMa is here reported:
METGERNVEE NIERPLERVL SRIERNGVKI DPKVLHNHSE ELTKRLAELE KKAHEIAGEE FNLSSTKQLQ TILFEKQGIK PLKKTPGGAP STSEEVLEEL ALDYPLPKVI LEYRGLAKLK STYTDKLPDM INPKTGRVHT SYHQAVTATG RLSSTDPNLQ NIPVRNEEGR RIRQAFIAPE DYVIVSADYS QIELRIMAHL SRDKGLLTAF AEGKDIHRAT AAEVFGCPLE TVTSEQRRSA KAINFGLIYG MSAFGLARQL NIPRKEAQKY MDLYFERYPG VLEYMERTRA QAKEQGYVET LDGRRLYLPD IKSSNGARRA AAERAAINAP MQGTAADIIK RAMIAVDAWL QAEQPRVRMI MQVHDELVFE VHKDDVDAVA KQIHQLMENS TRLDVPLLVE VGSGENWDQAH.5
FIG 3: 3D view of the Klenow fragment and HoLaMa with site-specific mutation
Two different variants of HoLaMa were designed, bearing or not a hexahistidine tag at the N-terminal of the protein; in a previous work, only HoLaMaHis-tagged was produced and tested in kinetic assays.
- 6 -
1.3 Production of recombinant proteins
With the term “recombinant protein”, it is denoted a manipulated form of a protein whose gene is carried by a recombinant DNA (usually an expression vector) and whose production takes place inside an organism called host.
Many steps are needed for obtaining a recombinant protein: i) the cloning of the gene into an appropriate expression vector; ii) the insertion of the construct inside the most suitable host (by transformation); iii) the induction of the protein overexpression and iv) the purification of the target protein and its characterization.
The synthetic gene coding for the truncated form of the Klenow Fragment, i.e. HoLaMa, was cloned into the expression vector pBADHisB (see below) and the host chosen for protein expression was Escherichia coli TOP10.
1.3.1 Host strain
Escherichia coli is a Gram-negative, facultative anaerobic, rod-shaped bacterium of the
genus Escherichia that is commonly found in the lower intestine of humans and animals. It is the most widely studied prokaryotic model, and represents an important microorganism in biotechnology and microbiology, where it is commonly used as a host for the over-expression of recombinant proteins.
The bacterium can be easily grown with inexpensive media in a laboratory setting, using a wide variety of carbon sources. Under favourable conditions, E. coli features fast growth rate and it takes only 20 minutes to reproduce.
In this work, we used Luria-Bertani (LB) medium supplemented with ampicillin (100 µg/mL).
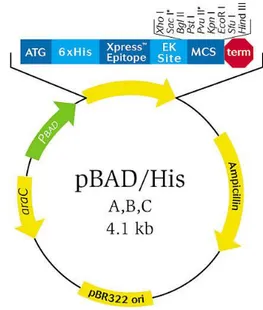
1.3.2 pBAD expression vector
The optimized gene coding for HoLaMa was cloned into the pBADHisB expression vector (Invitrogen), using NcoI and PstI restriction enzymes, yielding pBAD-HoLaMa construct devoid of the hexahistidine-tag sequence.
A vector is a plasmid, that means a small, circular, double-stranded DNA molecule which is autonomously replicated from the chromosomal DNA.
- 7 - In nature, cells can contain a variable amount and type of plasmids, carrying genes that may be useful to the microorganism under particular conditions, and they may guarantee its survival, e.g. supplying antibiotic resistance.
Artificial plasmids serve as important tools in genetics and biotechnology, where they are commonly used to clone and over-express target genes. Expression plasmids used to this aim contain specific features: a gene conferring resistance to specific antibiotics (ampicillin is frequently used for bacterial strains), an origin of replication to allow the bacterial cells to
replicate the plasmid DNA, and suitable restriction sites for the cloning. Many plasmids are commercially available for a wide range of uses.
For the production of HoLaMa, the pBADHisB vector was chosen, which contains an arabinose-inducible promoter (araBAD) able to control the protein expression. In particular, the ara promoter is part of the arabinose operon, found in many bacteria and containing araB, araA and araD genes responsible for the production of enzymes, needed for the catabolism of arabinose as carbon source and the arabinose transporters (araE and araFGH). Using this vector, the induction of protein expression is possible by adding L-arabinose to the growth medium. In our experiments, we used 1 mM arabinose as inducer of HoLaMa production.
The araBAD promoter is positively and negatively regulated by the regulatory AraC protein, whose gene is also present in the plasmid (figure 4).
- 8 -
1.4 Nucleic acids
In nature, there are two different nucleic acids: DNA (DeoxyriboNucleic Acid) and RNA (RiboNucleic Acid). They are bio-macromolecules formed by two antiparallel strands (DNA) or by a single strand (RNA). Each strand consists of deoxyribose/ribose units linked by a phosphodiester bond, this link connecting each 3'-hydroxyl-group of the carbohydrate moiety to the next 5'-phosphate-group. Therefore, a single filament has two different ends, a free 3'-OH called 3'-end, and a free 5'-phosphate group, called the 5'-end. DNA can be synthesized only in the 5’- 3’ direction.
Each pentose unite is linked at the C1’, via N-glycosidic bond, with a nitrogenous base (nucleobase), i.e.:
– purines: adenine and guanine;
– pyrimidines: cytosine and thymine (only for DNA), cytosine and uracil (only for RNA).
The two strands of DNA are annealed to each other via hydrogen bonding between the nucleobases (C ≡ G, A = T).
The function of DNA is to transfer the genetic information from one generation to the next, thanks to transcription and translation steps.
- 9 -
1.5 NMR
A NMR (Nuclear Magnetic Resonance) spectrum is a plot of the intensity of emission (or absorption) against chemical shift (δ). Although the absolute resonance frequency depends on the applied magnetic field, the chemical shift is independent of the field strength; therefore, the positions of the peaks do not change with the magnetic field. On the other hand, the resolution of the spectrum will increase with the applied magnetic field. The equation:
Describes the chemical shift, where νsample is the resonance frequency of the sample and
νref is the resonance frequency of a standard reference compound present in the sample
(both frequencies ν, measured in the same magnetic field B0).
The molecules are placed in a magnetic field, after a relaxation delay (tr), where the spin
of the atoms aligns along the field in parallel or anti-parallel way, radio frequency pulses (60-1000MHz) are applied, the active nuclei respond and they emit a free induction decay (FID) which is then recorded in acquisition time (tacq).
The spectrum is obtained thanks to the Fourier transformation that converts the FID into a frequency domain.
NMR analysis can be used to give information about the distances between atoms in a protein, and to predict the tertiary structure; it is also possible to study the fold/unfold conformation of proteins and their dynamics in solution11.
Most structure determinations used the proton NMR spectrum, but for larger proteins it is necessary to interpreted also 13C spectrum and 15N spectrum (1H, 13C, 15N are NMR active nuclei with magnetic moment: nuclear spin IV, I=1/2V); to do this, it is essential to growth the recombinant microorganism, producing the target protein, in a proper medium enriched with these isotopes.12
The first experiments in the nuclear magnetic resonance spectroscopy of proteins, were one-dimensional NMR, where it is possible to observe only one kind of nuclear species at a time. However, these type of spectra are very difficult to interpret because of the
- 10 -
overlapping signals of many hydrogens inside the proteins; to improve the technique, an important development was the introduction of two dimensional NMR.13
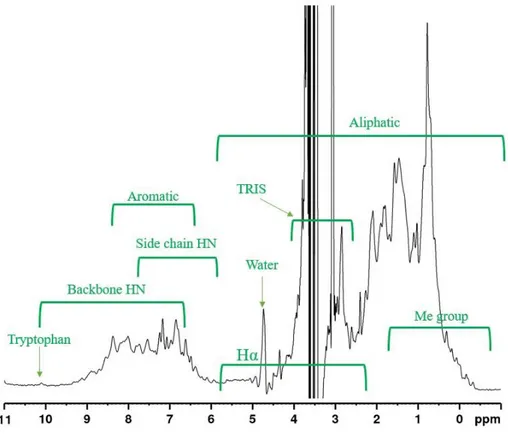
In the figure 6 we can see the dispersion of different groups, usually present in a protein in a typical 1D-HNMR. The specific peaks around 10 ppm correspond to the H of indole group of tryptophan. The peak around 4.7 ppm stems from the water (D2O)
presents in the sample: when protein spectrum is collected with D2O most signals of
proteins (backbone amide proton, side chain amide, amino proton, hydroxyl and carboxyl protons) disappear.
FIG 6: 1D H-NMR spectrum of HoLaMa in Tris Buffer with 5% v/v D2O (standard), at 600 MHz. T=293K, pH 8,
- 11 -
FIG 7: Four different amino acid, Alanine (A), Tryptophan (W), Lysine (K) and Phenylalanine (L) which show the different groups who we can find in the NMR spectrum.
Signal dispersion of NMR spectra is an indicator for whether a protein is natively folded or partially unfolded. In unfolded/folded proteins, the signal for backbone amide and for methyl group changes the chemical shift position, for example the backbone amide in unfolded proteins is present only between 8-8.5 ppm while in folded proteins it will be found in general in the range between 8.5-12 ppm ( depends on the relative abundance of α-helix, β-strand, random coil)
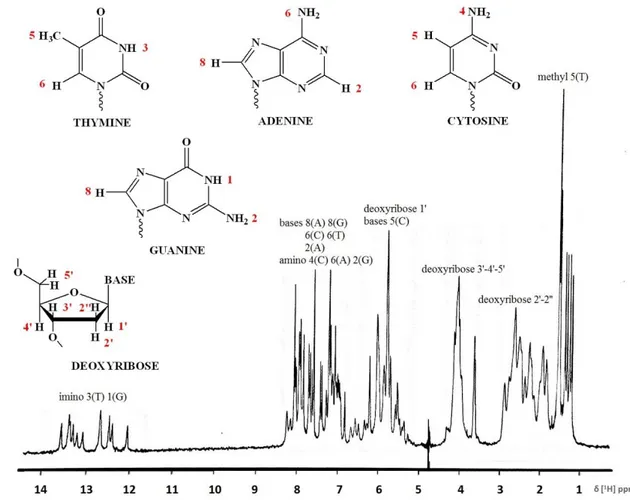
The characteristic signal for DNA in the 1H-NMR spectrum are reported: 1-1.5 ppm, methyl group of thymine
1.5-3 ppm, 2’ protons present on the deoxyribose
3.5-5 ppm, all other ring protons present in 1’, 3’, 4’ and 5’ position of the ring 5.5-8.5 ppm, aromatic protons of the bases
7-8.5 ppm, amino protons
11 ppm, imino protons in DNA hairpin loop structure 12-14 ppm, imino protons in DNA duplex structure 15-16 ppm, imino protons in DNA triplex structure
- 12 -
FIG10 8 :Proton spectrum of double-stranded DNA (24 nucleotides) in 90:10 – H2O:D2O
In protein-DNA complexes, most of the DNA signals overlap with protein signals; however, the imino DNA protons are distinguishable and are located in the region around 11-16 ppm.
In two-dimensional NMR, peaks have two frequency coordinates, representing any combination of chemical shift (and/or other property for diffusion of molecules in the solution). All 2D experiments have the same basic format sequence of actions:
a) Preparation b) Evolution c) Mixing d) Detection
- 13 -
FIG 9: Scheme for 2D experiment (P-preparation, E-evolution, M-mixing, D-detection)
During the preparation and the mixing periods it can be performed a pulse depending on the nature of the experiment. The detection period is the same as for the 1D experiment, during which the instrument collects the FID.
The evolution period provides the key for the generation of the second dimension: the initial 90°x pulse places the equilibrium magnetization in the x-y plane along the +y
axis, after which it will evolve according to this chemical shift offset. After a time period, t1, the vector is moved through an angle of 360°νt1 and is then subjected to the
second 90°x pulse. This second pulse places the y-component along the z-axis while the
x-component remains in that plan and produces the detective FID. This experiment is repeated a number of times with the t1 interval increased by a uniform amount each
time, and the resulting FID stored separately.14
NOE: Nuclear Over-hauser effect, this technique allows to detect the spatial proximity among nuclei in a molecule
- 14 -
The NOE may be defined as the change in intensity of one resonance when the spin transitions of another resonance are somehow perturbed from their equilibrium populations. The perturbation of interest usually corresponds to either a saturation of a resonance signal, that is equalized to the spin population (α and β) difference across the corresponding transitions or, alternatively, to a selected pulse applied at 180 ° which inverts the spin populations.
After change population levels, the system will relax back to the equilibrium population state, altering the population level of other spin.
The enhancement of NOE is expressed as a relative intensity change between the equilibrium intensity I0 and that in the presence of the NOE I:
indicates the NOE observed for spin I when spin S is perturbed.
The intensity and sign of the NOESY effect depend on the tumbling rate of the molecule in solution: small molecules have positive NOESY (i.e.: the signal intensity increases) while large molecules (biological molecules) have negative NOESY (the signals intensity decreases).14
In a NOESY spectrum the cross peaks are generated by cross relaxation, thus indicating that there are cross relaxations between close spins.
- 15 -
The NOESY pulse sequence is shown in the figure the first part of the sequence is composed by 90°-t1-90° sequence, following initial excitation and t1 evolution, the
magnetization vector exists in the transverse plane. The second 90° pulse places one component of this vector onto the –z-axis and therefore generates the required population inversion that enable transition NOEs to develop during the sequence mixing period. After tm, the new population is sampled with a 90° pulse and the FID collected.
(the component that remain in the transverse plane are those detected in the COSY -correlation spectroscopy- experiment)15
- 16 -
2. AIM OF THE WORK
The aim of this work was to study the artificial enzyme HoLaMa, a sub-fragment of the Klenow DNA polymerase of Escherichia coli. The project was divided into two parts carried out at the Department of Industrial Chemistry of the University of Bologna, and at the Department of Chemistry of the Konstanz University (Germany).
During the first part of the experimental work we tried to define a new efficient protocol for the production of HoLaMa in order to obtain an appropriate quantity for NMR analysis. In a previous study, the synthetic gene coding for HoLaMa was cloned and its expression in E. coli was optimized. Starting from these data, we tried to define a proper purification protocol since the previous one, including a precipitation step with ammonium sulphate, led to a degradation of HoLaMa into two fragments (likely due to a contaminant protease).
The aim of the second part was the study of HoLaMa by NMR spectroscopy, focusing on the nature of enzyme-substrate interactions and studying the kinetics of the reaction. Our preliminary studies were designed to understand the characteristic NMR signals of HoLaMa under different conditions of temperature and buffer; finally, we also focused our analysis on the interactions between protein, DNA and nucleotides.
- 17 -
3. MATERIALS AND METHODS
3.1 Bacterial strain
Escherichia coli TOP10 (Invitrogen)
Genotype: F- mcrA ∆(mrr-hsd RMS-mcrBC) φ80lacZ∆M15 ∆lacX74 recA1 araD139
∆(araA-leu)7697 galU galK rpsL endA1 nupG.
3.2 Medium
Luria-Bertani (LB) medium contains tryptone, the enzymatic digestion (by trypsin) product of casein, yeast extract, rich in vitamins and other nutrients, and sodium chloride. The concentration of the different components is: 10, 5, and 10 g/L of tryptone, yeast extract, and sodium chloride, respectively.
3.3 Buffers
Buffer A: 50 mM TrisHCl, 50 mM NaCl, 1 mM EDTA, pH 8 Buffer B: 50 mM TrisHCl, 2 M NaCl, 1 mM EDTA, pH 8 Buffer C: 50 mM TrisHCl, 150 mM NaCl, 1 mM EDTA, pH 8 Lysis buffer: 50 mM TrisHCl, 50 mM NaCl, pH 8
Desalting buffer: 50 mM TrisHCl, 1mM EDTA, pH 8 NMR buffer: 20 mM Na2HPO4, 300 mM NaCl
3.4 Expression protocol
To prepare the pre-inoculum, a single colony of E. coli TOP10/pBAD-HoLaMa from a Petri dish was grown in 5 mL of LB (containing ampicillin 100 g/mL) at 37 °C overnight under shaking (180 rpm). This bacterial culture was diluted (1:500) in a flask containing 250 mL of LB medium with ampicillin, and incubated for 9 h at 30°C. The induction was performed by adding arabinose (1 mM), then cultures were incubated overnight at 30 °C. Cells were harvested by centrifugation at 5000 g at 4 °C for 20 minutes and cells pellets were frozen at – 20 °C.
- 18 -
We produced a total amount of 9 L of induced cultures with a biomass yield of about 4-4,3 g/L.
3.5 Evaluation of bacterial growth
Determining the optical density of a growing culture is a common method to quantify various important culture parameters, e.g. cell concentration or biomass production. The continuous detection of the culture optical density is the most general and powerful tool for pursuing optimal yields and controlling reproducibility in many fermentation strategies.
Photometers quantify the optical density of liquid samples by comparing the intensity of light that has passed through and the intensity of the incident light. In spectroscopy, the absorbance A is usually defined as:
I - Intensity of transmitted light I0 - Intensity of incident light
The optical density depends on path length of the sample.
OD - optical density A - Absorbance
L - Thickness of sample
Generally, the wavelength of choice for estimating bacterial growth is 600 nm.
The OD600nm evaluation of the pre-inoculum culture gives information about cell
concentration and therefore, knowing the initial OD value, one can determine the appropriate dilution of the pre-inoculum to the flask culture.
- 19 -
3.6 Extraction of proteins
Cell pellets (from 2 L of culture) were resuspended in 60 mL of buffer A (Tris-HCl 50 mM, NaCl 50 mM, EDTA 1mM pH 8) with 1mM PMSF (phenylmethylsulfonyl fluoride) as seryl-proteases inhibitor. After resuspension, cells were homogenized on ice with a glass potter, then subjected to 5 sonication cycles at 18 W using a Misonix Sonicator (total time 2 minutes, steps of 15 sec pulse and 15 sec pause).
The sample was centrifuged at 12,000 g for 30 minutes at 4 °C to recover soluble proteins and then filtered.
3.7Ultrafiltration
Ultrafiltration is the process of separating small particles and dissolved molecules from solution based on size exclusion and is frequently used for the separation of proteins from buffer components: buffer exchange, desalting or concentration.
For the concentration of HoLaMa, we used an Amicon Stirred Cell (Millipore) equipped with a semipermeable cellulose membrane with a molecular weight cut-off of 30 kDa (HoLaMa, featuring a molecular weight of 47. kDa, is retained by the ultrafilter).
The cell system is continuously filled with nitrogen gas under low pressure to force the solution through the membrane, while retaining the macromolecules; the magnetic stirring favours the solution concentration, avoiding proteins precipitation.
For the buffer exchange before NMR analysis, we used Vivaspin centrifugal concentrators (volume of 5 ml, Sartorius), with a semipermeable membrane with porous dimension (MWCO) of 10 kDa. The centrifugal force is able to pull particles and solids away from the membrane to the bottom of the tube, while proteins are collected in an impermeable pocket and then recovered.
- 20 -
3.8 Purification steps
Three different procedures were tested and compared. The first purification protocol was attempted with the product of 500 ml of induced E. coli TOP10/pBAD-HoLaMa cultures. The sequence of the chromatographic steps was:
Affinity chromatography with a Cibacron Blue column
Affinity chromatography with a HiTrap Heparin column
Size-exclusion with a Superdex 200 column
Anion exchange with a HiTrap Q HP column
The second protocol was performed using 4 L of induced cultures and the sequence of the chromatographic steps was:
Affinity chromatography with a Cibacron Blue column
Affinity chromatography with a HiTrap Heparin column
Size-exclusion with a Superdex 200 column
Affinity chromatography with a HiTrap Blue HP
For the third procedure we used the pellet of 2 L of induced cultures with the following sequence of chromatographic steps:
Affinity chromatography with a Cibacron Blue column Affinity chromatography with a HiTrap Heparin column Affinity chromatography with a HiTrap Blue HP
- 21 -
3.9 Affinity chromatography: Cibacron blue resin
Blue Sepharose is a group specific adsorbent with affinity for a wide variety of enzymes. The dye ligand, Cibacron Blue F3G-A, is covalently attached to the matrix (agarose) via the triazine part of the dye molecule. Several proteins interact rather specifically with the dye, due to its structural similarity with nucleotide cofactors. The prepacked column HiTrap Blue HP
(5 ml, GE Healthcare Life Science) was washed with 5-10 column volumes (CV) of water and 5-10 CV (25-50 mL) of buffer A (Tris-HCl 50 mM, NaCl 50 mM, EDTA 1 mM pH 8). The sample was then loaded onto the column with a slow flow (0,5-0,4 mL/min) to maximize the binding on the ligand. The elution was done with an increasing salt gradient: 0-50 % buffer B (50 mM TrisHCl, 2M NaCl, 1 mM EDTA) in a volume of 50 mL, applying a flow of 1 mL/min.
The Cibacron Blue 3G column (25 mL resin) was washed with 10 CV with water and then with 10 CV with buffer A (Tris-HCl 50 mM, NaCl 50 mM, EDTA 1 mM pH 8) before loading the sample (flow 0.5 mL/min). The elution was performed with a linear gradient 50 mM -1 M NaCl, using buffer B (50 mM TrisHCl, 2M NaCl, 1mM EDTA) at a flow of 2 mL/min.
3.10 Affinity chromatography: HiTrap Heparin HP
The prepacked HiTrap Heparin column (5 mL, GE Healthcare Life Science) contains Sepharose (brand name derived from Separation-Pharmacia-Agarose) as matrix and it is useful for the purification of proteins with affinity for DNA, since heparin mimics a polynucleotide.
Heparin has two main modes of interaction with proteins. It can operate as an affinity ligand, and also functions as a high capacity cation exchanger, due to its anionic
- 22 -
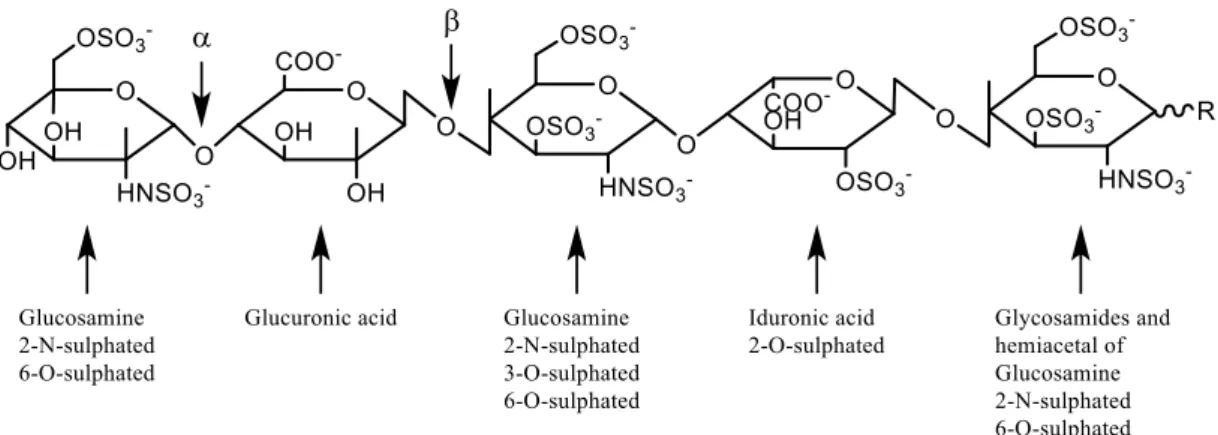
sulphate groups. Heparin is a member of the glycosaminoglycan family of carbohydrates and consists of a variably sulphated repeating disaccharide units, as shown here:
FIG 11: Heparin structure
Before the chromatography, the ionic strength of the sample was reduced by ultrafiltration, to obtain a protein solution with a concentration of NaCl equal to 50 mM.
The column was washed with water (5-10 CV), and equilibrated with 10 CV of buffer A
(Tris-HCl 50 mM, NaCl 50 mM, EDTA 1 mM pH 8).
The sample was loaded onto the column (flow 0,5 mL/min), then a wash step with 10
CV of buffer A was performed.
Proteins were eluted with an increasing salt concentration gradient (50-600 mM) using buffer B (50 mM Tris-HCl, 2M NaCl, 1 mM EDTA) in a volume of 50 mL, using a
flow of 1 mL/min.
3.11 Size exclusion chromatography: Superdex-200
Size-exclusion chromatography, also known as Gel Filtration (GF), is a chromatographic method by which molecules in solution are separated by their size or molecular mass, passing through cross-linked agarose, dextran or acrylic matrices. It is usually applied to macromolecules (proteins and polymers). The mixture of molecules moves through a porous resin: smaller molecules diffuse into the pores and therefore move through the bed slowly, while large molecules are excluded from the pores thus eluting quickly. Gel Filtration Chromatography may be used for the analysis of molecular mass, for the separation of components in a mixture, or for salt removal and buffer exchange, depending on the range of fractionation chosen.
- 23 -
The Superdex 200 column (volume equal to 125 mL), previously calibrated, was washed with water then equilibrated with buffer C (50 mM Tris-HCl, 150 mM NaCl, 1 mM EDTA, pH 8). The sample, concentrated using the Amicon Stirred Ultrafiltration cell, was loaded using a calibrated loop (2 mL), and the elution was done with the same buffer C at 0,6 mL/min flow rate.
3.12 Anion exchange chromatography: HiTrap Q HP
Ion exchange chromatography can be used to separate proteins depending on their ability to interact, in different ways, with a specific charged resin. In particular, the stationary phase for the anion exchange chromatography is commonly made of porous cross linked agarose charged with a quaternary amine (Q, strong exchanger) or diethylaminoethyl (DEAE, weak exchanger), to generate the positive charge. Proteins that contain negative charges (glutamate, aspartate groups) are bound to the resin. In general, proteins are eluted by increasing the ionic strength (salt concentration) of the buffer or, occasionally, by changing the pH. In the first case, the salt ions (typically Na+
or Cl-) compete with the bound proteins for the charges on the surface of the medium,
thus inducing the elution of the bound proteins. Proteins with the lowest net charge at the selected concentration/pH will be the first ones eluted from the column; proteins with the highest charge will be retained longer on the matrix and will be eluted last. The higher net charge of the protein is, the higher ionic strength is required for its elution. The charge density of the matrix is maintained using a suitable pH of the buffers used. The isoelectric point is the pH at which a protein has no a net charge. Since HoLaMa possesses an isoelectric point equal to 6, the anion exchange chromatography can be performed using buffers at a higher pH (usually between 7 and 10). The column chosen, HiTrap Q HP (5 mL, GE Healthcare Life Science) containing a sepharose-based resin (strong anion exchanger), was equilibrated with buffer A (50 mM Tris-HCl, 50 mM NaCl, 1 mM EDTA, pH 8). The elution was performed with a linear gradient 50 -600 mM NaCl, in 50 mL volume, with a flow of 1 ml/min.
- 24 -
3.13 Determination of protein concentration
The concentration of proteins in solution can be determined using the method of Bradford (1976). This procedure requires the addition of the Coomassie Blue G-250 dye to a protein solution. The Absorbance at 595 nm of the samples is then determined with a spectrophotometer. The data are compared to a calibration curve previously obtained with solution of BSA at known concentration (bovine serum albumin, 1 mg/mL stock solution).
Standard samples were prepared using 4.9 mL of dye solution and different volumes of BSA, to obtain a final concentration of protein equal to 0.1, 0.2, or 0.3 mg/mL.
The unknown samples were prepared by adding a suitable volume of protein to 4,9 mL of dye. Each determination was performed in duplicate.
3.14 SDS-PAGE
Denaturing gel electrophoresis can provide information about the molecular mass and the relative purity of proteins; the most common use of this technique is the qualitative analysis of complex mixtures of proteins.
Sodium dodecyl sulfate-polyacrylamide gel electrophoresis (SDS-PAGE) is a useful technique to analyse protein fractions eluted from chromatographic columns.
SDS-PAGE requires that proteins are denatured: to do this, samples are boiled for 5 minutes in the presence of the anionic detergent sodium dodecyl sulfate (SDS) and of
the reducing agent mercaptoethanol (BME). By this means, after the treatment, each
protein will be devoid of disulphide bridges and will have a uniform negative charge. Accordingly, the electrophoretic mobility will depend mainly on size. Polyacrylamide gels (12,5 % concentration) were used for the separation of mixtures of proteins.
- 25 -
FIG 12: Scheme of the reaction for the synthesis of the polyacrylamide gel
An electric field, applied across the gels by a power supply, drives each negative protein to migrate across the gels toward the anode. The mobility depends on the size of the proteins, so small molecules will move faster through the pores than large proteins. Following electrophoresis, gels can be stained with a Coomassie Brilliant Blue R-250 solution (0,25 % Coomassie Blue, 30% ethanol, 10% acetic acid), for 2 h under shaking. The Coomassie Blue dye binds to proteins through ionic interaction between dye sulfonic acid group and positive protein amine group. After staining, gels are placed in a destaining solution (10% acetic acid and 30% ethanol) until protein bands appear.
- 26 -
3.15 NMR
All experiments were performed at 293 K on a Bruker Avance III 600 MHz spectrometer equipped with a TCI-H/C/N triple resonance cryoprobe.
Protein samples were prepared in a final volume of 510 µL containing 5 % Vol. of D2O
as field lock.
1D spectra were acquired with 64-128 accumulated scans, solvent suppression was achieved by the Watergate sequence. Acquired data was processed and analysed using TopSpin 3.2 software16.
An important step before the acquisition of data is the water suppression: water signal is a major source of inaccuracy in the determination of biomolecules’ peaks.
In fact, some peaks may be hidden under the water peak or, even if the peaks are sufficiently intense to be identified, they may overlay with the tail of the water peak, which acts as a baseline distortion and makes the determination of the peak less accurate.17
Several physical or chemical phenomena make the water signal suppression difficult: the radiation damping (RD) effects, the impact of various instabilities on the position of the water signal and the ‘‘faraway water’’ effect. RD is an intrinsic physical phenomenon in all NMR experiments; if the solvent suppression is not efficient enough, RD may affect the residual signal and generate a great hump, which will affect the quantification of metabolite signals close to the solvent peak.
The description of the phenomenon is explaining in review by Krishnan and Murali (2013)18: The precessing transverse magnetization of the water protons after a radio frequency pulse induces an electromagnetic field (emf) in the receiver coil. This creates an oscillating current that generates a transverse magnetic field at the same frequency. This induced field rotates the magnetization of the solvent spins to its equilibrium toward the direction of the applied magnetic field, before other relaxation mechanisms can take effect. The rate, at which the solvent magnetization is rotated to equilibrium, is given by a characteristic time constant known as the radiation damping time (srd). For example, a sample of water in an NMR spectrometer operating at 400 MHz will have a srd value of around 20 ms. In contrast, the expected spin lattice (T1) and spin–spin relaxation (T2) times of water have durations on the order of more than hundreds of milliseconds.
- 27 -
The decay of the time domain signal is dominated by the much shorter srd, rather than the longer T2. Several powerful solutions based on either hardware (probe engineering) modifications or pulse field gradient have developed effective suppression of RD in biomolecular NMR applications.
Variations in the position of the water resonance frequency come from various origins: in particular, from variations of pH, salt concentration and temperature in different sample. These variations, even small, can be sufficient to shift the water signal by a few hertz, thus decreasing the efficiency of the suppression scheme.
“Faraway” water effect is due to the nuclei located at the edge of the sensitive NMR volume, which are subjected to a reduced RF field and different B0 as in the other part
- 28 -
4. RESULTS AND DISCUSSION
4.1 HoLaMa overexpression
In order to obtain a high amount of purified HoLaMa for NMR analysis, we cultured six batches (1.5 L each) of E. coli cells subjected to the overexpression of the target protein. From 9 L of induced E. coli TOP10/pBAD-HoLaMa cultures we obtained about 4 g/batch of biomass that were mixed together and then divided into aliquots to be used for the subsequent purification steps.
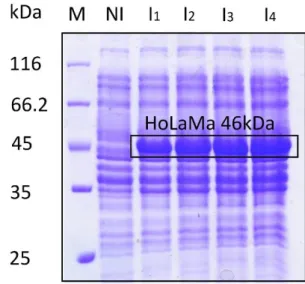
SDS-PAGE analysis demonstrated the effectiveness of the induction procedure. As shown in figure 13, aliquots of total proteins extracted from the biomass of four different
overexpression batches were compared. The difference between not induced and induced samples is sharp, with the band corresponding to HoLaMa only detected in the protein extracts obtained from induced cultures.
4.2 First purification procedure
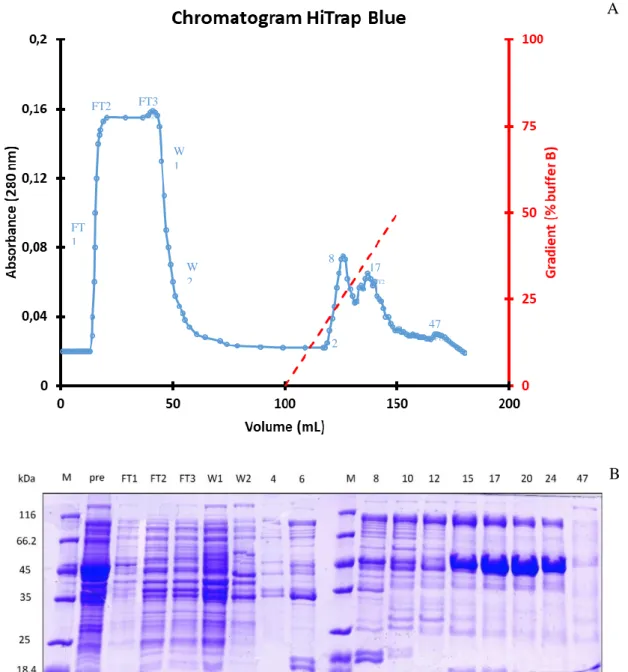
The first procedure used for the purification of HoLaMa included 4 different chromatographic steps: a) affinity with HiTrap Blue HP, b) affinity with HiTrap Heparin HP, c) gel filtration chromatography and d) anion exchange with HiTrap Q. The soluble protein extract, obtained from 500 mL of induced cells, was loaded onto a 5 mL HiTrap Blue affinity column. The corresponding chromatogram (see figure n…) shows that a huge amount of protein did not bind to the column, but it was eluted with the flow through. During the elution, performed with a linear NaCl gradient (0.05-1 M), other contaminant proteins were separated from HoLaMa. The elution was performed in 50 mL and fractions of 1 mL were collected. Aliquots of the protein samples eluted from the HiTrap Blue column were analysed by SDS-PAGE (figure 14B).
FIG 13: SDS-PAGE of total protein extracts from four different overexpression batches. (M: protein molecular weight markers; NI: Not Induced; I: Induced)
- 29 -
FIG 14: A: Chromatogram of the purification step performed with the HiTrap Blue affinity column. (FT1,2,3: Flow Through W1,2: Wash). B: SDS-PAGE of representative fractions eluted from the HiTrap Blue affinity column (M: protein molecular weight markers; Pre: the protein extract loaded onto the column).
FT2 A B FT 1 FT3 FT2 W 1 W 2 2 8 17 FT2 47 FT2
- 30 -
As shown in figure 14, HoLaMa was present in fractions 14- 29 (second peak of the chromatogram, corresponding to 630-910 mM NaCl) in very high concentration; on the contrary, HoLaMa was not detected at significant levels in the flow through and in the washing fractions. Using the Bradford assay, we determined the initial amount of total proteins before the HiTrap Blue chromatography: 65 mg in a 25 mL volume, corresponding to a concentration of 2.61 mg/mL.
After the first purification step, all fractions containing HoLaMa were pooled and the protein concentration was equal to 0.51 mg/mL, corresponding to 10.7 mg in 21 mL. This pool of fractions was concentrated and desalted with an ultrafiltration Amicon cell (equipped with a YM30 membrane), then loaded onto a second affinity column, i.e. a HiTrap Heparin. The elution was performed increasing the NaCl concentration from 50 to 600 mM, and fractions of 0.9 mL were collected. Figure 15 shows the chromatogram and the corresponding SDS-PAGE.
A FT3 W 8 12 16
- 31 -
FIG 15: A: Chromatogram of the HiTrap Heparin affinity column. (FT2,3: Flow Through; W1: Wash) ..B: SDS-PAGE of fractions eluted from the HiTrap Heparin affinity column (M: protein molecular weight markers; Pre: sample loaded onto the column).
The chromatogram shows a very small flow through peak, indicating that most proteins could bind to the resin, and three elution peaks. As revealed by the SDS.PAGE analysis, HoLaMa was present only in the third peak (fractions 10-15 with a NaCl concentration ranging from 770 to 815 mM), while in the first two peaks (fractions 1-9) the protein was absent.
The fractions from 10 to 15 (about 5.5 mL) were concentrated to 2.2 mL with an Amicon ultrafiltration cell (YM30), then loaded onto a gel filtration column (Superdex-200), using a 2 mL loop.
This purification step was useful to eliminate a contaminant protein around 110 kDa (lane 5 in the gel, figure 16B).
- 32 -
FIG 16: A: elution profile of the Gel Filtration chromatography. B: SDS-PAGE of fractions eluted from the Superdex 200 column (M: protein molecular weight markers; Pre: Sample loaded onto the column).
To improve the purity of the recovered protein, fractions from 44 to 53 (Vtot = 7.5 mL)
were collected and loaded onto an ion exchange column (HiTrap Q HP). The protein concentration of the sample before this chromatography was 0.178 mg/mL, corresponding to 1.34 mg of total protein. Unfortunately, this purification step failed because HoLaMa was unable to bind the anionic resin and the protein did elute with the flow through and the washing fractions (see Figure 17).
B A
5 41
48
- 33 -
FIG 17: SDS-PAGE of relevant fractions eluted from the HiTrap Q column. (M: protein molecular weight marker; Pre: Sample loaded onto the column).
4.3 Second purification
For the second purification procedure we used the biomass obtained from 4 L of E. coli TOP10/pBAD-HoLaMa induced cultures; after a sonication step in 65 mL of buffer A, the lysate was centrifuged and filtered.
The purification started with a Cibacron Blue affinity chromatograpy. The concentration of protein loaded onto the column was 15.8 mg/mL, corresponding to approximately 1 g of total proteins.
Figure 18 shows the elution profile of HoLaMa from the Cibacron Blue column and the SDS-PAGE of some eluted fractions.
- 34 -
FIG 18: A: Cibacron Blue chromatogram (FT 1,2,3: Flow Through; W1: Wash). B: SDS-PAGE of fractions obtained from the Cibacron Blue column (M: protein molecular weight marker; Pre: sample loaded onto the column).
As clearly visible in the SDS-PAGE gel, the amount of recovered HoLaMa was very high, but a consistent fraction of the protein did not bind to the column, and was eluted with the flow through (lane FT2, FT3) and the washing steps (lane W1). In particular, the
protein concentration of the second flow-through was determined as equal to 3.15 mg/mL, corresponding to about 80 mg in 25 mL (FT2). Considering a similar amount of
protein inside the FT3 and W1 samples, we estimate that we lost approximately 1/3 of
total proteins.
The elution was performed with a linear NaCl gradient (0.05 - 1 M): HoLaMa was detected in fractions 15-48, featuring a NaCl concentration ranging from 0.72 to 1 M.
FT2 FT1 FT3 W1 15 21 33 50 A B
- 35 -
Fractions containing HoLaMa were pooled and subjected to an ultrafiltration step (Amicon cell equipped with a YM30 membrane) to decrease NaCl concentration to 50 mM. After this step, the protein content was reduced to 40 mg in a volume of 20 mL. The subsequent purification step was performed using a HiTrap Heparin affinity column (see figure 19) and the elution was carried out with a linear NaCl gradient from 50 to 600 mM.
FIG 19: A: HiTrap Heparin chromatogram (FT 1,2: Flow Through; W1: Wash). B: SDS-PAGE of fractions obtained from the HiTrap Heparin column (M: protein molecular weight marker; Pre: sample loaded onto the column).
The elution profile shows two different peaks; HoLaMa was present in the second peak, in fractions from 9-16 (about 8 mL). This pool was concentrated to 2.1 mL (final
FT1 FT2 W 4 6 10 14 A B
- 36 -
concentration of proteins 4.71 mg/mL, corresponding to 9.8 mg) and then loaded onto a gel filtration column (Superdex 200, 1.6 x 70 cm).
FIG 20: A: Gel filtration chromatogram. B: SDS-PAGE of fractions obtained from the Gel Filtration column (M: protein molecular weight marker; Pre: sample loaded onto the column).
Unfortunately, the purification step using the Superdex 200 column was not very efficient: the low molecular weight contaminants were not adequately separated from HoLaMa. However, the target protein eluted at a volume corresponding to the expected molecular mass of the enzyme monomeric form.
We collected fractions from 40 to 51 (the volume was about 10 mL, and the NaCl concentration was 150 mM); then, this pool was diluted to decrease the NaCl concentration with a diluent buffer (50 mM Tris HCl, 1 mM EDTA). The protein
A
1
44
40 51
- 37 -
concentration of the sample, determined according to the Bradford assay, was 0.51 mg/mL, corresponding to about 9.6 mg of total protein. Therefore, the amount of protein loaded and collected from the gel filtration column was the same.
The sample was loaded onto the last column, a Hi Trap Blue HP affinity column, using a flow equal to 0.4 mL/min, and the elution was carried out with a linear NaCl gradient (from 0.05 to 1 M).
FIG 21: A: HiTrap Blue affinity chromatogram. (FT1,2,3: Flow Through W1,2: Wash). B: SDS-PAGE of fractions eluted from the HiTrap Blue affinity column (M: protein molecular weight marker; Pre: sample loaded onto the column).
According to the SDS-PAGE analysis, fractions from 5 to 23 (final volume 18 mL, NaCl concentration about 700 mM) were colected; this pool was then diluted and concentrated using a Amicon ultrafiltration cell (YM30 membrane), to reduce NaCl
7 11 18 24 A B
- 38 -
concentration to about 50 mM. The final volume of the sample was 4.6 mL with a protein concentration of 0.39 mg/mL, corresponding to 1.8 mg of purified HoLaMa.
The amount of protein recovered after each step of the purification cycle is reported in Table 1.
Second purification
Conc (mg/mL) Vsample (mL) Total protein (mg)
Pre Cibacron Blue 15.8 65 1027
Pre HiTrap Heparin 1.90 21 39.9
Pre Gel Filtration 4.71 2.1 9.80
Pre HiTrap Blue 0.51 19 9.60
HoLaMa purified 0.39 4.6 1.80
Table 1: recovery of proteins after each purification step .
In order to compare the purification level obtained with this procedure, aliquots of the protein sample were analysed by SDS-PAGE:
- 39 -
4.4 Third purification
To increase the yield of the first purification step, we decided to independently extract proteins from two aliquots of biomass (each corresponding to 2 L of culture), and to repeat twice the Cibacron Blue affinity column.
The chromatograms of these two parallel Cibacron Blue affinity steps were very similar, as well as the amount of total proteins obtained in the extractions (about 450 mg each).
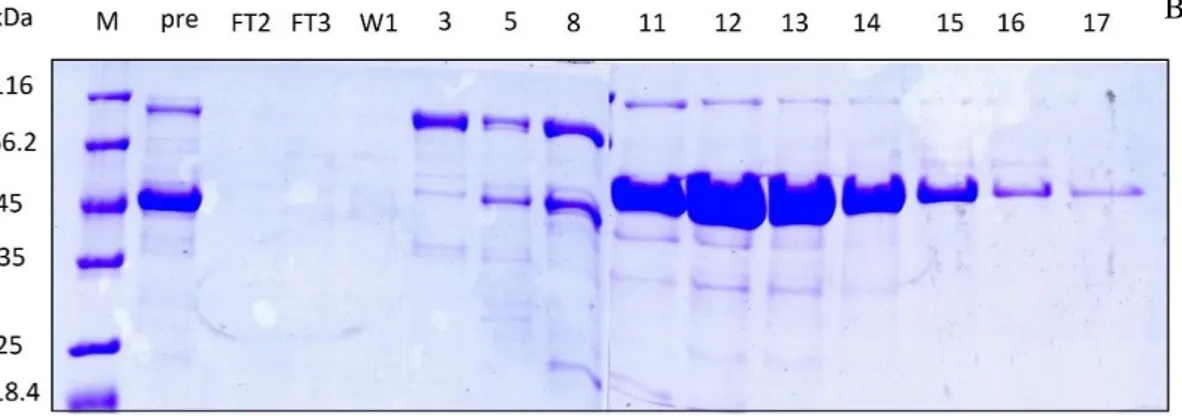
FIG 23: A: Cibacron Blue chromatogram (FT 1,2: Flow Through; W1: Wash). B: SDS-PAGE of fractions obtained from the Cibacron Blue column (M: protein molecular weight marker; Pre: sample loaded onto the column).
FT1 FT2 W 9 15 26 A B
- 40 -
HoLaMa was mainly eluted in fractions 9-39, featuring a total volume of about 60 mL and a protein concentration equal to 2.4 mg/mL. This protein solution was diluted in a buffer devoid of NaCl, then concentrated to 25 mL using an Amicon ultrafiltration cell. Unfortunately, during this step, a consistent amount of proteins was lost, as revealed by the Bradford assay. The initial amount of proteins was indeed equal to 144 mg, while the concentration after the ultrafiltration step was 3.17 mg/mL, corresponding to about 80 mg of proteins in 25 mL.
After centrifugation, the protein sample was loaded onto a HiTrap Heparin column and the elution was performed with a 50-600 mM NaCl gradient. Fractions 10-16 (V= 6.7 mL), containing a high amount of HoLaMa (as shown in Figure 23), were pooled, diluted and concentrated to reduce the NaCl concentration using an Amicon ultrafiltration cell. FT1 A FT2 W 4 10 13 20
- 41 -
FIG 23: A: HiTrap Heparin chromatogram (FT 1,2: Flow Through; W1: Wash). B: SDS-PAGE of fractions obtained from the HiTrap Heparin column (M: protein molecular weight marker; Pre: sample loaded onto the column).
The amount of protein obtained after this step was about 16.8 mg in 25 mL (concentration 0.67 mg/mL).
This sample was finally loaded onto the last column, a HiTrap Blue, and the elution was performed with a linear 0.05– 1M NaCl gradient. The result is reported in figure 24.
B
- 42 -
FIG 24: A: Chromatogram of HiTrap Blue affinity. B: SDS-PAGE of fractions obtained from the HiTrap Blue affinity column (M: protein molecular weight marker; Pre: sample loaded onto the column).
As revealed by the SDS-PAGE analysis, fractions 11 to 25 contained purified HoLaMa. These fractions, featuring a NaCl concentration from 670 to 930 mM, were pooled and diluted to decrease the NaCl concentration to 300 mM. The amount of HoLaMa was assayed by the Bradford method, resulting equal to 4.8 mg.
Table 2: Purification summary table.
The final protein solution was mixed with the purified sample obtained from the second purification procedure (1.8 mg of HoLaMa in 4.6 mL). The solution was finally concentrated to obtain 1.9 mL of sample with a concentration of 3.1 mg/mL, i.e. 66 µM (total protein 5.8 mg).
Third purification
Conc (mg/mL) V sample (mL) Total protein (mg)
Pre Cibacron Blue I° 6.23 65 405
Pre Cibacron Blue II° 7.98 65 518
Pre ultrafiltration 2.40 60 144
Pre HiTrap Heparin 3.17 25 79.3
Pre HiTrap Blue 0.67 25 16.8
Post HiTrap Blue 0.33 15 4.95
HoLaMa purified 0.96 5.0 4.80
- 43 -
4.5 NMR
A preliminary NMR study was performed to obtain and interpret the signals of HoLaMa, which is a protein featuring a quite large molecular mass (46 kDa). Data were acquired using a Bruker Avance III 600 MHz spectrometer and spectra were processed using TopSpin 3.2 (baseline corrections were manually applied). First experiments were performed with 66 µM HoLaMa in 50 mM Tris-HCl buffer, 300 mM NaCl, 1 mM EDTA, the same buffer used for the purification of the enzyme, and 5 % D2O
(standard). Spectra were acquired at 293K or 288K, overnight.
Under these conditions, the concentration of Tris-HCl was about 1000 times higher when compared to the protein concentration; therefore, the principal signals detected were derived from Tris protons; however, in region of the spectrum relative to the aliphatic and the aromatic signals dispersed peaks corresponding to HoLaMa were detected.
- 44 -
FIG 26: Detail of Aromatic and Backbone NH part of H1-NMR spectrum of HoLaMa
The different temperature conditions tested revealed a better resolution of the spectrum under the higher temperature; indeed, at the lower temperature the viscosity of the sample usually increases, implying that the molecules move slowly and the peaks are wider. For this reason, subsequent experiments were carried out at 293K.
We also collected a NOESY spectrum of HoLaMa under the same conditions used for
1H-NMR: again, the Tris buffer did predominate the spectrum, but we were able to
detect the aromatic and aliphatic diagonal signals.
- 45 -
In subsequent experiments we exchanged the 50 mM Tris buffer with 20 mM phosphate, using a small aliquot of the protein sample to test the stability of HoLaMa in the new environment. Phosphate is a non-protonated buffer suitable for NMR experiments.
The concentration of HoLaMa for this test was about 15 µM, the protein sample was mixed with 30 µL of D2O, and the spectrum has been recorded overnight.
We compared the two 1D 1H-NMR collected using Tris or phosphate buffer to dissolve HoLaMa. In the figure below (28) in Blue is shown the spectrum for HoLaMa in phosphate buffer, while in Red is reported the spectrum for HoLaMa in Tris buffer. The peaks of the protein are clearly overlapping, confirming that HoLaMa was natively folding, while the Tris peaks disappear. However, some impurities around 3.5 ppm are present.
FIG 28: H1-NMR spectrum of HoLaMa: in Blue the spectrum in phosphate buffer and in Red the spectrum in Tris buffer
We prepared a new phosphate buffer to repeat the NMR experiment, without HoLaMa, in order to check the presence of these impurities.
- 46 - FIG 29: H1-NMR spectrum of Phosphate buffer.
The spectrum indicates the absence of any impurities, since only the peak of water was detected (at 4,7 ppm).
We focused further work on the study of the polymerase reaction between a short DNA template (16 mer) and HoLaMa.
3’ CGCGCGCGAAAAAAAA 5’ 5’ GCGCGCGCTTTTTTT 3’
The synthetic DNA used in all NMR experiments was provided by GenScript (USA). First of all, we studied the NMR signal of the single nucleotide dTTP and of the complex DNA-dTTP in solution. Further, HoLaMa was added to the DNA-dTTP solution to follow the reaction steps.
The spectrum for dTTP was recorded a 293 K for 10 minutes. The volume of the sample was 510 µL, containing 31 µL of the 1 mM dTTP stock solution (final concentration 61 µM), 449 µL of distilled water and 30 µL of D2O.
- 47 - FIG 30: H1-NMR spectrum of dTTP
The NMR signals visible on the spectrum are: 1.741 ppm methyl for the thymine group 2.209 ppm for proton (2 and 2’) of deoxyribose 4.044 ppm for proton 3’- 4’- 5 and 5’ of deoxyribose 4.718 ppm for water
6.179 ppm for proton 1’ of deoxyribose 7.602 ppm for proton of thymine (position 5)
Specific signals for imino protons are not present, because dTTP is a free nucleotide and we can see the peak for imino proton only in a double stranded DNA (when imino proton is engaged in a hydrogen bond), anyway the imino protons are present after 10.2 ppm.
Afterwards, we analysed the short double stranded DNA; the sample was prepared with 71 µL of the DNA stock solution 360 µM (final concentration 50 µM), 378 µL of distilled water and 30 µL of D2O. The spectrum was collected overnight at 293 K.
- 48 -
FIG 31: Detail of H1-NMR spectrum of DNA, from 12 to 15 ppm.
After a manual base line correction, it was possible to integrate the peaks in the imino protons range; the integral value is about 15, corresponding to 15 imino protons, which formed hydrogen bonds between nitrogen bases.
I1 = 1
I2 = 14
Total I = 15 expected number of hydrogen bonds formed
Once acquired the H1-NMR spectrum of dTTP and DNA separately, we decided to prepare a mixing solution 1:1 of DNA and dTTP. To do this, we added to the DNA sample previously analysed 26 µL of the dTTP solution (1 mM), to a final concentration of 48 µM.
The sample was analysed overnight at 293 K. The NMR spectrum obtained does not significantly differ from the spectrum obtained with DNA only.
- 49 -
FIG 32: Detail of H1-NMR spectrum of DNA in BLU and DNA+dTTP in RED, from 12 to 14.5 ppm.
We then prepared a sample containing HoLaMa, DNA and dTTP with a concentration ratio of 1:1:1. The mixture contained:
403 µL HoLaMa final concentration 39.5 µM 56 µL DNA final concentration 39.5 µM 41 µL dTTP final concentration 40 µM 30 µL D2O
The spectrum was collected overnight at 293 K, and it was compared with the two spectra previously acquired. In the presence of HoLaMa, the peaks show a shift toward low field and they present a different shape. In particular, the peak around 12.7 ppm is broader and does not have a definite minimum, while peaks around 13.6 and 14.2 ppm are broader and smaller. These differences can be caused by the interactions between HoLaMa and the DNA during the catalytic events.
- 50 -
FIG 33: Detail of H1-NMR spectrum of DNA in BLU, DNA+dTTP in RED and DNA+dTTP+HoLaMa in GREEN from 12 to 14.5 ppm.
To attempt a better understanding of the spectra, we decided to prepare another sample containing only HoLaMa and DNA: if the signals of this were similar to the signal of the DNA only or the DNA + dTTP spectrum, we could confirm the catalytic action of HoLaMa, as seen in figure 33 in green.
The sample was prepared with a very low concentration of both components (unfortunately we had only a small residual amount of HoLaMa). The spectrum was collected at 293 K for about 3 days. The mixture contained (in final volume of 500 µL): 95 µL HoLaMa final concentration 9.5 µM
14 µL DNA final concentration 10 µM 30 µL D2O
361 µL MQ
As expected, the resultant spectrum presents a very high noise in the imino part and the peaks are not distinguishable.
- 51 -
FIG 34: Detail of H1-NMR spectrum of DNA+HoLaMa in BLU, DNA+dTTP+HoLaMa in RED from 12 to 14.5 ppm.
- 52 -
5. CONCLUSION
In the present work, we studied the artificial enzyme HoLaMa, a sub-fragment of the Klenow DNA polymerase of Escherichia coli, lacking the proofreading domain.
During the first part of the experimental work, we tested three different purification procedures in order to obtain an amount of purified HoLaMa appropriate for NMR analysis. The best purification procedure consisted of the following steps:
1) first step with Cibacron blue affinity chromatography;
2) ultrafiltration of pooled fractions for desalting and concentration; 3) second step with a HiTrap Heparin affinity column;
4) ultrafiltration of pooled fractions for desalting and concentration; 5) third step with a HiTrap Blue affinity column.
The most troublesome step turned out to be the ultrafiltration after the Cibacron blue chromatography, since about 50 % of the total protein was lost during this desalting/concentration procedure. Despite this loss, we could finally obtain about 6 mg of purified HoLaMa in 1.8 mL (final concentration 67 μM).
Future work will be devoted to optimize this critical step, e.g. performing a dialysis step instead of the ultrafiltration carried out with an Amicon membrane to desalt and concentrate the protein sample.
The second experimental part consisted in the study of HoLaMa by NMR spectroscopy, in particular towards the nature of enzyme-substrate interactions and the kinetics of the reaction. Unfortunately, the total amount of purified HoLaMa (about 6 mg) allowed us to perform only a preliminary study. In particular, we could assess:
- the folding/unfolding state of the protein
- the stability of HoLaMa in different buffers (Tris or Phosphate) - the interactions with DNA and dTTP.
Starting from these observations, it would be very interesting to pursue further this analysis, using a higher amount of purified HoLaMa.
- 53 -
REFERENCE
1. Maki S, Kornberg A. DNA polymerase III holoenzyme of Escherichia coli. III. Distinctive processive polymerases reconstituted from purified subunits. J Biol
Chem. 1988;263(14):6561-6569.
2. Kelman Z, O’Donnell M. DNA polymerase III holoenzyme: structure and function of a chromosomal replicating machine. Annu Rev Biochem. 1995;64:171-200. doi:10.1146/annurev.biochem.64.1.171.
3. Kuban W, Banach-Orlowska M, Schaaper RM, Jonczyk P, Fijalkowska IJ. Role of DNA polymerase IV in Escherichia coli SOS mutator activity. J Bacteriol. 2006;188(22):7977-7980. doi:10.1128/JB.01088-06.
4. Patel PH, Suzuki M, Adman E, Shinkai A, Loeb LA. Prokaryotic DNA
polymerase I: evolution, structure, and ``base flipping" mechanism for nucleotide selection. J Mol Biol. 2001;308(5):823-837. doi:10.1006/jmbi.2001.4619.
5. Martina CE, Lapenta F, Montón Silva A, Hochkoeppler A. HoLaMa: A Klenow sub-fragment lacking the 3′-5′ exonuclease domain. Arch Biochem Biophys. 2015;575:46-53. doi:10.1016/j.abb.2015.04.003.
6. Freemont PS, Ollis DL, Steitz TA, Joyce CM. A domain of the klenow fragment of Escherichia coli DNA polymerase I has polymerase but no exonuclease activity. Proteins Struct Funct Bioinforma. 1986;1(1):66-73.
doi:10.1002/prot.340010111.
7. Rothwell PJ, Waksman G. Structure and mechanism of DNA polymerases. Adv
Protein Chem. 2005;71:401-+. doi:10.1016/S0065-3233(04)71011-6.
8. Steitz TA. A mechanism for all polymerases. Nature. 1998;391(6664):231-232. doi:10.1038/34542.
9. Brautigam CA, Steitz TA. Structural and functional insights provided by crystal structures of DNA polymerases and their substrate complexes. Curr Opin Struct
Biol. 1998;8(1):54-63. doi:10.1016/S0959-440X(98)80010-9.
10. Egli M, Tereshko V, Teplova M, et al. X-ray crystallographic analysis of the hydration of A- and B-form DNA at atomic resolution. Biopolymers.
1998;48(4):234-252. doi:10.1002/(SICI)1097-0282(1998)48:4<234::AID-BIP4>3.0.CO;2-H.
- 54 -
Oliver Zerbe and Simon Jurt. Angew Chemie Int Ed. 2014;53(49):13324-13324. doi:10.1002/anie.201410095.
12. Branden C, Tooze J. Introduction to Protein Structure.
13. Kovermann M, Rogne P, Wolf-Watz M. Protein dynamics and function from solution state NMR spectroscopy. Q Rev Biophys. 2016;49:e6.
doi:10.1017/S0033583516000019.
14. Claridge TDW. High-Resolution NMR Techniques in Organic Chemistry. Vol 27.; 2009. doi:10.1016/S1460-1567(08)10003-4.
15. Richards SA, Hollerton JC. Essential Practical NMR for Organic Chemistry. (WILEY, ed.).; 2010.
16. Piotto M, Manjunatha Reddy GN, Caldarelli S. Non-uniformly sampled Maximum Quantum spectroscopy. J Magn Reson. 2011;213(1):107-111. doi:10.1016/j.jmr.2011.09.016.
17. Giraudeau P, Silvestre V, Akoka S. Optimizing water suppression for quantitative NMR-based metabolomics: a tutorial review. Metabolomics. 2015;11(5):1041-1055. doi:10.1007/s11306-015-0794-7.
18. Krishnan V V., Murali N. Radiation damping in modern NMR experiments: Progress and challenges. Prog Nucl Magn Reson Spectrosc. 2013;68:41-57. doi:10.1016/j.pnmrs.2012.06.001.
19. Mo H, Raftery D. Pre-SAT180, a simple and effective method for residual water suppression. J Magn Reson. 2008;190(1):1-6. doi:10.1016/j.jmr.2007.09.016.