Energy efficiency in cloud data centers: a
review
Tesi di Diploma
Paolo Vecchiolla
Istituto di tecnologie della comunicazione,
dell’informazione e della percezione (TeCIP)
.
Scuola Superiore Sant’Anna
Relatore: Prof. Tommaso Cucinotta
Table of contents
Page
1 Introduction 2
1.1 Fundamental concepts . . . 2
2 Quantification of Energy for cloud computing 5 2.0.1 Worldwide data centers energy consumption . . . 5
2.0.2 Why a data center is energy-consuming . . . 7
3 Energy efficiency 11 3.1 Hardware level . . . 11
3.2 Data center level . . . 12
3.3 Service level . . . 13 3.3.1 Load balancing . . . 13 3.3.2 Fog computing . . . 14 4 Renewables 15 5 Conclusion 17 Bibliography 19
C
h
a
p
t
e
r
1
Introduction
Cloud computing is a model for enabling on-demand network access to a shared pool of configurable computing resources that can be rapidly provisioned and released with minimal management effort or service provider interaction. Its financial benefits have been widely discussed. Nevertheless, the shift in energy usage in a cloud computing model has received little attention.
The energy costs are globally increasing, and the need to reduce green house gas emissions is raising. Fore these reasons, energy efficienty is increasingly important for future information and communication technologies (ICT) [6].
The goal of this work is to understand how big is the energy consumption and gas emission due to cloud computing and information technologies, and what is the research community effort to reduce this consumption. This work is structured as follows:
• Chapter 2 quantifies the problem: how big it is? • Chapter 3 illustrates different solutions to the problem;
• Chapter 4 explains how the ICT technologies world is compatible to renewables; • Chapter 5 is a brief conclusion
First, next Section is a glossary of all acronyms and words that can be useful.
1.1
Fundamental concepts
Cloud computing Cloud computing is a general term for anything that involves delivering hosted services
over the Internet, such as tools and applications like data storage, servers, databases, networking, and software. For example, rather than keeping files on a proprietary hard drive or local storage device, cloud-based storage makes it possible to save them to a remote database. As long as an electronic device has access to the web, it has access to the data and the software programs to run it.
The feature that differentiate cloud computing is that the computer system resources are available on-demand.
Centrilized, distributed and decentralized In a centralized environment, all calculations are done on
one particular computer system, such as a dedicated server for processing data.
Distributed computing, on the other hand, means that not all transactions are processed in the same location, but that the distributed processors are still under the control of a single entity. In a distributed
Paolo Vecchiolla - Tesi di Diploma
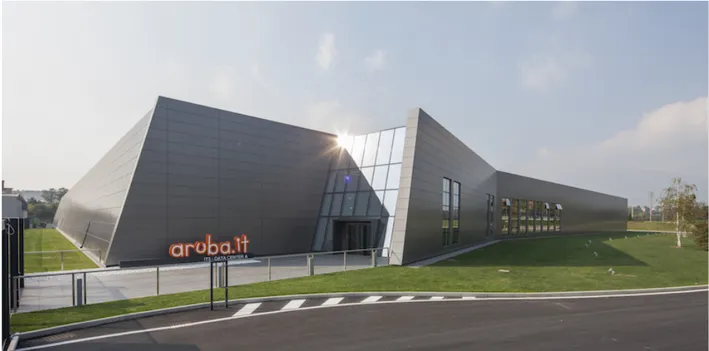
Figura 1. The Aruba Global Data Center, the biggest data center of Italy, situated in Ponte San Pietro, in the province of Bergamo, in a secure non-seismic and non-hydrogeological-risk area. It has a surface of 200 m2. It needs a power of 90 MW. Not only it has a hydroelectric
and a photovoltaic plant and various Diesel generators, and but also it is connected to two Utilities. It is built with fireproof materials and has all kind of security foresights.
scenario, the calculation is distributed to multiple computers which join forces to solve the task, but the resource is still distributed by the same company.
Decentralized computing, on its end, entails that no one single company has control over the processing. By its very definition, decentralized computing means that the data is distributed among various machines for different computers to perform the tasks. This type of computing takes away the possibility for any party to amass loads of data.
Data centers A data center is a building used to house computer systems and associated components, such
as telecommunications and storage systems. Data centers are designed for computers, not people. As a result, data centers typically have no windows and minimal circulation of fresh air. They can be housed in new construction designed for the purpose or in existing buildings that have been retrofitted.
Because of their high concentrations of servers, often stacked in racks that are placed in rows, data centers are sometimes referred to a server farms. They provide important services such as data storage, backup and recovery, data management and networking.
Virtualization Virtualization refers to the creation of a virtual resource such as a server, desktop, operating system, file, storage or network. A virtual machine (VM) is an emulation of a computer system. Virtual machines are based on computer architectures and provide functionality of a physical computer. Virtualization is used to manage workloads by radically transforming traditional computing to make it more scalable. Virtualization has been a part of the IT landscape for decades now, and today it can be applied to a wide range of system layers, including operating system-level virtualization, hardware-level virtualization and server virtualization.
Paolo Vecchiolla - Tesi di Diploma
Service Level Agreements (SLA) A service-level agreement (SLA) is a commitment between a service
provider and a client. Particular aspects of the service – quality, availability, responsibilities – are agreed between the service provider and the service user.
Some of the SLA terms for a data center service are: • latency
• uptime guarantee, which indicates the percentage of time the system is available; • environmental conditions, for example microdusts level, cooling system and so on; • technical support;
• security and transparency.
Power Usage Effectiveness (PUE) Power usage effectiveness (PUE) is a metric used to determine the
energy efficiency of a data center. PUE is determined by: PUE=Ptot
PIT (1.1)
where:
• Ptotis the total amount of power entering the data center;
• PITis the power used to run the computer infrastructure.
PUE is therefore expressed as a ratio greater than 1, with overall efficiency improving as the quotient decreases toward 1.
C
h
a
p
t
e
r
2
Quantification of Energy for cloud computing
2.0.1 Worldwide data centers energy consumption
Quantifying the energy consumption is not straightforward, particularly the energy consumption by the cloud infrastructure. Many papers use a different definition of cloud infrastructure. Some articles consider only the electricity consumed by the servers, other the electricity consumed by the refrigeration systems, other the energy required for the communication infrastructure and the end-user devices. This confusion leads to various different estimation of the global energy required for the cloud.
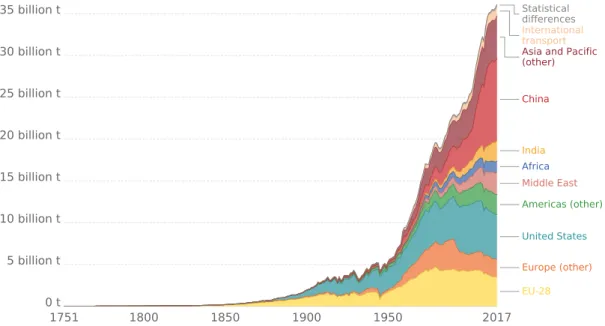
Figure 2 shows some academic estimate. This data should be compared with the historic and future evolution of greenhouse gas emissions (Figure 3 and Figure 4 respectively), from reference [17]. These two graphs show how the annnual global emissions are growing and will continue to grow for the next century, if the current policies are applied. Although emissions from the wester world are decreasing, the rest of the world is having an increase primarily caused by economic development of China and the rest of Asia.
From 2000 to 2017 the global emissions have increased by 41%. Looking at Figure 2, this demonstrates how
0.00% 2.00% 4.00% 6.00% 8.00% 10.00% 12.00% 14.00% 16.00% 2005 2007 2009 2011 2013 2015 2017 2019 2021 2023 2025 2027 2029 2031 2033 2035 2037 2039 Pe rce n t of e m is sion s cau se d b y ICT
Paolo Vecchiolla - Tesi di Diploma
Annual total CO₂ emissions, by world region
1751 1800 1850 1900 1950 2017 0 t 5 billion t 10 billion t 15 billion t 20 billion t 25 billion t 30 billion t 35 billion t Statistical differences International transport
Asia and Pacific (other) China India Africa Middle East Americas (other) United States Europe (other) EU-28
Source: Carbon Dioxide Information Analysis Center (CDIAC); Global Carbon Project (GCP)
Note: "Statistical differences" notes the discrepancy between estimated global emissions and the sum of all national and international transport emissions.
•
Figura 3. Annual total CO2 emissions, by world region. Note: "Statistical differences" notes the
discrepancy between estimated global emissions and the sum of all national and international transport emissions. Image from Our World in Data [17].
Figura 4. Global greenhouse gas emissions future scenarios: no climate policies: if no climate policies were implemented, this would result in an estimated 4.1-4.8°C warming by 2100 (relative to pre-industrial temperatures); current climate policies: projected warming of 3.1-3.7°C by 2100 based on current implemented climate policies; national pledges: all countries achieve their current targets/pledges set within the Paris climate agreement; 2°C consistent: there are a range of emissions pathways that would be compatible with limiting average warming to 2°C by 2100. This would require a significant increase in ambition of the current pledges within the Paris Agreement; 1.5°C consistent: there are a range of emissions pathways that would be compatible with limiting average warming to 1.5°C by 2100. Image from Our World in Data [17].
Paolo Vecchiolla - Tesi di Diploma
the global emissions caused by ICT have also increased by the same amount in percent. All the references for Figure 2 (global emissions of the ICT world) are shown below:
• According to Andrae [2], «the ICT industry is posed to be responsible for up to 3.5% of global emissions by 2020, with this value potentially escalating to 14% by 2040, according to Climate Change News. Globally, data centres were in 2014 responsible for around 1.62% of the world’s utilised energy that year, according to Yole Développement. That has increased today to more than 3% of the world’s energy (around 420 terawatts) and data centres are also responsible for 2% of total greenhouse gas emissions». • According to Adams [1] «the information and communications technology (ICT) sector predicts to use
20 percent of all the world’s electricity by 2025 and emit up to 5.5 percent of all carbon emissions.» • Khoshravi et al. [12]: «the information and communication technology industry (ICT) consumes an
increasing amount of energy and most of it is consumed by data centers. A major consequence of this amount of energy consumption by data centers is a significant increase in ecosystem carbon level.
According to Gartner, the ICT industry produces 2% of global CO2 emission, which places it on par
with the aviation industry. Therefore, reducing even a small fraction of the energy consumption in ICT, results in considerable savings in financial and carbon emission of the ecosystem.»
• Zhou et al. [22]: «It is estimated that data centers will consume about 8% of the worldwide electricity by 2020, and produce 2.6% of the global carbon emission.»
• Shuja et al. [20]: «Recently, many studies have focused on the energy consumption levels of data centers. The environmental Protection Agency study estimated that the data center energy consumption would double from 2006 (61 billion kWh) to 2011. In 2009, data centers accounted for 2% of worldwide electricity consumption with an economic impact of US $30 billion. Gartner Group forecasted data center hardware expenditure for 2012 to be at US $106.4 billion, a 12.7% increase from 2011. The IT sectori was responsible for 2% of carbon dioxide wirldwide in 2005, a figure that is estimated to grow by 6% per year. Aggressive energy-efficiency measures for all devices inside the data center can reduce 80% of energy costs and 47 million metric tons of carbon dioxide emission.»
• Beloglazov et al. [5]: «in 2006 the cost of energy consumption by IT infrastructure in US was estimated as 4.5 billion dollars and it is likely to double by 2011.»
• Deng et al. [8] «Google, Microsoft and worldwided ata centers in 2014 consume about 1.3 percent of the worldwide electricity and this fraction will grow to 8 percent by 2020.»
• Ruiu et al. [18]: «Data centers require a tremendous amount of energy to operate. In 2012, data centers energy consumption accounted for 15% of the global ICT energy consumption. This figure is projected to rise of about 5 to 10 % in 2017. Typically, data centers spend most of the energy for powering and cooling the IT equipment (75%). Power distribution and facility operations account for the remaining 25%. Since the efficiency of cooling systems is increasing, more research efforts should be put in making green the IT system, which is becoming the major contributor to energy consumption.»
• Shang et al. [19]: «the U.S. EPA points out the total power consumption in American data centers increases from 61 billion kWh in 2006 to 100 billion kWh in 2011.»
• Baliga et al. [4]: «it is estimated that data centers accounted for approximately 1.2% of total US electricity consumption in 2005. The transformation and switching networks in the Internet account for another 0.4% of total electricity consumtption in broadband-enabled countries.»
• Varghese et al. [21]: «In 2014, it was reported that the US datacenters consumed about 70 billion kilowatt-hours of electruicyty. This is approximately 2% of the total energy consumed in the US.»
2.0.2 Why a data center is energy-consuming
Data center rooms are filled with rows of IT equipment racks that contain servers, storage devices, and network equipment. Furthermore, data centers include power delivery systems that provide backup power, regulate voltage, and make necessary alternating current/direct current (AC/DC) conversions. Data centers
Paolo Vecchiolla - Tesi di Diploma
SHUJA et al.: SURVEY OF TECHNIQUES AND ARCHITECTURES FOR DESIGNING DATA CENTERS 511
applications due to their efficiency in floating-point functions.
Moreover, GPUs are highly energy efficient compared with
CPUs. The top two energy-efficient supercomputing machines
are GPU based.
1GPUs provide nearly 85 times lesser power
consumption for a floating-point calculation than x86-based
processors [38].
Employing DVFS techniques and using commodity server
designs lead to energy efficiency at the cost of performance. The
scale-out approach (3-D stacking, SoC, and commodity servers)
can lead to better performance per unit energy with customized
I/O and memory designs for data-intensive computations [39].
Moreover, SoC designs compact computing units in a small
space and require dedicated thermal fail over management
[30]. Furthermore, scale-up design optimizes system
through-put rather than work done per unit cost or energy. Due to
escalating data center energy costs, systems designs aimed at
lower energy per unit work need to be investigated. RISC-based
architectures are inherently energy efficient and can be utilized
in scale-out designs [26]. However, high-end systems optimally
support virtualization techniques that are making their way in
low-power RISC designs [25].
B. Server Power Distribution
A medium-size data center with 288 racks can have a power
rating of 4MW [40]. The data center power infrastructure is
complex, and power losses occur due to multistage voltage
con-versions. Power loads of the medium-size data center require
high-voltage power supply of up to 33KV. This high-voltage
supply is stepped down to 280–480-V range by automated
transfer switches. The stepped-down voltage is supplied to an
uninterrupted power supply (UPS) system. The UPS converts
the ac to dc to charge the batteries and converts dc back to
ac before supplying power to the PDUs. The PDU steps down
voltage according to specification of each computing unit. The
multiple power conversion phases have efficiency in the range
of 85%–99%, which results in power losses [22]. Therefore,
along the lines of smart grid, the data center power distribution
and conversion need to be intelligently and efficiently designed
[20]. The PDUs are arranged across the data center in wrapped
topology; each PDU serves two racks, and each rack draws
current from two PDUs. The power is provided to each server
through connectors called whips that split 480-V three-phase ac
to 120-V single-phase ac. Fig. 4 depicts the conventional power
distribution system of a data center.
Power capping and multilevel coordination is required to
limit data center power budget across the cyberphysical space.
Researchers have proposed a power capping scheme for data
centers that require coordination among various data center
resources, such as virtual machines, blade servers, racks, and
containers [21]. The server controller caps power budget by
varying P-states according to reference utilization and actual
utilization levels of the server. Modern servers are equipped
with dynamic power management solutions to cap local power
budget [41]. Controllers at higher level react to the changes
of lower level controllers in the same manner as they react to
Fig. 4. Data center power distribution.
varying workloads. In modern rack-based data centers, modular
power distribution is adopted with redundant power distribution
elements. Pelley et al. [40] adopt the technique of shuffled
power topologies, where a server draws power from multiple
power feeds. A central controller manages switching of servers
to power feeds to: a) enforce power budgets through control
loops by modulating processor frequency and voltage; b)
dis-tribute load over feeds in case of feed failure; and c) balance
power draws across the three ac phases to avoid voltage and
cur-rent spikes that reduce device reliability. The power-scheduling
technique, power routing, sets power budget for each server at
the PDU. If the server power demand increases its budget cap,
the power routing seeks additional power on the power feeds
linked to the server. For underutilized servers, the power routing
controller reduces their budget caps and creates power slacks
that might be required elsewhere in the power distribution
system. Estimating server power usage and provisioning data
center power accordingly requires thorough investigation of:
a) nameplate versus actual peak power values; b) varying data
center workloads; and c) application-specific server resource
utilization characteristics [42]. The gap between the theoretical
and actual peak power utilization of cluster servers allows the
deployment of additional computing devices under the same
power budget. Meisner et al. [43] argue that the PDUs’
effi-ciency remains in green zone above 80% for server utilization.
At lower server utilization levels, the PDU efficiency drops
below 70%. PDU scheduling scheme, PowerNap, is devised to
achieve higher efficiency. PowerNap deploys redundant array
of inexpensive load sharing (RAILS) commodity PDUs. PDUs
operating at less than 80% are shifted to nap mode, and their
load is shifted to adjacent PDUs.
DC power distribution architectures achieve better efficiency
than the ac power distribution due to lesser ohmic power loss.
However, dc power distribution is prone to voltage spikes that
can cause device failure. Voltage spike protection devices need
to be added to the dc power distribution architecture for safe
operations. Researchers have investigated the role of dc/dc
converter that acts as a voltage stabilizer in a 400-V dc power
distribution system [44]. The dc/dc converter consists of hybrid
pair silicon super junction and silicon carbide Schottky barrier
diode that result in low conduction and low power loss. The
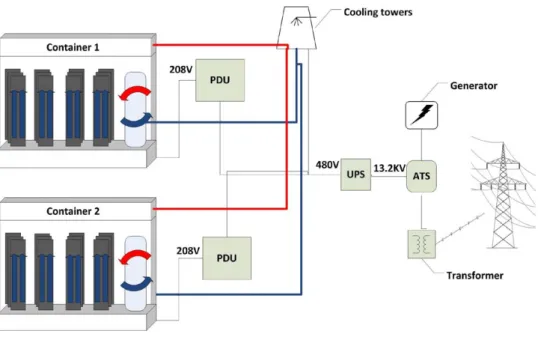
Figura 5. Data center power distribution [20].
use a significant amount of energy to supply three key components: IT equipment, cooling, and power delivery. These energy needs can be better understood by examining the electric power needed for typical data center equipment in and the energy required to remove heat from the data center [13].
Figure 5 shows a scheme of the electricity distribution in a data center. A transfer switch is an electrical switch that switches a load between two sources. Some transfer switches are manual, in that an operator effects the transfer by throwing a switch, while others are automatic and trigger when they sense one of the sources has lost or gained power. An Automatic Transfer Switch (ATS) is often installed where a backup generator is located, so that the generator may provide temporary electrical power if the utility source fails. Every data center is supplied with an UPS unit (uninterruptible power supply). The UPS is a backup that prevent the equipment from power disruption. It includes batteries and a AC/DC converter to charge the batteries. Then, power is converted from AC to DC before leaving the UPS.
Power leaving the UPS enters a power distribution unit (PDU), which sends power to the IT equipment in the racks. Electricity consumed in UPS and PDU is not irrelevant.
Power leaving the PDU is converted from AC to low-voltage DC power in the server power supply unit (PSU). The low-voltage power is used by:
• central processing units (CPU); • memory;
• disk drives; • chipset; • fans;
• storage devices;
• voltage regulators, that adjust the DC voltage bufore reaching the CPU.
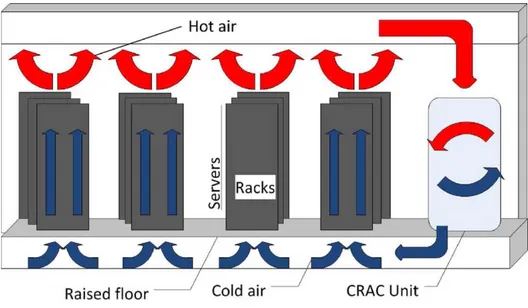
All these appliances generate a significant amount of heat that must be removed from the data center. For this reason, every data center has a CRAC (computer room air conditionin) unit. Air enters the top of the CRAC unit and is conditioned. Then, the air is supplied to the IT equipment through a raised floor plenum [13]. Figure 6 shows a typical CRAC system.
Paolo Vecchiolla - Tesi di Diploma
512 IEEE SYSTEMS JOURNAL, VOL. 10, NO. 2, JUNE 2016
greater than 10 W/cm
3that is ideal for blade servers and SoC
server designs.
C. Server Cooling
A large portion of data center power is used in cooling
measures for large number of heat dissipating servers and
power distribution systems. The cooling measures account for
38% of total data center power, whereas 6% of power is lost
in power distribution [6]. As this power is not utilized in
computing work, it is considered wasted and degrades the data
center performance metric, PUE. Heat removal has been the
key for reliable and efficient operation of computer systems
from early days. The increasing heat dissipation in computing
chips is contributed to both scale-up and scale-out trends in data
centers [8], with current power density estimated at 3000 W/m
2[45]. Scale-out trends have led to more densely populated
data centers, thus requiring dynamic thermal management
tech-niques. Scale-up trends are pushing more transistors on small
chip space. In such scale-up designs, the shrinking dimensions
have led to higher power consumption by leakage currents.
The transistor switching power has not reduced fast enough
to keep pace with increasing transistor densities; hence, chip
power density has increased [8]. As the root of heat dissipation
in data centers, the transistors and their constituent materials
require consideration for parameters, such as leakage power
per unit area. For now, chip heat dissipation continues to rise
with power and transistor density and requires integrated
fluid-cooling mechanisms at data center level [46]. ASHRAE has
suggested maximum server inlet temperature of 27
◦C for data
center environments [47]. Every 10
◦C rise in temperature
over 21
◦C can result in 50% decrease in hardware reliability
[48]. A network of temperature sensors is usually deployed
to monitor thermal dynamics of data centers [49]. Thermal
resource management has been modeled with computational
fluid dynamic techniques. There are two thermal management
techniques in data centers: a) air-flow-based solution; and
b) fluid-based solution [8].
Liquids are more efficient in heat removal than air due to
higher heat capacities. However, fluid cooling comes with
in-creased mechanical complexity [8]. IBM supercomputing node
575 with racked core design comes with modular water-cooling
units (MWUs) for a heat exchange system [50]. Each node in
the rack-mounted supercomputer connects to two fluid couplers
that supply water to cold plates. Cold plates are coupled to chips
by conduction through a thermal interface material. An
air-to-liquid heat exchanger, rear-door heat exchanger (RDHX), acts
as exhaust and cools the air exiting the racks. Water is supplied
to the RDHX and the fluid couplers by the MWU. In the hybrid
fluid–air cooling system, 80% of heat dissipated is rejected to
the MWU, whereas the rest of the heat is rejected to room air.
The MWU consumes 83% less power than the conventional air
cooling systems [50]. Fluid cooling comes with the advantage
of waste heat utilization. The thermal energy transferred to
the coolant can be reused for heating in cold climates [51],
[52]. Moreover, fluid-based cooling is emission free and further
Fig. 5. CRAC.
[53]. Researchers have also proposed green energy sources
such as solar and wind energy for data centers and computing
clusters [54]. The amount of energy generated by the renewable
sources varies due to weather conditions. However, the data
center requires a fixed input current to operate the cluster of
servers. Li et al. [55] proposed SolarCore, a hybrid power
utilization architecture that switches between solar and grid
power. SolarCore maximizes solar energy utilization by
match-ing supply power with utilized power and handles power
varia-tions using DVFS to processor cores. iSwitch architecture [56],
utilizing wind energy, switches the computing load between
energy sources to balance the supply load variations. Compute
load switching is enabled by the virtual machine migration in
data center environments.
Computer room air conditioning (CRAC) units utilize air
ventilation and conditioning techniques to dissipate heat
pro-duced by data center resources. Air-side economizer can be
utilized for free cooling in regions of low temperature and
humidity [57]. Higher server utilization and CRAC unit
fail-ures can lead to nonuniform heat distribution and hot spots
in specific racks. Dynamic provisioning of cooling resources
is required for the nonuniform heat profiles of data centers
[45]. Dynamic thermal management of data centers results
in benefits such as: a) uniform temperature distribution with
reduced hot spots; b) reduced cooling costs; and c) improved
device reliability [49]. Dynamic thermal management
tech-niques have varying approaches to cooling data centers such
as workload placement in cool racks [48], combined workload
placement and cooling management techniques, and virtual
machine placement techniques [36]. A typical CRAC
config-uration is depicted in Fig. 5.
III. STORAGE
SYSTEMS
Memory devices account for 5% of electricity consumption
within the data center. Storage volumes continue to increase
50%–70% per year. Cloud data centers often provide Data as
a Service (DaaS) facilities. DaaS facilities maintaining user
data have to meet the often conflicting requirements of high
availability, redundancy, and energy efficiency [2]. There are
two basic techniques to achieve energy efficiency in data center
storage medium: a) making storage hardware energy efficient;
and b) reducing data redundancy [58]. To reduce data
redun-Figura 6. CRAC [20].
Most air circulation in data centers is internal to the data center zone. The majority of data centers are designed so that only a small amount of outside air enters.
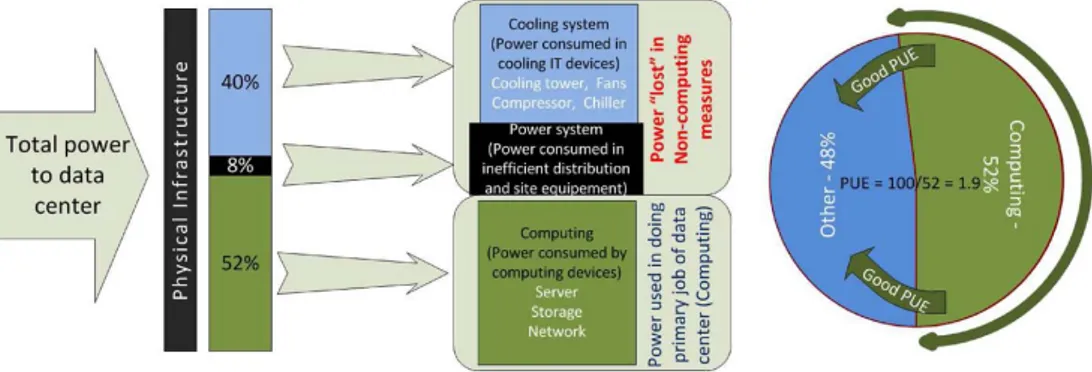
Shuja et al. [20] showed how the power is distributed among a typical physical infrastructure among cooling, power distribution, and computing units.
Shuja et al. [20] show some examples of data center power consumtpion. «A medium-size data center with 288 racks can have a power rating of 4 MW. The data center power infrastructure is complex, and power losses occur due to multistage voltage conversions. Power loads of the medium-size data center require high-voltage power supply of up to 33 kV. This high-voltage supply is stepped down to 280–480 V range by automated transfer switches. The stepped-down voltage is supplied to an uninterrupted power supply (UPS) system. The UPS converts the ac to dc to charge the batteries and converts dc back to ac before supplying power to the PDUs. The PDU steps down voltage according to specification of each computing unit. The multiple power conversion phases have efficiency in the range of 85%–99%, which results in power losses.» Figure 7 shows graphically how a PUE is calculated. An energy-efficient data center with a lower PUE index can lead to several benefits such as:
• reduced energy consumption, hence, lesser operational expenses; • lesser greenhouse gas emissions; and
• lesser device costs.
Historically, the average PUE ratio between 2000 and 2007 was frozen to 2.0 [13]. From 2007, the PUE has been decreasing thanks to:
• volume server virtualization; • energy efficient servers; • better power management.
Today, there are several best practices to notice:
• the SUPERNAP 7 data center in Las Vegas has a third-party audited colocation PUE of 1.18; • the Green IT Cube in Darmstadt was dedicated with a 1.07 PUE.
Paolo Vecchiolla - Tesi di Diploma
508 IEEE SYSTEMS JOURNAL, VOL. 10, NO. 2, JUNE 2016
Fig. 1. Power distribution among physical infrastructure.
is consumed in cooling measures instead of computing. An energy-efficient data center with a lower PUE index can lead to several benefits such as: a) reduced energy consumption, hence, lesser operational expenses; b) lesser greenhouse gas emissions; and c) lesser device costs [11]. Data center operators are also interested in the total cost of ownership: the sum of capital expenses (capex) required in setting up the data center and the operational expenses (opex) required in running the data center [6]. Fig. 1 illustrates the distribution of data center power among cooling, power distribution, and computing units. A. Research Problem Discussion
The fact that the energy consumption is distributed among many data center resources and their components, an ideal energy-efficiency approach requires consideration of all data center resources, including the server (i.e., motherboard, fan, and peripherals), network devices (i.e., chassis, line card, and port transceivers), storage devices (i.e., hard disks, RAM, and ROM chips), and cooling devices (i.e., fans and chillers) [5]. While achieving lower PUE index, cloud providers have to provide quality services in an ever-increasing competitive cloud market. Cloud providers hosting diverse applications need to maintain service-level agreements; (SLAs), achieve low access latencies; meet task deadlines; and provide secure, reliable, and efficient data management. Cloud provider business objectives often conflict with low-cost hardware designs and resource optimization techniques deployed in back-end data centers for energy efficiency. Data center energy optimization is a hard problem due to online consideration of dynamic factors such as workload placement, resource mapping, cooling schedule, in-terprocess communication, and traffic patterns. However, cloud providers have been forced to consider energy optimization techniques for back-end data centers due to escalating energy bills and competitive price market for cloud services [12].
The average workload on the data center usually remains at 30% and does not require functioning of all computing resources [11]. Therefore, some of the underutilized resources can be powered off to achieve energy efficiency while fulfilling the data center workload demands. However, scheduling of data center resources requires careful considerations of data center traffic patterns, client SLAs [13], latency and perfor-mance issues [14], network congestion [11], and data replica-tion [15]. Data center energy-efficiency controllers for servers
cannot be ignored while optimizing data center resources for energy efficiency [17], [18]. Researchers have proposed a resource optimization strategy composed of confidentiality, integrity, and authentication measures considering real-time computation and deadline constraints [19]. The practice of data center resource optimization was considered taboo previously due to business continuity objective. Google recently published a data center resource management patent that shows that large IT companies are now focusing on the issue of energy efficiency [12]. Cloud providers deploy redundant resources to ensure 99.9% availability of services. On the other hand, energy efficiency advocates minimizing the data center resources while eliminating redundancy. In order to achieve energy efficiency without compromising quality of service (QoS) and SLAs, data center resources need to be managed carefully according to the workload profile of cloud service.
In this paper, we present the concept of a central high-level energy-efficiency controller (see Fig. 2) for data centers. The data center controller interacts with resource-specific con-trollers (i.e., server, memory, and network) in a coordinated manner to make decisions regarding workload consolidation and device state transitions (sleep, idle, etc.) for energy effi-ciency. User SLAs enforce cloud providers to ensure a required performance level to meet business objectives. The data center controller is required to make resource consolidation and state change decisions based on workload profile to avoid SLA violations. The data center controller divides control among various resource controllers that manage a single data center resource domain. However, the resource controllers often work in opposing manner to counter each other’s effects [20], [21]. Therefore, to manage data center energy efficiency, the resource controllers’ coordinate control mechanism between data center resources through the central controller. Resource controllers’ coordinate workload conditions within their domain such as network congestion, server overload, and thermal hotspots to the central controller to avoid further workload placement. The central controller takes decision at a global level and forwards feedback to resource controllers in order to mitigate adverse workload conditions. The feedback helps resource controllers make decisions regarding device state transitions that result in energy efficiency while meeting SLA requirements.
To optimize energy, the central controller employs both hardware- and software-based techniques for all data center resources. This survey has been organized considering three Figura 7. Power distribution among physical infrastructure [20].
C
h
a
p
t
e
r
3
Energy efficiency
Apart from increasing the efficiency of the CRAC, the energy efficiency can be enhanced by increasing the energy efficiency of the servers. According to Beloglazov et al. [5], cloud computing naturally leads to energy-efficiency by providing the following characteristics:
• economy of scale due to elimination of redundancies; • improved utilization of the resources;
• location indipendence - VMs can be moved to a place where energy is cheaper; • efficient resource management by the Cloud provider.
For the purpose of this work, the effort of researcher is subdivided in three levels, depending on which part of the "computing service" it changes:
1. hardware level; 2. data center level;
3. service level (considered as the whole set of data centers working for the same purpose).
3.1
Hardware level
One of the approaches to increase the energy efficiency is to develop more energy-efficient hardware. IT hardware are labeled by US Energy Star or the European CTO Certification, which rate products according to their environmental impact.
For the purpose of this work, three different efforts for server energy efficiency are listed here: • solid-state discs;
• mechanisms like SpeedStep, PowerNow, Cool’nQuiet or Demand Based Switching, that power off parts of the hardware, slow down CPU clock speed, or put them in hibernating mode if they are idle (the decision on which hardware must be powered off is not part of this level) [6];
• the Advanced Configuration and Power Interface (ACPI) specification defines four different power states that an ACPI-compliant computer system can be in. These states range from G0-working to G3-mechanical-off. The states G1 and G2 are subdivided into further substates that describe which components are switched off in the particular state. The ACPI gives the energy control to the Operating System, while the other technologies gives the control to the BIOS.
Paolo Vecchiolla - Tesi di Diploma
II.
B
ACKGROUND AND
M
OTIVATION
The classic design of data center architectures interconnects
servers and switches in two- or three-tier structures, being the
three-tier structures the most widely adopted [10]. Three-tier
topologies consist of three layers. The lowest level
intercon-nects the computing servers to the network through access
switches. The aggregation and core layers provide connectivity
towards the data center gateway. Three-tier architectures such
as the fat-tree proposed by Al-Fares et al. [11], PortLand [12],
VL2 [13] and Jupiter [14] are switch-centric architectures. In
these topologies, the network switches in upper layers are
specialized and high power demanding devices. Moreover,
computing servers do not participate in forwarding
opera-tions and experience the so called bandwidth-oversubscription
problem [8]. Server-centric architectures like BCube [15] and
DCell [16] do not experience bandwidth oversubscription, at
the cost of having the servers actively engaged in routing and
packet forwarding. Moreover, all the network switches are low
power demanding and very cheap commodity switches.
Several studies have analyzed and compared data center
architectures. In a very first study, Popa et al. [18] provided
a cost comparison analysis of several data center
architec-tures, including both switch-centric and server-centric designs.
Shang et al. [9] analyze energy proportionality in data center
architectures under different routing strategies, namely
high-performance and energy-aware policies. Similarly to [9], in this
work we also focus on the energy proportionality by
consider-ing multiple power consumption profiles for the networkconsider-ing
equipment. Unlike previous studies, our analysis builds on
two different resource allocation policies having considered
the same energy-aware routing strategy.
The problem of resource allocation in cloud computing
data centers consists of assigning to incoming VMs, jobs or
tasks, a set of resource such as CPU cycles, RAM space,
storage, bandwidth or their combination. Optimizing the
allo-cation process can limit power consumption costs and provide
consistent savings. For example, VMPlanner [19] shows that
jointly optimizing VM placement and traffic flow routing not
only helps in reducing power consumption, but also optimizes
traffic distribution. HEROS [20] proposes a network- and
energy-aware scheme for heterogeneous data centers, where
the computing equipment can consists of many- and
multi-core architectures, asymmetric multi-cores, coprocessors, graphics
processing units and solid-state drives.
To the best of our knowledge, a very little attention has
been devoted to analyze the problem of resource allocation
in different data center networks. The most similar study to
our work is [21], where three-layer, fat-tree, BCube and DCell
topologies have been considered for performance evaluation
of a virtual machine placement policy that aims at
address-ing energy-efficiency and traffic engineeraddress-ing. However, this
analysis lacks consideration of energy proportionality of the
devices. In addition, our study performs a large-scale analysis
as we compare the performance of data center architectures
hosting thousands of servers. Moreover, we jointly investigate
the effect on the overall system performance of realistic power
consumption profiles and network-aware resource allocation
policies. To illustrate, workload consolidation policies save
energy by allocating and consolidating incoming VMs in a
0
l
max0
P
peakP
idleLoad
l
Po
wer
P
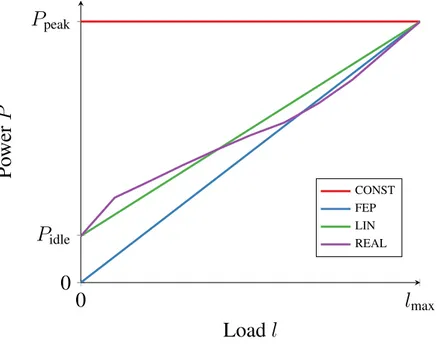
CONST FEP LIN REALFig. 1.
Power consumption profiles for the IT equipment
be turned off or put in sleep mode. However, turning off
energy proportional devices and consolidating the workload
over highly non-proportional devices leads to a waste of
energy.
III.
P
OWER
C
ONSUMPTION IN
D
ATA
C
ENTER
A
RCHITECTURES
We consider a data center in which
S servers are
con-nected through a generic packet network. The cloud controller
receives the requests from the tenants and allocates the VMs
on the basis of a set of resources (CPU, memory, storage)
to be available in the server designed for allocation. The
communication requirements are modeled for each VM as the
amount of traffic requested for any pair of VMs. The cloud
controller is assumed to be aware of the network state as
well. Indeed, to satisfy the communication requirements, the
network must guarantee sufficient bandwidth for all the paths
traversed by the communication flows between the VMs.
A. Data Center Architectures
For the analysis, we take into account two- and three-tier
architectures [10] and Jupiter [14], the architecture Google
currently implements in its data centers. All these architectures
are switch-centric and based on a Clos construction. Given
any basic building block, Clos networks scale indefinitely. In
particular, the two-tier architecture is typical for small data
centers within the same POD and based on a classical 3 stage
Clos switching network. Instead, the three-tier architecture is
typical of large data center, spanning multiple PODs, and it is
based on a classical 5 stage Clos network. Finally, the Jupiter
architecture has been designed for massively large data centers
and it is based on a multi-stage Clos topology, built from
commodity switches. All building blocks of this architecture
are heterogeneous. The smallest unit is composed by a set
of switches called TOR and used for building the blocks of
each layer. Inside blocks switches can be placed on two levels.
The Aggregation blocks are splitted in sub-groups (called
Middle Blocks), also composed by TOR. In our work we do
not consider the recently proposed server-centric architectures,
since they are not actually implemented in current facilities,
mainly because of the high cost and complexity in cabling [14].
B. Power Consumption Models
Fig. 1 illustrates the profiles modeling the power
consump-tion of IT equipment. The power profile of an ideal device
does not consume any power under zero load and it increases
Figura 8. IT equipment power consumtpion and its modeling [18].
3.2
Data center level
Servers are the most prominent and energy-hungry element of the data centers. Policies are developed that use economic criteria and energy as criteria to despatch jobs to a small set of active servers, while other servers are down to a low power state. A guiding focus for research is the goal of designing data centers that are "power-proportional", i.e., use power only in proportion to the load. Fig. 8 illustrates the real profiles of IT equipment power consumption and the most used modeling [18]. The power consumption profile of a real device is typically described by a generic function where at the loadsl = 0andl = lmaxcorrespond toPidle
andPpeakrespectively.
An ideal data center network would connect every node with every node within the data center so that cloud applications can be indipendent of resource location. However, such scale interconnects are not possible in data centers with tens of thousands of nodes. Therefore, data centers networks are usually hierarchical in nature with multiple subhierarchies connectes to each other through switches. Although the number of routers and switches inside the data center is much less than the number of servers, still the network devices consume 5% of the datacenter electricity as the router peak power can be 90 times greter than than of a server. Ruiu et al. [18] modeled two different allocation policies:
• Random Server Selection (RSS) chooses at random one server to allocate the new VM;
• Min-Network Power (MNP) chooses the server with minimum network power cost for the VM to communicate with its already allocated destination VMs;
and compared the performance of different data center architectures (two-, three-tier and Jupiter). They demonstrated how optimized resource allocation strategies such as MNP load the data center in a energy-proportional manner and this is independent of the specific network topology. Although, the two and three-tier architectures provide significant benefits than Jupiter in terms of the power spent per VM.
Shuja et al. [20] presented the concept of a central high-level energy -efficiency controller for data centers. «The data center controller interacts with resource-specific controllers. It divides control among various resource controllers that manage a single data center resource domain. To optimize energy, the central
Paolo Vecchiolla - Tesi di Diploma
controller employs both hardware- and software-based techniques for all data center resources. This survey has been organized considering three main resources in the data centers, i.e. server, storage and network devices.»
The power consumed by the equipment is proportional not only to the load (CPU), but also to the sqare of the voltage. For this reason, many researchers have proposed Dynamic Voltage and Frequency Scaling (DVFS) techniques for power efficiency in data centers [20]. However, next-generation semiconductor technology would operate on optimal voltage that would not be further minimized.
3.3
Service level
While many efforts have been put to improving the energy efficiency of server side in the past years, the power consumption of networking is becoming a considerable part in data centers.
According to Varghese et al. [21], useful contribution in sustainability of data centers can be achieved by developing algorithm that rely on geographically distributed data coordination, resource provisioning and carbon footprint-aware and energy-aware provisioning in data centers. In other words, there is a trade off between performance of the cloud resource and energy efficiency.
Modern cloud infrastructure are geo-distributed. Geo-distribution offers three advantages:
• latency gains come at the cost of potentially larger total data center capacity compared to a single very large data center
• geo-distribution can safeguard against failures that backup resourses and isolation techniques such as availability zone at a single site cannot;
• the possibility to exploit regional differences in energy prices or availability of renewable energy. Nevertheless, geo-distribution leads to excess capacity. Narayanan et al. [15] determined the lowest excess capacity required. In other words, they wanted to understand the minimum capacity required to realize the advantages of geo-distribution. They solved the following optimization problem: to determine the capacitycj
for the data center al location j, such that there is sufficient capacity to serve all of the client demand within
a latency targetl, when no data centers have failed and within latencyl0> lwhen up to one data center has
failed, while minimizing the total cloud capacity.
3.3.1 Load balancing
According to Shang et al. [19] it is an ideal objective for operators to make the power consumption of data center networks proportional to the amount of network loads they carry. Proportionality becomes the buzzword in this contest. In fact, the non-proportionality causes plenty of "always-on" idle network devices in data center networks and wastes a great amount of energy when the traffic load is low. The energy proportionality of a DCN indicates the variation behavior of network power consumption as the network load increases in the DCN. It reveals how much of the maximum network power consumption will be consumed when the network load is only a fraction of full loads. Therefore, the energy proportionality can be taken as an effective indicator for energy efficiency of DCNs. Shang et al. [19] analyzed the energy proportionality among different DCN architectures. The comparison results demonstrate that the DCell topology consumes the lowest energy when without using any energy conservation strategy, and the Bcube topology with HPR has the better energy proportionality than others when network components supporting the sleeping technology.
Zhou et al. [22] jointly consider the electricity cost, service level agreement (SLA) requirement and emission reduction budget of geographically distributed data centers. To navigate such a three-way trade off, they rigorously design and analyze a carbon-aware online control framework using Lyapunov Optimization. The framework dynamically makes three decisions: geographical load balancing, capacity right sizing and server speed scaling.
Paolo Vecchiolla - Tesi di Diploma
Virtualization Beloglazov et al. [5] proposed an energy efficient resource management system for
vir-tualized Cloud data centers that reduces operational costs and provides required Quality of Service. Their purpose is on energy-efficient resource management strategies that can be applied on a virtualized data center by a Cloud provider. The main instrument that they leverage is live migration of VMs. The ability to migrate VMs between physical hosts with low overhead gives flexibility to a resource provider as VMs can be dynamically reallocated according to current resource requirements and the allocation policy. VMs are reallocated according to current CPU, RAM and network bandwith utilization. Thermal optimization of physical nodes is considered: the aim is to avoid "hot spots".
According to the authors, the VM reallocation problem can be divided in two: selection of VMs to migrate and determining new placement of these VMs on physical hosts. Tha main idea of the policies is to set upper and lower utilization thresholds and keep total utilization of CPU created by VMs sharing the same node between these thresholds. If the utilization exceeds the upper thresholds, some VMs have to be migrated from the node to reduce the risk of SLA violation. If the utilization goes below the lower thresholds, all VMs have to be migrated and the node has to be switched off to save energy consumed by the idle node.
Khosravi et al. [12] proposed a VM placement algorithm by considering distributed Cloud data centers with the objective of minimizing carbon foorprint. The broker is the Cloud provider’s interface with the Cloud users. It makes the placement decision based on the data centers’ power usage effectiveness (PUE), energy sources carbon footprint rate and proportional power. The broker recieves a VM request and selects the best physical server for the VM.
3.3.2 Fog computing
Baliga et al. [4] showed that energy consumption in transport and switching can be a significant percentage of total energy consumption in cloud computing. According to them, under some circumstances cloud computing can consume more energy than conventional computing where each user performs all commuting on their own personal computer. In this paper, the authors present an overview of energy consumption in conventional computing. For this comparison, the energy consumption of conventional computing is the energy consumed when the same task is carried out on a standard personal computer that is connected to the Internet but does not utilize cloud computing.
Jalali et al. [10] compared energy consumption of a service provided by nDCs and centralized DCs. From their study, a number of findings emerge, including the dactoris in the system design that allow nDCs to consume less energy than its centralized counterpart. These include the type of access network attached to nano servers and nano server’s time utilization (the ratio of the idle time to active time). The authors use the term fog computing in order to refer to a platform for local computing, distribution and storage in end-user devices rather than centralized DCs. Their results indicate that while nDCs can save a small amount of energy for some applications by pushing content closer to end-users and decreasing the energy consumption in the transport network, they also can consume more energy when the nano servers are attached to an energy-inefficient access network or when the acrive time of dedicated nano serves is much greater than its idle time. They investigated what type of applications can be run from nano servers to save energy. They found a list of parameters that have a significant role. They showed that the best energy savings using nano servers comes from applications that generate and distribute data continuously in end-user premises with low access data rate such as video surveillance applications. Consequently, the most energy efficient strategy for content storage and distribution in cloud applications may be a combination of centrilized DCs and nano servers.
C
h
a
p
t
e
r
4
Renewables
Large IT companies have started to build datacenters with renewable energy, such as Facebook’s solar powered data center in Oregon and Green House Data’s wind-powered datacanter in Wyoming.
Khosravi et al. [12] a pag. 318 dice che dovrebbero esserci rinnovabili e cita l’articolo 24.
Deng et al. [8] provided a taxonomy of the state-of-art research in applying renewable energy in cloud computing datacenters from five key aspects, including generation models and prediction methods of re-newable energy, capacity planning of green datacenters. To measure how clean is a datacenter, the Green Grid organization proposes a new sustainability metric, carbon usage effectiveness (CUE) is defined as: CUE
= Total CO2Emissions caused by Total Datacenter Energy/IT Energy Consumption. They found that Google
(39.4 percent clean energy) and Yahoo (56.4% clean energy) are active in supporting policies. On the other side, Amazon, Apple and Microsoft, rapidly expand their cloud business without adequate attention on the electricity source. Deng et al. found three ways in order to get cleaner data centers:
• Cloud service providers typically own geographically distributed datacenters. They can distribute workloads among geo-dispersed datacenters to benefit from the location diversify of different types of available renewable energies.
• Cloud datacenters usually support a wide range of IT workloads, including both delay-sensitive non-flexible applications such as web browsing and delay-tolerant non-flexible applications such as scientific computational jobs. The workload flexibility can tackle the challenges in integrating intermittent renewable energy by delaying flexible workloads to period when renewable sources are abundant without exceeding their execution deadlines.
• Cloud datacenters connect to grids at different locations with time-varying electricity prices. Renewable energy is a means to mitigate the risk against the future rise in power prices.
• Datacenters usually equip with uninterrupted power supply (UPS) in case of power outages. Since UPS battery is usually over-provisioned, UPS can store energy power when the renewable energy is insufficient.
Deng et al. [8] showed that with the presence of the intermittent renewable power, inefficient and redundant workload matching activities can incur up to 4X performance loss. "iSwitch explores the design tradeoffs between load tuning overhead and green energy utilization in renewable energy driven datacenters. Servers are divided into two groups: one is powered by grid while the other is powered by on-site wind energy. Based on the availability of wind energy, iSwitch can mitigate average network traffic by 75 percent, peak network traffic by 95 percent and reduce 80 percent job waiting time while still maitaining 96 percent renewable energy utilization."
Paolo Vecchiolla - Tesi di Diploma
Deng et al. [8] also faced the problem of forecasting. Since renewable energy is highly variable, it is important to predict the available energy when scheduling workloads to match renewable energy supply. There are two different approaches:
• predicting the energy generation (for example, solar generation);
• load-scheduling system: predicting the energy generation as a function inversely related to the amount of clooud coverage.
According to this second approach, two load-scheduling systems were designed: GreenSlot and GreenHadoop provide energy cost savings of about 25 percent.
C
h
a
p
t
e
r
5
Conclusion
This work examines how big the problem of cloud and ICT emissions is, and then makes a review of some of the efforts to increase the energy efficiency. Big data center of big companies have already reached a low PUE, resulting in a good level of efficiency. Nevertheless, most recent research is concentrated at network level more than on hardware or data center level.
Not always cloud computing is the most efficient way to reach the target of computing required for any specific task. For example, a lot of work is necessary to understand how the IoT impacts the energy consumption. In particular, it is crucial to understand for which application fog computing is more efficient than cloud computing.
Bibliography
[1] W. M. Adams, Power consumption in data centers is a global problem.
https://www.datacenterdynamics.com, 2018.
[Online; accessed 16-November-2019].
[2] A. S. G. Andrae, Total consumer power consumption forecast, in Nordic Digital Business Summit, Global Forecasting of ICT footprints, 2017.
[3] A. Atrey and N. Jain, A study on green cloud computing, International Journal of Grid and Distributed Computing, 6 (2013), pp. 93–102.
[4] J. Baliga, R. W. A. Ayre, K. Hinton, and R. S. Tucker, Green cloud computing: Balancing energy in processing, storage and transport, in Proceedings of the IEEE, vol. 99, No. 1, IEEE, 2011.
[5] A. Beloglazov and R. Buyya, Energy efficient resource management in virtualized cloud data centers, in 10th International Conference on Cluster, Cloud and Grid Computing, IEEE ACM, 2010.
[6] A. Berl, E. Gelenbe, M. D. Girolamo, G. Giuliani, H. de Meer, M. Q. Dang, and K. Pentikousis, Energy-efficient cloud computing, The Computer Journal, 53 (2010).
[7] K. Bilal, S. U. Khan, L. Zhang, H. Li, K. Hayat, S. A. Madani, N. Min-Allah, L. Wang, D. Cheng, M. Iqbal, C. Xu, and A. Y. Zomaya, Quantitative comparisons of the state-of-the-art data center architectures, Concurrency Computat.: Pract. Exper., 25 (2013), pp. 1771–1783.
[8] W. Deng, F. Liu, H. Jin, B. Li, and D. Li, Harnessing renewable energy in cloud datacenters: Opportunities and challenges, in IEEE Network, January - February 2014.
[9] W. Deng, F. Liu, H. Jin, C. Wu, and X. Liu, Multigreen: cost-minimizing multi-source datacenter power supply with online control, in 4th international conference on Future energy systems, ACM, 2013. [10] F. Jalali, K. Hinton, R. Ayre, T. Alpcan, and R. S. Tucker, Fog computing may help to save energy in
cloud computing, IEEE Journal on selected areas in Communications, 34 (2016).
[11] F. Jalali, A. Vishwanath, J. de Hoog, and F. Suits, Interconnecting fog computing and microgrids for greening iot, in Innovative Smart Grid Technologies - Asia, IEEE, 2016.
[12] A. Khosravi, S. K. Garg, and R. Buyya, Energy and carbon-efficient placement of virtual machines in distributed cloud data centers, in Euro-Par 2013 Parallel Processing, Springer Berlin Heidelberg, 2013. [13] J. Loper and S. Capana, Report to congress on server and data center energy efficiency: Public law 109-431,
in Alliance to Save Energy, Ernest Orlando Lawrence Berkeley National Laboratory, 2008.
[14] D. S. Markovic, D. Zivkovic, I. Branovic, R. Popovic, and D. Cvetkovic, Smart power grid and cloud computing, Renewable and Sustainable Energy Reviews, 24 (2013), pp. 566–577.
Paolo Vecchiolla - Tesi di Diploma
[15] I. Narayanan, A. Kansal, A. Sivasubramaniam, B. Urgaonkar, and S. Govindan, Towards a leaner geo-distributed cloud infrastracture, in 6th Workshop on Hot Topics in Cloud Computing, USENIX, 2014.
[16] M. Peng, C. Wang, V. Lau, and H. V. Poor, Fronthaul-constrained cloud radio access networks: Insights and challenges, in Wireless Communications 22(2), IEEE, 2015.
[17] H. Ritchie and M. Roser, CO2 and Greenhouse Gas Emissions.
https://ourworldindata.org/co2-and-other-greenhouse-gas-emissions, 2018.
[Online; accessed 16-November-2019].
[18] P. Ruiu, A. Bianco, C. Fiandrino, P. Giaccone, and D. Kliazovich, Power comparison of cloud data center architectures, in Communication QoS, Reliability and Modeling Symposius, IEEE ICC, 2016. [19] Y. Shang, D. Li, and M. Xu, A comparison study of energy proportionality of data center network
archi-tectures, in 32nd International Conference on Distributed Computing Systems Workshops, IEEE, 2012.
[20] J. Shuja, K. Bilal, S. S. Madani, M. Othman, R. Ranjan, P. Balaji, and S. U. Khan, Survey of techniques and architectures for designing energy-efficient data centers, IEEE Systems journal, 10 (2016). [21] B. Varghese and R. Buyya, Next generation cloud computing: New trends and research, Future Generation
Computer Systems, 79 (2018), pp. 849–861.
[22] Z. Zhou, F. Liu, Y. Xu, R. Zou, H. Xu, J. C. S. Lui, and H. Jin, Carbon-aware load balancing for geo-distributed cloud services, in 21st International Symposium on Modelling, Analysis and Simulation of Computer and Telecommunication Systems, IEEE, 2013.
![Figure 2 shows some academic estimate. This data should be compared with the historic and future evolution of greenhouse gas emissions (Figure 3 and Figure 4 respectively), from reference [17]](https://thumb-eu.123doks.com/thumbv2/123dokorg/2926352.18630/7.892.132.726.779.1082/academic-estimate-compared-evolution-greenhouse-emissions-respectively-reference.webp)