Acoustic emission across the magnetostructural transition of the giant magnetocaloric Gd
5Si
2Ge
2Francisco-José Pérez-Reche,1Fèlix Casanova,2Eduard Vives,1Lluís Mañosa,1 Antoni Planes,1Jordi Marcos,1 Xavier Batlle,2and Amílcar Labarta2
1Departament d’Estructura i Constituents de la Matèria, Facultat de Física, Universitat de Barcelona, Diagonal 647, 08028 Barcelona, Catalonia, Spain
2Departament de Física Fonamental, Facultat de Física, Universitat de Barcelona, Diagonal 647, 08028 Barcelona, Catalonia, Spain
共Received 16 September 2005; revised manuscript received 8 November 2005; published 20 January 2006兲
We report on the existence of acoustic emission during the paramagnetic-monoclinic ↔ferromagnetic-orthorhombic magnetostructural phase transition in the giant magnetocaloric Gd5Si2Ge2compound. The
tran-sition kinetics have been analyzed from the detected acoustic signals. It is shown that this trantran-sition proceeds by avalanches between metastable states.
DOI:10.1103/PhysRevB.73.014110 PACS number共s兲: 64.60.My, 64.70.Kb, 62.65.⫹k
I. INTRODUCTION
The interplay of magnetism and structure is at the origin of many of the technologically important properties of func-tional materials such as the giant magnetocaloric effect, mag-netic shape memory, and giant magnetoresistance.1 Magne-tocaloric effects associated with magnetic transitions have received a considerable amount of interest in recent years.2,3
Gd5共SixGe1−x兲4 intermetallics are prominent among the
ma-terials exhibiting such effect and have received a great deal of attention.4,5In these compounds, the giant magnetocaloric
effect is due to the occurrence of a magnetic phase transition which also involves a crystallographic structural change.6,7
This transition is first order, reversible, and can be induced either by changing the temperature,6,7 the pressure,8,9 or
by application of a magnetic field.7,10 In the range
0.24艋x艋0.5, the transition goes from a paramagnetic monoclinic phase towards a ferromagnetic orthorhombic phase on cooling.11
A structural change in a material usually produces changes in the internal strain field, which give rise to elastic waves in the ultrasonic range propagating within the mate-rial. These elastic waves are known as acoustic emission 共AE兲 and they convey information on the dynamics of the mechanism that has generated them.12 Prototypical
solid-solid phase transitions with associated AE are martensitic transitions, for which the analysis of the AE has provided valuable information on the mechanisms and kinetics of the transition.12–16
The mechanisms of the crystallographic change in Gd5共SixGe1−x兲4 involve shearing of planes perpendicular to
the long b axis.6,17Since this mechanism shares some
simi-larities with martensitic transitions, it has been termed “mar-tensiticlike.” Hence, it is expected that such a structural change can generate AE in these kinds of materials. In the present paper we show the existence of AE during the mag-netostructural transition of Gd5Si2Ge2 and we analyze the
kinetics of the transition from the detected AE. Results are discussed in comparison with the well-established AE results in thermoelastic martensitic transitions.
II. EXPERIMENTAL DETAILS
A Gd5Si2Ge2 sample was synthesized by arc melting the
pure elements共commercial 99.9 wt % Gd, 99.9999 wt % Si
and 99.999 wt % Ge兲 in the appropriate stoichiometry under a high-purity argon atmosphere. The sample was placed in a water-cooled copper crucible and was melted several times to ensure good homogeneity. From the as-prepared buttons, the sample was cut with two parallel faces and it was heat treated for homogenization for up to 9 h at 950 ° C under 10−5mbar, inside a quartz tube in an electrical resistance
furnace. After annealing, the quartz tube was quickly taken out of the furnace and was left to cool to room temperature. The crystallographic structure of the sample was studied by room-temperature x-ray diffraction. The material displayed the expected monoclinic structure 共P1121/ a兲 with unit
cell parameters a = 7.577共1兲, b=14.790共3兲, c=7.779共1兲,
␥= 93.09共1兲, in agreement with Ref. 18. Some amounts of a secondary orthorhombic phase共Pnma兲 were also present in the sample.
AE signals were detected by a resonant piezoelectric transducer acoustically coupled to the surface of the sample. The transition was thermally induced using the experimental setup described in Ref. 15. The relative oscillations of the sample temperature were less than 0.01%. The amplified sig-nal 共gain 62 dB兲 was simultaneously processed by two dif-ferent methods. On the one hand, bursts with amplitudes exceeding a fixed threshold were stored using a digitizing oscilloscope, which is capable of recording 104 AE pulses
共1000 points per signal at 1 MHz兲 during the magnetostruc-tural transition. On the other hand, the signal was input into a ring-down frequency meter which renders the count rate N˙ =dN/dt 共number of signals recorded during 1 s兲.
III. RESULTS AND DISCUSSION
Figure 1 shows an example of the reduced counting rate 共r=dN/dT=N˙/T˙兲 recorded as a function of temperature. A clear increase in AE activity is observed for the 280– 260 K temperature range on cooling and 265– 290 K on heating. These ranges coincide with those where the magnetostruc-tural transition takes place, as determined from calorimetric measurements done on the same sample, and thus confirm that there is AE generated during the transition. Acoustic activity across the monoclinic to orthorhombic 共cooling兲
transition is higher than across the reverse transition. Differ-ences in the kinetics of the transition between cooling and heating were also reported in Gd5Si1.9Ge2.05 from voltage
generation measurements.19 It is worth noting that the
re-corded AE is very weak during both heating and cooling runs, as compared, for instance, to the activity recorded dur-ing thermoelastic martensitic transitions for which the overall number of recorded counts typically exceeds
the AE recorded here by more than three orders of magnitude.20
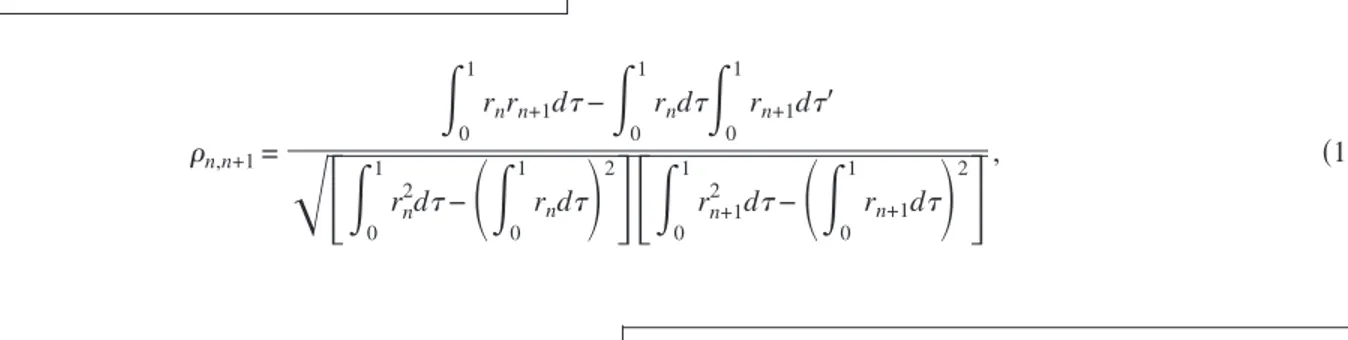
The reproducibility of the AE pattern during the magne-tostructural transition was studied. To this end, we performed up to⬃30 complete thermal cycles. A quantitative evaluation of the similarity in the AE pattern is achieved by computing the correlation functionn,n+1between the reduced AE activ-ity of two consecutive cycles defined as21
n,n+1=
冕
0 1 rnrn+1d−冕
0 1 rnd冕
0 1 rn+1d⬘
冑
冋
冕
0 1 rn 2 d−冉
冕
0 1 rnd冊
2册冋
冕
0 1 rn+12 d−冉
冕
0 1 rn+1d冊
2册
, 共1兲where⬅共T−Ti兲/共Tf− Ti兲, Tiis a temperature above共below兲 the starting transition temperature on cooling共heating兲, and Tf is a temperature below 共above兲 the finishing transition temperature on cooling 共heating兲. The value of n,n+1 quantifies how much the reduced acoustic activity as a func-tion of temperature in the nth cycle resembles that of the 共n+1兲th. When rn is very similar to rn+1,n,n+1 is close to unity.
The correlation functionn,n+1versus the cycle number n is presented in Fig. 2 for cooling and heating runs. In both cases, a clear increase in correlation is observed with cy-cling, which indicates that the transition becomes progres-sively more reproducible. Such an increase is very fast for the reverse transition 共heating兲. It occurs for the first 7 – 8 cycles, after which it saturates. In contrast, the increase is smoother on cooling.
Acoustic activity during the magnetostructural transition
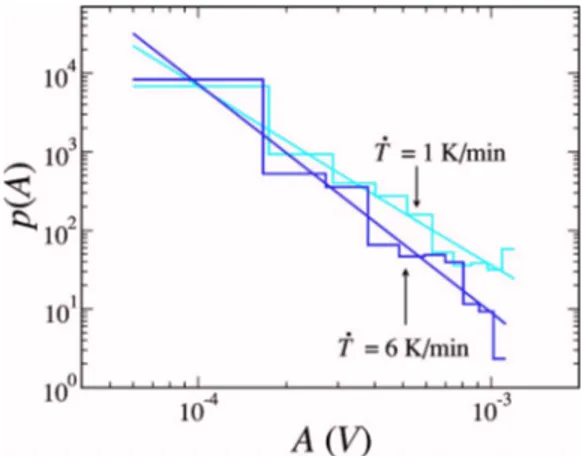
corresponds to individual AE signals共bursts兲 which is a sig-nature of the jerky character of the transition. We also per-formed a statistical analysis of the individual signals re-corded during cooling. These runs are carried out once the system has been cycled a sufficient number of times for the transition to be reproducible. The low number of signals re-corded during heating prevented us from performing a reli-able statistical analysis of the reverse transition. Figure 3 shows the AE amplitude distribution p共A兲 of the signals re-corded at cooling rates共T˙兲 1 K/min and 6 K/min. In addi-tion, to improve statistics, we used all the signals recorded during 40 and 170 cycles for T˙ = 1 K / min and T˙ = 6 K / min, respectively. The data exhibit an apparent power-law behav-ior which evidences the absence of a characteristic scale. A more quantitative analysis can be performed by fitting the following probability density with two free parameters, the exponent␣and the exponential correction,
FIG. 1. 共Color online兲 Reduced acoustic activity recorded dur-ing the 13th cycle on共a兲 cooling and 共b兲 heating.
FIG. 2. 共Color online兲 Correlation function between reduced acoustic activity of consecutive cycles. Data corresponding to cool-ing and heatcool-ing runs are represented by different symbols as indi-cated by the legend.
p共A兲 = e −AA−␣
冕
Amin Amax e−AA−␣dA , 共2兲where A is the amplitude of the signals. The normalization factor in the denominator corresponds to the integral of the proposed distribution from the minimum to the maxi-mum of the acquired amplitudes: Amin= 6⫻10−5V and
Amax= 1.123⫻10−3V. The estimation of the parameters ␣ and is done by using the maximum likelihood method.21,22
This method is much more reliable than the standard least squares method since it is not based on the computation of the histograms which usually depend on the binning choice, and in addition it forces the fitted probability density to be normalized.
The obtained values are ␣= 2.33± 0.03 and = −130± 120 V−1 for T˙ = 1 K / min and ␣= 2.90± 0.05 and =0±246 V−1for T˙ = 6 K / min. The value of is compatible
with=0 in both cases, which indicates that the distribution is well described by a power-law.
The magnetostructural transition in Gd5Si2Ge2 has been
compared by several authors with martensitic transitions which also occur via a shear mechanism. As a particular example, the shear distortion observed in thermoelastic mar-tensitic transitions in Cu-based alloys is about 0.12.23Such a shear distortion is larger than that involved in the magneto-structural transition in Gd5Si2Ge2, which is⬃0.03.17Such a
difference may be considered as a possible reason for the lower acoustic activity detected across the magnetostructural transition.
There is a fundamental difference between a martensitic transition and the magnetostructural transition in Gd5Si2Ge2.
From a purely crystallographic point of view the martensitic transition occurs, on cooling, from a high-symmetry phase to a low-symmetry phase. In contrast, the transition in Gd5Si2Ge2occurs from a low-symmetry phase共monoclinic兲
to a high-symmetry phase共orthorhombic兲. Such a symmetry change does not fit the common framework of phase
transi-tions since it is expected that the high-symmetry phase cor-responds to the high-temperature phase. Nevertheless, the transition in Gd5Si2Ge2 also involves a symmetry change
associated with magnetic degrees of freedom from a para-magnetic phase 共high symmetry兲 to a ferromagnetic phase 共low symmetry兲. Hence, symmetry arguments indicate that the main driving force for the magnetostructural phase tran-sition arises from the magnetic degrees of freedom. It is worth noting that first principle calculations24,25have shown
that exchange coupling is higher in the orthorhombic phase, which stabilizes that phase at low temperatures. Also, for Gd5Ge4, it was shown26 that magnetic degrees of freedom
play a primary role in driving the magnetostructural transi-tion in that compound.
From the above arguments concerning crystallographic changes, the properties of the forward martensitic transition must be compared with those of the reverse magnetostruc-tural transition, and vice versa. Two independent experimen-tal findings are consistent with this point of view. The first is the fact that the amount of AE across the forward magneto-structural transition is greater than across the reverse transi-tion, while, typically for martensitic transitions, AE is greater during the reverse transition.20 The second finding is con-cerned with nucleation. According to TEM experiments,17no
evidence of nucleation of the orthorhombic phase was ob-served on cooling Gd5Si2Ge2. This observation is consistent
with the fact that there is no nucleation for the reverse 共low-symmetry to high-共low-symmetry兲 martensitic transition.
Our results show that acoustic activity evolves towards a more reproducible pattern with thermal cycling through the magnetostructural transition. Actually, some dependence on thermal cycling has been previously reported in resistance,27,28 thermopower,29 and calorimetric
measurements30 in Gd
5共SixGe1−x兲4 alloys. Evolution with
thermal cycling is frequently observed in first-order struc-tural phase transitions as, for instance, martensitic transformations.21 Such evolution has been interpreted as a
learning process in which the system seeks an optimal path for the transition that tends to reduce the dissipated energy and therefore the width of the hysteresis loop. During this learning process the characteristics of the transition evolve towards a reproducible pattern and the entropy change de-creases. In Gd5共SixGe1−x兲4 such evolution has been
associ-ated with the creation of microcracks during cycling.27This
interpretation is, in fact, analogous to the creation of defects 共mainly dislocations兲 during martensitic transition. From these arguments it seems reasonable to associate the evolu-tion in Gd5Si2Ge2 to the structural degrees of freedom
in-volved in the transition.
AE is a very sensitive technique to study the kinetics of a structural transition. Present results show that the temperature-driven magnetostructural transition in Gd5Si2Ge2 proceeds by multiple steps 共avalanches兲 joining
a series of metastable states, until the system is fully transformed. This behavior has been encountered in a wide variety of driven processes in different systems 共rever-sal of the magnetization both in standard metamagnetic transitions31 and magnetostructural transitions,32 martensitic
transition,14,33 emergence of vortices in superconductors,34
vapor condensation in porous media,35 etc.兲. While it is not
FIG. 3. 共Color online兲 Normalized histograms corresponding to the distribution of amplitudes p共A兲 of AE signals recorded during cooling runs at two different cooling rates, T˙ = 1 K / min and
obvious that these systems should show similar properties, they share a common characteristic of being spatially ex-tended, with a complex free energy landscape. Quenched-in disorder is at the origin of such a complex landscape. For all these systems, there is a lack of characteristic duration and size scales of these avalanches, as reflected by power-law distributions. As illustrated in Fig. 3, the amplitude of AE signals recorded here follows a power-law distribution, thus showing that the magnetostructural transition in Gd5Si2Ge2
belongs to such a general class of systems.
The kinetics of these avalanche-mediated, first-order phase transitions has been acknowledged to be athermal共i.e., thermal fluctuations are not dominant when driving the sys-tem from one phase to another兲. The effect of thermal fluc-tuations共athermal degree兲 and also the effect of driving rate on the power-law exponents has been explained in terms of the different time scales involved in driving the transition.15,33Comparison of the amplitude distributions
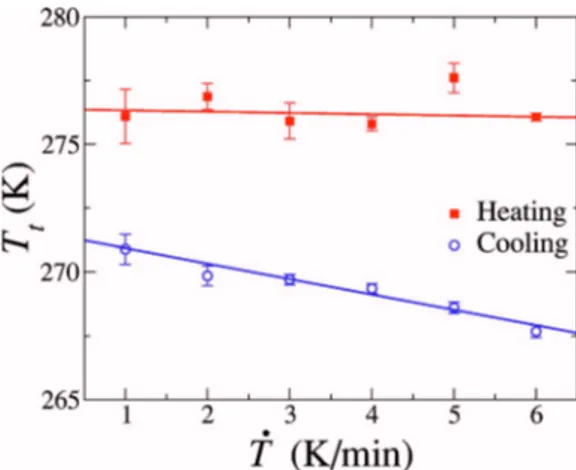
ob-tained for T˙ = 1 K / min and T˙ = 6 K / min shows that the power-law exponent for cooling runs increases for increasing temperature rate. This is the behavior expected for those transitions for which the characteristic time of thermal fluc-tuations is not very different from the characteristic time as-sociated with the change of the external field共temperature in the present case兲. In order to provide further support to this statement, we measured the transition temperature as a func-tion of the temperature rate. For those transifunc-tions in which thermal fluctuation cannot be neglected, it is expected that the transition temperature decreases on increasing the tem-perature rate. In contrast, no dependence is expected for athermal transitions. In Fig. 4 we present the average
transi-tion temperature Tt for forward and reverse magnetostruc-tural transitions as a function of the temperature rate. Each data point in the figure corresponds to an average over 10 cycles for each driving rate. Due to the weakness of the detected AE, determination of the transition temperature is not straightforward and we have estimated it as a weighted average of T with the reduced counting rate r as the weight-ing factor, Tt=
冕
Ti Tf Tr共T兲dT冕
Ti Tf r共T兲dT . 共3兲As shown in Fig. 4, a clear decrease of the transition tem-perature for a monoclinic to orthorhombic transition is ob-served while the orthorhombic to monoclinic transition shows no significant dependence. The fact that thermal fluc-tuations are more relevant for the forward transition than for the reverse one is also consistent with the results presented in Fig. 2. Athermal transitions are expected to be much more reproducible than those which are affected by thermal fluc-tuations.
Our results are consistent with the finding of thermally activated effects observed in the paramagnetic to ferromag-netic field-induced transition in Gd5Si2Ge2.36In this case the
application of a magnetic field induces a sudden increase in magnetization followed by a smooth thermally activated relaxation towards a saturation value. Since our experiments indicate a more athermal character on heating, we suggest that the relaxation process observed after a demag-netizing process 共ferromagnetic-monoclinic→paramagnetic-orthorhombic兲 should be slower than that observed when the magnetic field increases.
IV. CONCLUSION
We have demonstrated the existence of acoustic emission across the magnetostructural transition in Gd5Si2Ge2. The
burstlike character of the recorded AE reflects the jerky char-acter of the transition. This evidences the fact that the mag-netostructural transition in giant magnetocaloric materials proceeds by avalanches between metastable states. More-over, there is no characteristic scale for the size of these avalanches. The experimental results also show that thermal fluctuations do not play a relevant role共athermal character兲 for the orthorhombic→monoclinic transition.
ACKNOWLEDGMENTS
This work has received financial support from CICyT 共Spain兲, Projects No. MAT2004-1291 and No. MAT2003-01124 and DURSI共Catalonia兲, Project No. 2005SGR00969.
FIG. 4.共Color online兲 Average values of the transition tempera-tures according to Eq.共3兲 for cooling and heating runs as a function of T˙. Data corresponding to cooling and heating runs are indicated by different symbols according to the legend. Continuous lines are linear fits to the data.
*Electronic address: [email protected]
1A. Planes, L. Mañosa, and A. Saxena, Interplay of Magnetism and Structure in Functional Materials edited by A. Planes, L.
Mañosa, and A. Saxena, Materials Science Series Vol. 79 共Springer-Verlag, Berlin, 2005兲.
2K. A. Gschneidner, Jr., V. K. Pecharsky, and A. O. Tsokol, Rep.
Prog. Phys. 68, 1479共2005兲.
3O. Tegus, E. Brück, L. Zhang, K. H. J. Buschow, and F. R. de
Boer, Physica B 319, 174共2002兲.
4V. K. Pecharsky and K. A. Gschneidner Jr., Phys. Rev. Lett. 78,
4494共1997兲.
5V. Provenzano, A. J. Shapiro, and R. D. Schull, Nature 429, 853
共2004兲.
6W. Choe, V. K. Pecharsky, A. O. Pecharsky, K. A. Gschneidner,
Jr., V. G. Young, Jr., and G. J. Miller, Phys. Rev. Lett. 84, 4617 共2000兲.
7L. Morellon, P. A. Algarabel, M. R. Ibarra, J. Blasco, B.
García-Landa, Z. Arnold, and F. Albertini, Phys. Rev. B 58, R14721 共1998兲.
8Y. Mudryk, Y. Lee, T. Vogt, K. A. Gschneidner, Jr., and V. K.
Pecharsky, Phys. Rev. B 71, 174104共2005兲.
9L. Morellon, Z. Arnold, P. A. Algarabel, C. Magen, M. R. Ibarra,
and Y. Skorokhod, J. Phys.: Condens. Matter 16, 1623共2004兲.
10F. Casanova, A. Labarta, X. Batlle, J. Marcos, L. Mañosa, A.
Planes, and S. de Brion, Phys. Rev. B 69, 104416共2004兲.
11L. Morellon, J. Blasco, P. A. Algarabel, and M. R. Ibarra, Phys.
Rev. B 62, 1022共2000兲.
12L. Mañosa, A. Planes, D. Rouby, M. Morin, P. Fleischman, and J.
L. Macqueron, Appl. Phys. Lett. 54, 2574共1989兲.
13Z. Yu and P. C. Clapp, J. Appl. Phys. 62, 2212共1987兲.
14E. Vives, J. Ortín, L. Mañosa, I. Ràfols, R. Pérez-Magrané, and
A. Planes, Phys. Rev. Lett. 72, 1694共1994兲.
15F. J. Pérez-Reche, E. Vives, L. Mañosa, and A. Planes, Phys. Rev.
Lett. 87, 195701共2001兲.
16L. Mañosa, A. Planes, D. Rouby, and J. L. Macqueron, Acta
Metall. Mater. 38, 1635共1990兲.
17J. S. Meyers, S. Chumbley, F. Laabs, and A. O. Pecharsky, Acta
Mater. 51, 61共2003兲.
18V. Pecharsky and K. A. Gschneidner, Jr., J. Alloys Compd. 260,
98共1997兲.
19E. M. Levin, V. K. Pecharsky, and K. A. Gschneidner, Jr., Phys.
Rev. B 63, 174110共2001兲.
20L. Mañosa, A. Planes, and E. Cesari, J. Phys. D 22, 977共1989兲. 21F. J. Pérez-Reche, M. Stipcich, E. Vives, L. Mañosa, A. Planes,
and M. Morin, Phys. Rev. B 69, 064101共2004兲.
22M. L. Goldstein, S. A. Morris, and G. G. Yen, Eur. Phys. J. B 41,
255共2004兲.
23G. Guénin and P. F. Gobin, J. Phys.共Paris兲 43, C4 共1982兲. 24G. Samolyuk and V. Antropov, J. Appl. Phys. 97, 10A310共2005兲. 25V. K. Pecharsky, K. A. Gschneidner, Jr., G. D. Samolyuk, V. P.
Antropov, A. O. Pecharsky, and K. A. Gschneidner, Jr., J. Solid State Chem. 171, 57共2003兲.
26V. K. Pecharsky, A. P. Holm, K. A. Gschneidner, Jr., and R. Rink,
Phys. Rev. Lett. 91, 197204共2003兲.
27E. M. Levin, A. O. Pecharsky, V. K. Pecharsky, and K. A.
Gschneidner, Jr., Phys. Rev. B 63, 064426共2001兲.
28J. B. Sousa, M. E. Braga, F. C. Correia, F. Carpinteiro, L.
Morel-lon, P. A. Algarabel, and M. R. Ibarra, Phys. Rev. B 67, 134416 共2003兲.
29J. B. Sousa, M. E. Braga, F. C. Correira, F. Carpinteiro, L.
Mo-rellon, P. A. Algarabel, and M. R. Ibarra, J. Appl. Phys. 91, 4457共2002兲.
30F. Casanova, A. Labarta, X. Batlle, F. J. Pérez-Reche, E. Vives, L.
Mañosa, and A. Planes, Appl. Phys. Lett. 86, 262504共2005兲.
31G. Durin and S. Zapperi, in The Science of Hysteresis, edited by
I. Mayergoyz and G. Bertotti共Academic Press, 2006兲.
32V. Hardy, S. Majumdar, M. R. Lees, D. McK. Paul, C. Yaicle, and
M. Hervieu, Phys. Rev. B 70, 104423共2004兲.
33F. J. Pérez-Reche, B. Tadić, L. Mañosa, A. Planes, and E. Vives,
Phys. Rev. Lett. 93, 195701共2004兲.
34E. Altshuler and T. H. Johansen, Rev. Mod. Phys. 76, 471共2004兲,
and refs. therein.
35M. P. Lilly, P. T. Finley, and R. B. Hallock, Phys. Rev. Lett. 71,
4186共1993兲.
36J. Leib, J. E. Snyder, T. A. Lograsso, D. Schlagel, and D. C. Jiles,