Audio-Visual VQ Shot Clustering for Video
Programs
Sergio Benini1, Li-Qun Xu2, and Riccardo Leonardi1 1 Universit`a di Brescia, DEA, via Branze 38, 25123, Brescia, Italy,
{sergio.benini,riccardo.leonardi}@ing.unibs.it, +39 030 3715450-434
2 BT Research and Venturing, Visual Information Processing, Adastral Park, Ipswich
IP5 3RE, UK, [email protected], +44 1473 648608
Abstract. Many post-production video documents such as movies, sit-coms and cartoons present well structured story-lines organized in sep-arated audio-visual scenes. Accurate grouping of shots into these logical video segments could lead to semantic indexing of scenes and events for interactive multimedia retrieval. In this paper we introduce a novel shot-based analysis approach which aims to cluster together shots with similar audio-visual content. We demonstrate how the use of codebooks of au-dio and visual codewords (generated by a vector quantization process) results to be an effective method to represent clusters containing shots with similar long-term consistency of chromatic compositions and audio. The output clusters obtained by a simple single-link clustering algorithm, allow the further application of the well-known scene transition graph framework for scene change detection and shot-pattern investigation. In the end the merging of audio and visual results leads to a hierarchical description of the whole video document, useful for multimedia retrieval and summarization purposes.
1
Introduction
With the advances in multimedia techniques and the convergence of network technologies, we are experiencing a rapid increase in the amount of data coming from heterogeneous digital media sources. Performing a manual search for a piece of desired content from huge amounts of unorganized media data is a time consuming and laborious task for a human user, so algorithms and tools that enable automated analysis of large digital multimedia database are becoming more and more indispensable; still achieving semantic understanding, especially of images and videos, remains a not trivial task. This issue is known in literature as the semantic gap problem [2]: the retrieval queries are normally formulated at a higher level in line with the human concept of understanding the media content. In contrast, the analysis of a video is feasible at the algorithmic level in terms of analyzing low-level features. The problem of bridging the gap between such cognitive level queries and a suitable system-level feature set and related methods remains a difficult research challenge [7].
Considering video content analysis, the detection of shot boundaries (which identify segments filmed in a single camera take, [5]) is still considered a prior
step towards content-based indexing, browsing and summarization. Most of the existing video summarization techniques use key-frames extracted from such shots by means of their associated low-level audiovisual features [6]. A collection of such information provides a compact representation of a given video sequence, useful for video applications such as browsing, database retrieval and automatic generation of summaries and skims (dynamic summaries) [9]. Still considering that there are usually more than one thousand key-frames for an hour long video, it is impractical to check all these images to get a rough idea of its content. Therefore it is clear that the research on video-segmentation must be carried out at a higher level of abstraction with respect to a shot-based decomposition: efforts has to be directed towards grouping shots together into ”scenes”, normally defined as a sequence of shots that share a common semantic thread.
1.1 Related Works
Some methods dealing with automatic high-level movie segmentation are re-ported in literature. In [20], [21], [22] and [23] some approaches based on a time-constrained clustering are presented. In [20] interesting results are given, measuring visual similarity between shots by means of color or pixel correlation between key frames, followed by applying predefined memory models for recog-nizing patterns inside the story. However, in this case the choice of a predefined interval (in frames) places an artificial limit on the duration of an episode. An-other approach can be found in [6] where the Logical Story Units (LSU) are introduced as ”a series of temporally contiguous shots, characterized by
over-lapping links that connect shots with similar visual content element” [7] and
the dissimilarity between shots is examined by estimating correlations between k-frames block matching. One last group of algorithms derives a method for measuring probable scene boundaries by calculating a short term memory-based model of shot-to-shot ”coherence”, as in [8] and [17].
Over the last few years more and more research efforts have been seen in using audio [10] and mixing audio-visual information to detect scene boundaries (see [14], [16], [3] and [15]). However, how to combine audio and visual informa-tion efficiently remains a difficult issue, since there are seemingly many different relationships due to the video genre variety and styles of program making. In [16] the authors have used a finite memory model to segment the audio and video data into scenes, respectively, and then applied sliding windows to merge audio and video scene results. In [3] an audio assisted scene segmentation technique was proposed that uses audio information to remove false boundaries generated from visual scene segmentation. Other authors [15] focused first on object track-ing method for visual segmentation, then analyzed audio features based on the detected video shots, without concerning what the content of the audio data actually is.
1.2 Aim of the Work and Paper Organization
This work presents a novel and effective method to group shots into logical
story units (LSU) starting from an MPEG-1 video stream, using a shot-to-shot
dissimilarity measure based on vector quantization (VQ) codebooks of visual and audio codewords. We demonstrate how these codebooks can be also ex-tended to effectively represent clusters of shots, so evaluating cluster-to-shot and cluster-to-cluster dissimilarity. This clustering of basic video segments into compact structures can be helpful for further processing and content analysis purposes. In fact, starting from the so obtained clustered shots and by analyz-ing the transitions between clusters usanalyz-ing already proposed methods such as the
scene transition graphs [20], it is possible to find out the fundamental elements
of the semantic structure (LSU), the story line developing, and eventually rec-ognize patterns (such as dialogue, audio hints, etc.) and repeats (visually similar shots or events not local in time) all along the video. In this work we deal with a wide range of highly-structured programs, such as feature movies, sitcoms and cartoons, for which is quite reasonable to assume the presence of repetitive or at least similar shot structures along the video sequence.
The paper is organized as follows. In the next section an overview of the pro-posed system is given. Section 3 discusses visual information processing modules for shot-based visual scene detection, including the use of Vector Quantization codebook for visual content representation of a shot, an effective clustering ap-proach [13] for grouping together visually similar shots, and the use of the Scene
Transition Graph (STG) framework to detect logical story units. In Section 5
an audio signal processing approach to audio scene detection is presented. In section 5 the idea is described how audio results can assist video semantic anal-ysis. Finally, in Sections 6 and 7 the experimental results and conclusions are presented, respectively.
2
System Overview
The proposed system, shown in Figure 1, comprises two separate and paral-lel sub-systems, one for visual content clustering process and the other one for audio clustering. After the video decomposition into shots, video content is rep-resented by means of Vector Quantization (VQ) methods. This means that a visual codebook is built starting from the LUV color information of one or more selected key frames. In the case of audio instead, data being considered to build the codebook are normalized Mel-frequency Cepstrum Coefficients (MFCC) ex-tracted from the audio track.
The outputs from the two parallel processes then enter the ’Scene Change’ block, in which a further analysis on clusters is performed in order to construct the Scene Transition Graph (STG) [20], so as to enable logical story unit detec-tion as well as certain events patterns inside scenes. In the end, the audio and visual results are combined together in order to produce an MPEG-7 compliant
Visual Shots segmentation STG graphs LSU Detection High-level AV Content Description Audio Events Sh-Term Analysis Shots audio VQ VQ audio Clustering MFCCs Audio VQ Audio clusters Shots visual VQ VQ visual Clustering K-frame selection Visual VQ K frames Visual clusters Audio MPEG1 Video Stream
Fig. 1. System architecture
3
Visual Content Representation
Assuming that the shot decomposition is already given, we propose to use a VQ codebook distance metric to evaluate shot-to-shot dissimilarity. Later we demon-strate how a codebook of visual codewords can effectively represent also clusters of shots and allow evaluating cluster-to-shot and cluster-to-cluster dissimilarity. To represent the visual content of each shot, the central key frame is chosen, but the procedure has been designed to be functionally scalable in order to be easily adapted to the case when more than one key-frame per shot is needed to gain a proper representation of the visual-content. In this case, techniques for k-frame extraction relying on camera motion activities estimation or the method proposed in [7] can be used.
3.1 Vector Quantization Codebook Generation
The selected keyframe is decoded as a still 352x288 image and represented in the
LUV color space (CIF resolution). After sub-sampling by a factor 2 the keyframe
in both directions (QCIF resolution) and after having applied a denoising gaus-sian filter, it is subdivided into blocks of 4x4 pixel dimension, in order to exploit color correlation of neighboring pixels. For each pixel belonging to each block, the three LUV components are concatenated to form a 48-dimensional vector
pi(3 components for 16 pixels). These vectors now constitute the inputs for the
VQ codebook generation process [4] as shown in Figure 2. The procedure starts
with a randomly generated codebook, then a variant [4] of the Generalized Lloyd
Algorithm is applied; on the basis of the last obtained nearest neighbor partition,
the centroids of each region can be refined iteratively until the distortion is below a predefined threshold. In the end the final code vectors (i.e. the centroids) will
correspond to the statistical density of the color features representing the visual content of the video shot.
352x288 sampling 176x144
START
STOP
LUVLUVLUV…
.
.
.
.
.
.
.
.
.
.
.
.
.
.
.
.
.
.
.
.
.
.
.
.
.
.
.
.
.
.
.
.
No. of vectors 1584(blocks 4x4) Hypercube (48 dimension) VQ 4x4 pixel LUV each: 48 dimensionFig. 2. Training set vector generation
The codebook thus generated for each visual shot contains:
– The cj (j = 1, 2, . . . , C) codewords of D dimension (D = 48) which
repre-sent the centroids of each cluster in the final codebook. Removing the j for notational convenience, we have:
(µ1, . . . , µD)c=
PMc
i=1(pi1, . . . , piD)c
Mc
where Mc are the number of blocks within the partition of the codeword c;
– The variances of the codewords obtained as: (σ2
1, . . . , σD2)c=
PMc
i=1[(µ1− pi1)2, . . . , (µD− piD)2]c
Mc
– The normalized weights (0 < w ≤ 1) of the codewords which estimate the probability mass associated to each cluster:
wc= PCMc c=1Mc
3.2 VQ Codebook Distance Metric
Once the codebook for each shot is obtained, the distance between two shots A and B can be computed in two steps according to the ground measure proposed
in [1]. First, each codebook vector of shot A, yA = {y1, . . . , yC}, is compared
with those of shot B, zB= {z1, . . . , zC}, to produce a
di,j= 1 D[ D X h=1 1 2(µih− µjh) 2+1 2(σih− σjh) 2]
with i, j = 1, . . . , C. Then, the VQ codebook distance metric between shots A and B is defined as:
V Q Dist(A, B) = C X i=1 w · min j (di,j)
where the weight w is determined as w = max(wi, wj).
3.3 Time-unconstrained Clustering Procedure
This section details the novel visual clustering process, essential for further LSU segmentation, which relies on the possibility of defining VQ codebooks even for clusters. A time-unconstrained analysis approach is useful for many video programs like movies, since it groups shots into the same cluster based only on the visual contents without considering the timing of the context. The objective of such an approach is twofold. First, it doesn’t set an a priori time limit for a scene extent (which is an issue, e.g., in [20]) and secondly, it can be useful for certain retrieval purposes, like user defined queries searching for repeats (for example a viewer may like to see all the scenes set in the travel bookshop location in the movie ”Notting Hill”).
At the beginning each cluster contains a single shot, so forming the Original
Shot Graph (OSG), in which nodes correspond to single shots, and edges
indi-cate the transitions between shots. The VQ codebook distance metrics are then computed between all shots along the timeline, so as to explore exhaustively the visual similarities of the entire video, as shown in Figure 3. At each step, the
… d01 d02 d0n d12 d1n d2n
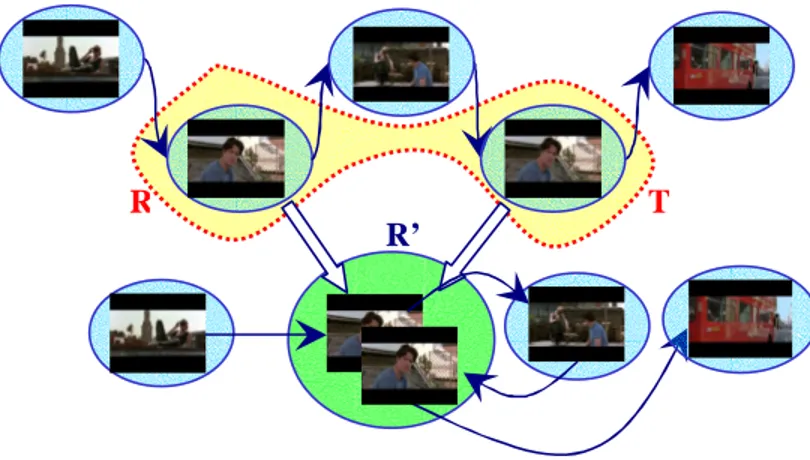
algorithm merges a reference cluster R with its visually most similar test cluster
T (i.e. the one having the minimal VQ distance metric), to form a new cluster R0
in the temporal position of R. All the shots belonging to R and T , respectively,
R
T
R’
Fig. 4. Visual clustering: merge operation
then become the shots of the new cluster R0, and all transitions from/to R and
T are properly updated to keep the correct temporal flow of the story. Figure
4 shows an example of such a merge operation. For the now combined cluster
R0 a new VQ codebook is needed to represent its content. The same process
used before is applied: considering that the new cluster contains more than one shot, the keyframes corresponding to all the shots will be used for the codebook generation. Then, the VQ distances between R0 and all the other clusters are
updated ready for the next iteration.
On-line Statistical Analysis on VQ-cluster Distortion: It should be noted that while the VQ codebook generated at the OSG step is specific for each shot, the VQ codebook, which represents the visual content of a cluster with multiple shots, usually becomes less specific. This means that, for each shot, the best representing VQ codebook is the one prior to the first merging. From then on, the distortion of representing the original shot with its cluster VQ codebook is likely to increase. So, at each iteration k the newly formed cluster R0
k introduces
a VQ distortion with respect to the OSG step, where each cluster contains only a single shot. This distortion can be computed, using the proposed VQ distance, as the sum of the distances between the codebook of the newly formed clusters R0
k
distortion V Q Err introduced from the beginning of the process until step k is: V Q Err(k) = k X j=1 X si∈R0j V Q Dist(si, R0j)
With the increase in a cluster’s size, its VQ codebook is at the risk of losing the specificity in representing any of its constituent shots. To prevent this de-generative process, a statistical analysis is performed on the distortion generated by the latest merging step. At each iteration k, we compute the first derivative of the VQ distortion as,
∆V Q Err(k) = [V Q Err(k) − V Q Err(k − 1)]
together with its mean µ and standard deviation σ with respect to the previous steps. Specifically, observing that after some initial steps (in which very simi-lar shots collapse in the same clusters) the ∆V Q Err tends to be gaussianly distributed, if:
∆V Q Err(k) > µ{∆V Q Err(j)} + thrs · σ{∆V Q Err(j)}
with j = 1, 2, . . . , k − 1, and thrs ∈ [2, . . . , 3], this means that the distortion introduced by the newly formed cluster is too large and that the VQ codebook fails to represent all the cluster components. In such a case, this latest merging between cluster R and T is discarded. Besides, these clusters are since locked, being excluded from any future clustering process and a new reference and test cluster, currently unlocked, are selected according to the next minimal value of VQ distance metric. The above iteration process is repeated until no more unlocked clusters are available for merging. Experimental trials demonstrated that in order to prevent a cluster codebook from growing too much and losing specificity, it is useful to lock the cluster at a certain size (e.g., 12-15 shots in practice).
The discussion so far on the clustering process assumes the presence of simi-lar shot structures along the sequence. This structure can be partially lost when the director relies on fast succession of shots to highlight suspense or to merely develop the plot of the movie. However, also in this case, the clustering algorithm gives proof of good performance, since usually shots belonging to the same LSU share at least the chromatic composition of the physical scene or the environ-mental lighting condition.
Intra-cluster Time Analysis The clusters generated from the unconstrained time analysis provide the first level representation of video content hierarchy. Each cluster now contains shots with high visual similarity to each other even if they may not be temporally adjacent, which, as discussed before, is already desirable for certain retrieval purposes. However, in order to separate one LSU from another, it is necessary that further analysis looks into the temporal locality of shots within each cluster so as to introduce a second level representation in
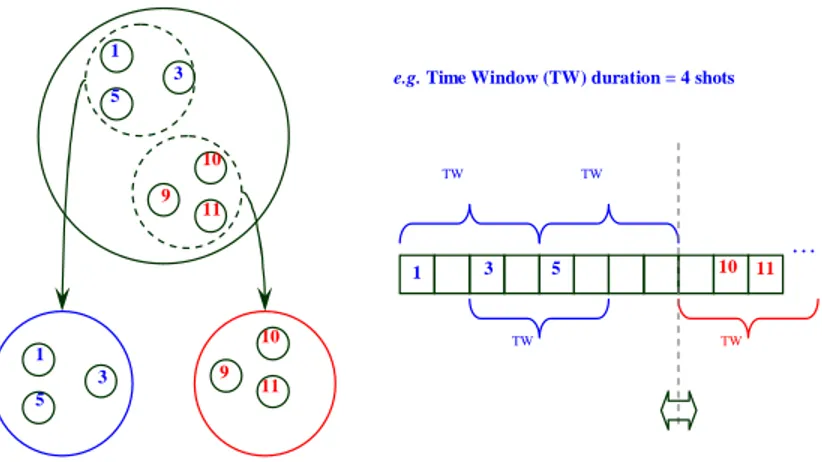
the cluster hierarchy. To do this, a temporal analysis is performed with a view to splitting each cluster into a few temporally consistent sub-clusters (see Figure 5) according to the following criterion: inside each cluster, two subsequent shots are considered to belong to the same sub-cluster if the temporal distance between them is less than a predefined interval DW (in terms of number of shots).
The length of DW = 8 shots chosen for our tests is not a critical value: it only
determines the maximally explored range for a shot with similar visual content (e.g., in a pattern like ABCDEFGA..., it allows the two shots A to be included in the same sub-cluster), whereas similar shots usually occur quite closely to each other.
e.g. Time Window (TW) duration = 4 shots
… TW TW TW TW 1 3 5 10 11 9 10 11 9 1 3 5 1 3 5 10 11
Fig. 5. Second level cluster hierarchy: time local sub-clusters
3.4 Scene Transition Graph
The Scene Transition Graph (STG), originally proposed in [24], can be used to find the edges of LSUs and extracting the story structure without a priori knowledge of the semantics and flow of the video. It can be easily noted that the output of clusters and transitions from the above analysis forms a directed graph: it comprises a number of nodes (the local sub-clusters), each containing a number of visually similar and temporally close shots, and the edge between nodes (the time transitions between shots), representing the time evolution of the story. An important type of transition between two nodes is called
”cut-edge” when, if removed, the graph leads to two disconnected sub-graphs. An LSU boundary is therefore defined to be at a cut edge.
As shown in Figure 6 each connected sub-graph after the removal of cut-edges represents a Logical Story Unit while the collection of all cut-edges represent all the transitions from one LSU to the next, thus reflecting the natural evolution of the video flow.
Cut-edge
Cut-edge
Fig. 6. LSU detection through cut-edges
4
Audio Signal Processing
Current approaches to audiovisual data segmentation focus more on visual cues than on associated audio cues. There is, however, a significant amount of infor-mation contained in audio, which sometimes can be complementary to the visual counterpart. In the current work we consider audio data as a support to visual processing results. It should be noted that the processing is not for classification purposes (i.e. decide whether it is music, speech, silence, noise, etc.), but for catching only variations of audio characteristics that may correspond to either an ”audio scene change” or an important event in the story evolution that is underlined by a significant modification in audio properties.
4.1 Audio Content Representation
We first divide the audio data on the basis of the visual shot-based segmenta-tion. Due to editing effects in a media file, some of the detected camera shots may be very short. In order to analyze a significant amount of audio information (i.e. avoiding short silent shots), if an audio shot lasts less than certain dura-tion (e.g., 2 s) it is merged with its preceding shot prior to being processed. A short-term spectral analysis is then performed to generate feature vectors char-acterizing each audio shot. First, the audio-shot is divided into audio frames locally stationary and lasting for a few tens of milliseconds. Then, for each audio frame, 19 Mel-Frequency Cepstral Coefficients (MFCCs) plus a sound energy are computed. The MFCCs are widely used in speech recognition applications and are also useful for modeling music [11]. In our work the audio data is sampled at
22.050 kHz; frames are 20 ms long weighted by a Hamming window with 50% overlapping, so that an output feature vector is obtained every 10 ms.
Vector Quantization of Audio Shots After weighting the MFCCs according to the relative energy of its audio frame (to remove the detrimental effects of silence), all the normalized MFCC vectors enter the same VQ codebook gener-ation process as it was described in the case of visual informgener-ation.
Measuring Distance Between Audio Shots Once the codebook for each audio shot is obtained, the distance between two different audio shots can be computed using the Earth Mover’s Distance (EMD). The EMD was used in [12] as a metric for image retrieval and in [11] to compare songs in an audio database for automatic creation of play-lists. The EMD can be viewed as calculating the minimum amount of work required to transform the codebook of one audio shot into another, using a symmetrical form of the Kullbach-Leibler’s distance. The problem can be formulated as a linear programming task for which efficient solutions exist.
4.2 Segmentation Procedure for Audio Scene
In general, an audio scene change is likely to occur when the majority of the dominant audio features in the sound change [16]. This can typically happen just before (or after) a new visual scene begins, or to underline important events taking place even inside a logical story unit.
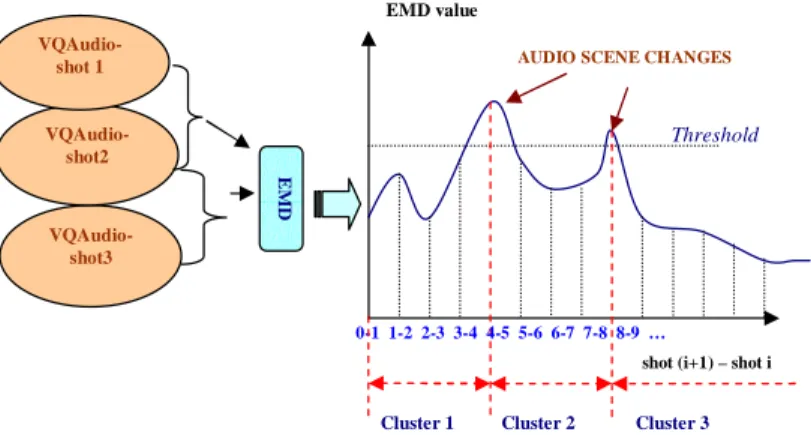
Computing the EMD metric between codebooks of all consecutive audio shots, in general we can say that if the EMD is large, then the two shots are quite different in their underlying properties according to the defined set of low-level features. On the contrary, if the EMD value is small, the audio doesn’t change appreciably between the two adjacent shots. An experimentally defined threshold is then used to detect peaks in the distance curve, so as to partition the audio shots into distinct audio clusters, as shown in Figure 7.
5
Audio Assisted Segmentation
This section deals with how audio and visual results deriving from previous analysis are combined to achieve a final description of the video structure. Ba-sically, our shot-based approach avoids many of the alignment problems that affect many proposed solutions in the literature for joint audio-visual analysis and provides a simple method for synchronizing the results.
5.1 Scenarios for Audio-video Scene Combination
In the following we identify three possible audio-visual boundary conditions and the corresponding audio-visual events:
VQAudio-shot3 VQAudio-shot2 VQAudio-shot 1 Threshold
shot (i+1) – shot i
EMD value
0-1 1-2 2-3 3-4 4-5 5-6 6-7 7-8 8-9 …
AUDIO SCENE CHANGES
Cluster 1 Cluster 2 Cluster 3
E
M
D
Fig. 7. Audio clustering based on EMD
– If a Visual Change (VC) happens (corresponding to a ”cut edge”) but no Audio Change (AC) occurs =¿ we set a simple Logical Story Unit boundary as shown in Figure 8.
– If an Audio Change (AC) happens but no Visual Change (VC) occurs =¿ we set an Audio pattern hint inside the LSU (as in Figure 9) often used by authors to underline a change in the mood or an important moment in the story evolution.
– If an Audio Change (AC) coincides with a Visual Change (VC) =¿ we set an Audio-visual scene change (Figure 10). Of course all audio-visual scene changes are also LSU boundaries, but the reverse is not true.
5.2 Pattern Investigation Inside Story Units
Using the scene transition graph framework exploited before, it is possible to further investigate the different patterns of actions inside the detected scenes, adding more semantic understanding and structural organization to the story. Searching for patterns allows distinguishing between three main types of actions: dialogues, progressive actions, hybrid [17] and generic actions, as shown in Figure 11. A dialogue is usually characterized by a simple repetitive visual structure like
ABAB (or ABCABC in the case of three characters). A progressive action shows
a linear evolution and it is characterized by a pattern like ABCDE. A hybrid action contains a dialogue sequence embedded in a progressive having a pattern such as ABCDCDE. Looking at the type of action which is dominant inside each scene, it is possible to classify them as a dialogue, a progressive action or a hybrid one. All scenes not recognized as making part of the above categories are classified as generic.
With the classification into ”audio-visual scene changes”, ”LSU boundaries”,
”audio hints” and the investigation of action patterns, a hierarchical organization
This is finally described in a XML file compliant with MPEG-7 hierarchical segment decomposition, which is useful for developing effective browsing tools for navigation or summarization of the video document.
6
Experimental Results
Preliminary experiments on a prototype system have been carried out using video segments from two feature movies, namely, a 40 minute excerpt from the light comedy ”Notting Hill” and a 17 minute one from ”A Beautiful Mind”. The codebook dimension chosen for the visual VQ has been set to 100, while for the audio the dimension 20 has been chosen, due to its lower dimensional space.
Video Program #Shots #Frames #Clusters #Subclusters
Notting Hill 521 59990 105 172
A Beautiful Mind 203 24818 19 33 Table 1. Trial Video Programs
6.1 Results and Observations
Although some LSU segmentation methods have been seen in literature, a com-mon predefined ground-truth data set for comparison is still missing and the definition of LSU is sometimes difficult to be applied by individual movie view-ers. Even if some work has been done in this direction [18], a systematic method for the evaluation of LSU segmentation is far from being accomplished. In Table 1 some details on the trial movies are given, together with the total number of clusters and sub-clusters, obtained as output of the clustering operation. More-over in Table 2 and Table 3 we present some results in terms of the correctly detected scene changes and presence of false alarms with respect to a manually obtained scene segmentation. It should be noted that high values in false alarms (i.e. over-segmentation) are mainly due to the frequent adoption of
”establish-ing” shots at the beginning of new scenes; this effect can be reduced by analyzing
all LSUs formed by a single shot and merging their content with the subsequent
LSU.
To better evaluate this work we resort to reference [18], which proposes some measures on the effectiveness of segmentation results that are more meaningful and reliable than the counts of correct detections and false alarms. In particular, measures of Coverage C and Overflow O on LSUs are computed; Coverage C is the fraction of shots of automatically generated LSU λj that overlap the most
with the ground-truth LSU Λt, i.e.:
C(Λt) = maxj=0,...,n#(λj)
Type of Scene Change Ground Truth Correctly Detected False Alarms
LSU boundaries 15 11 7
AV Scene Changes 7 4 2
Audio Hints in LSU 14 10 5
Table 2. Experimental results for ”Notting Hill”
Type of Scene Change Ground Truth Correctly Detected False Alarms
LSU boundaries 3 3 4
AV Scene Changes 5 5 0
Audio Hints in LSU 2 2 2
Table 3. Experimental results for ”A Beautiful Mind”
while Overlap O measures the overlap of automatically generated LSUs λj
cov-ering Λt, with the ground-truth LSUs Λt−1 and Λt+1:
O(Λt) =
Pn
j=0#(λj\ Λt) · min(1, #(λj∩ Λt))
#(Λt−1) + #(Λt+1)
These two measurements, aggregated over the entire tested video sequence as suggested in [18], are presented in Table 4, where very low values of Overflow O and the high scores in terms of Coverage C reveal the good performance of the proposed algorithm in segmenting LSUs.
Video Program #LSUs Λt (GT) #LSUs λjCoverage C Overflow O
Notting Hill 23 45 78.9% 3.9%
A Beautiful Mind 9 13 91.1% 0.0% Table 4. Detected LSUs in terms of Coverage and Overflow
7
Conclusion
We have presented in this work a novel audiovisual analysis framework for logical
story unit detection based on audio-visual VQ shot clustering and the progress
reached so far for fulfilling such an objective. Extensive experiments on two feature movies have demonstrated the promising results of this approach. In fact, the current prototype system is able to recognize logical story units and to organize video content in a hierarchical structure, highlighting events, detecting special pattern along the sequence, whilst generating an MPEG-7 compliant
References
1. Adami N., Leonardi R., Wang Y., ”Evaluation of different descriptors for identify-ing similar video shots,” Proc. of IEEE ICME’2001, Tokyo.
2. Adams B., ”Where does computational media aesthetics fit?” IEEE Multimedia, pp. 18-26, April-June 2003.
3. Chao Y., Tavanapon W., Kim K., and Oh J., ”Audio-assisted scene segmentation for story browsing,” Proc. of CIVR’03, pp. 446-455, Urbana-Champaign, IL, USA, July 2003.
4. Gersho A., Gray R.M., Vector Quantization and Signal Compression, Kluwer Aca-demic Pubishers, January 1992.
5. Gomes J.G.R.C., Carli M., Mitra S.K., Neri A., ”Vector Quantization-Based Au-tomatic Shot Boundary Detection,” Proc. IEEE MMSP’02, pp. 216-219, 2002. 6. Hanjalic A., Lagendijk R.L., ”Automated high-level movie segmentation for
ad-vanced video retrieval systems,” IEEE Trans. on C.S.V.T., Vol.9, No. 4, June 1999.
7. Hanjalic A., ”Visual-Content Analysis for Multimedia Retrieval Systems”, PhD Thesis TU Delft, 1999.
8. Kender J.R.,Yeo B.-L., ”Video scene segmentation via continuous video coher-ence”, CVPR’98, pp 367-373.
9. Lee S.H.,Yeh C.H.,Kuo C.C.J., ”Automatic movie skimming system with story units via general tempo analysis,” Proc. of SPIE, Vol. 5307, pp. 396-407, 2004. 10. Liu Z.,Wang Y.,Chen T., ”Audio feature extraction and analysis for scene
seg-mentation and classification,” Vol. 20, No. 1, Journal of VLSI Signal Processing Systems for Signal, Image, and Video Technology.
11. Logan B.,A. Salomon, ”A content-based music similarity function”, Compaq Tech-nical Report, June 2001.
12. Rubner Y.,Tomasi C.,Guibas L., ”The Earth Mover’s Distance as a metric for im-age retrieval,” Technical Report STAN-CS-TN-98-86, Computer Science Depart-ment, Stanford University, Sept 1998.
13. Saraceno C., Leonardi R.: ”Identification of Story Units in Audio-Visual Sequences by Joint Audio and Video Processing”, in Proc. IEEE Intern. Conf. on Image Processing 1998, Chicago, IL, U.S.A., I: 363-367, Oct. 1998.
14. Saraceno C., Leonardi R.: ”Indexing audio-visual databases through a joint audio and video processing”, in Intern. Journal of Imaging Systems and Technology, 9(5):320-331, Oct. 1998.
15. S-C. Chen, M-L. Shyu, W. Liao, C. Zhang, ”Scene Change Detection by Audio and Video Clues,” Proc. of IEEE ICME’2002, pp. 365-368.
16. Sundaram H., Chang S.F., ”Audio Scene Segmentation Using Multiple Features, Models And Time Scales,” Proc. of ICASSP’2000, Istanbul, Turkey, June 2000. 17. Sundaram H., Chang S.F., ”Determining computable scenes in films and their
structures using audio-visual memory models,” Proc. of ACM Multimedia 2000, pp. 95-104.
18. Vendrig J., Worring M., ”Systematic evaluation of logical story unit segmentation,” IEEE Trans. on Multimedia, Vol. 4, No. 4, Dec 2002.
19. Wang Y., Liu Z., Huang, J.-C., ”Multimedia Content Analysis Using Both Audio and Visual Cues,” IEEE Signal Processing Magazine, 2001.
20. Yeung M.M., Yeo B.L., ”Time-constrained clustering for segmentation of video into story units,” Proc. of ICPR’96.
21. Yeung M. , Yeo B-.L., Liu B., ”Segmentation of video by clustering and graph analysis,” Comput. Vis. Image Understand., vol. 71, no. 1, pp 94-109, 1998. 22. R. Lienhart, S. Pfeiffer, and W. Effelsberg, ”Scene determination based on video
and audio features,” in Proc. 6th IEEE Int. Conf. on Multimedia Systems, vol. 1, 1999, pp. 685-690.
23. E. Sahouria and A. Zakhor, ”Content analysis of video using principal compo-nents,” IEEE Trans. Circuits Syst. Video Technol., vol. 9, pp. 1290-1298, Dec. 1999.
24. Yeung M.M., Yeo B.L., Wolf W., Liu B., ”Video Browsing using Clustering and Scene Transitions on Compressed Sequences,” in Multimedia Computing and Net-working, SPIE 2417, pp. 399-413, Feb 1995.