Water2017, 9,x; doi:FOR PEER REVIEW www.mdpi.com/journal/water Article
1
Economic evaluation of hydrological ecosystem
2
services in Mediterranean river basins applied to a
3
case study in southern Italy
4
Marcello Mastrorilli1, Gianfranco Rana1, Giuseppe Verdiani2,*, Giuseppe Tedeschi2, Antonio
5
Fumai3 and Giovanni Russo4
6
1Council for Agricultural Research and Economics, Research Centre for Agriculture and Environment
7
(CREA-AA), Bari, Italy; [email protected]; [email protected]
8
2Basin Authority of Apulia, Bari, Italy; [email protected]; [email protected]
9
3 MANZONI Learning (fire protection), Bari, Italy; [email protected]
10
4 Dept. Disaat, University of Bari, Italy; [email protected]
11
* Correspondence: [email protected]; Tel.: +39 3404619902
12
Academic Editor: name
13
Received: date; Accepted: date; Published: date
14
Abstract: Land use affects the eco-hydrological processes with consequences on floods and
15
droughts. Changes in land use affect ecosystems and hydrological services. The objective of this
16
study is the analysis of hydrological services through the quantification of water resources,
17
pollutant loads, land retention capacity and soil erosion. On the basis of a quantitative evaluation,
18
the economic values of the ecosystem services are estimated. By assigning an economic value to the
19
natural resources and to the hydraulic system, the hydrological services can be computed at the
20
scale of catchment ecosystem. The proposed methodology has been applied to the basin "Bonis"
21
(Calabria Region, Italy). The study analyses four land use scenarios: (i) forest cover with good
22
vegetative status (baseline scenario); (ii) modification of the forest canopy; (iii) variation in forest
23
and cultivated surfaces; (iv) insertion of impermeable areas. The simulations prove that the
24
variations of the state of forest areas has considerable influence on the water balance, and then on
25
the provided economic value. Small economic changes derive from reducing the impermeable
26
areas. Increasing the agricultural area to 50% of the total, and reducing the forest surface, affects
27
soil erosion, reduces the storage capacity of the water, and consequently the water harvesting. The
28
suggested methodology can be considered a suitable tool for land planning.
29
Keywords: water harvesting; water runoff; soil erosion; land use planning; soil water balance
30
1. Introduction
31
The management of land and water resources are closely related [1, 2, 3] since the spatial
32
planning addresses the localization of activities and the land use. The latter one affects water
33
balance, water quality, hydraulic risk and soil loss [4, 3, 5]. Thus, land use and land management
34
practices affect the eco-hydrological processes in combination with other factors such as topography
35
of the basin, hydrological properties of agricultural land and characteristics of rainfalls [3, 6, 7, 8, 9].
36
In particular, land use affects soil erodibility and canopy cover. Both parameters are considered
37
in estimating the values of the universal soil loss relation [10]. The latter one is usually used for
38
estimating the soil amount removed by water runoff [11]. Soil use also influences the main terms of
39
the water balance, i.e. canopy interception, evapotranspiration, infiltration, soil water storage, and
40
surface outflow [12, 13, 14]. Moreover, the above parameters are also related to the characteristics of
41
vegetation (species, crop management, leaf area, root depth, crop height) and soil (organic matter
42
content, hydraulic conductivity, infiltration capacity, apparent density, porosity). An important
43
action on soil properties is carried out by cropping systems and root characteristics [15, 16]. For
44
example, the results of experimental observations show that forest soils are characterized by high
values of hydraulic conductivity and porosity, having positive effect on water infiltration and
46
retention capacity [17, 18, 19].
47
Several studies [20, 21, 22] demonstrate a complex and non-linear relationship between soil use
48
and hydrological cycle. This relationship is more evident in small basins having a catchment area
49
less than 40 km2 [23, 24, 25]. In particular, the hydrological cycle depends on site-specific factors,
50
such as the slope and the distance from the hydrographic grid [26], as well as the changes in the land
51
use.
52
Furthermore, following [27, 28, 29, 6, 30, 22], soil surface sealing and intensive agricultural
53
management have significant negative impacts on the hydrological cycle, as they result in a notable
54
increase in the superficial flow rate and volume, while soil infiltration and water-table recharge are
55
reducing.
56
In a catchment, the forest surfaces, and their conservation and management, modulate the
57
whole water cycle by promoting evapotranspiration, reducing surface runoff, and regulating flood
58
wave [29, 31, 22]. As a consequence, the agro-forestry management contribute to the mitigation of
59
hydraulic risk, if it is planned by taking into account water resources and the hydraulic
60
infrastructures [32, 33, 34]. Furthermore, the "soil-plant" system influences the availability of water
61
resources by: (i) attenuating the kinetic energy of rainfall, (ii) increasing the soil water storage
62
capacity, (iii) reducing the water evaporation and (iv) the deep drainage [35, 36, 37].
63
An important role in regulating the hydrological cycle can therefore be attributed to the
64
ecosystems associated with land use and agro-forest management [38, 39, 40, 41]. The agro-forest
65
ecosystems provide a series of direct and indirect hydrological services: (1) water provisioning
66
(storage in water bodies and water harvesting), (2) flow regulating, (3) water purification [42] and (4)
67
soil protection [43, 44]. The water balance and the soil characteristics are consequently influenced by
68
the species in the agro-forest ecosystems and by the adopted cropping systems. Moreover, the crop
69
and forest management has significant impact on quality and quantity characteristics of surface
70
waters and groundwater.
71
Once the ecosystem service “water providing” is quantified, it is possible to estimate the water
72
resources carrying capacity (i.e. the population able to be supplied in a sustainable way), and
73
designing suitable water harvesting systems.
74
With reference to the surface and groundwater purification issues, vegetation and the microbial
75
soil community act on absorption and biochemical transformation of nutrients and contaminants
76
[45].
77
On the other hand, intensive farming systems, requiring high external inputs (fertilizers or
78
other agro-chemicals), may have negative effects on the quality of water resources which in some
79
cases might become unsuitable for drinking if the agro-chemicals are not adequately supplied and
80
scheduled.
81
From the analysis of the above reported literature it results that a territorial planning is required
82
to optimize the eco-hydrological cycle. Such planning activity should consider at the same time the
83
regulation, purification and provision of water resources [46] since on these services depend the
84
hydraulic security of the territory [47], as well as the water carrying capacity [48] and the
85
sustainability of water purification processes [49]. Nevertheless, with respect to the soil protection
86
service, vegetation affects the plant cover factor (C-factor) used to estimate soil loss [50]. Forests are
87
generally retained to protect soil from erosion more efficiently than cropping systems do. However,
88
recent agronomic studies on conservation agriculture show that the C-factor is influenced by crop
89
residues and soil tillage [51, 52, 53, 54]. Reducing soil tillage, combined with suitable management of
90
the crop residues, can contribute to control the soil erosion [55].
91
A possible approach for a sustainable planning starts from the definition of the physical
92
variables involved in the ecosystem services by mean of indicators which can be quantified by
93
giving an appropriate economic value. The general objective of this study was to quantify, in
94
physical and economic terms, the ecosystem services provided by the territory planning of
95
Mediterranean basins. To achieve this objective, the following issues have been addressed: (i) water
96
resources availability, (ii) rainfall effects on soil surface, (iii) water carrying capacity.
Specific objectives of this study were:
98
to develop the conceptual method for quantifying the technical and economic value of the
99
hydrological services provided by the ecosystems. In particular, four services have been
100
considered: 1) water provisioning; 2) flow regulating; 3) water purification; 4) soil protection;
101
to apply the developed methodology to an emblematic case of a gauged watershed in southern
102
Italy (the Bonis basin in Calabria), mainly covered by Mediterranean forest systems;
103
to analyze possible planning scenarios by using the proposed methodology.
104
105
This methodology is conceived as a tool for identifying and implementing territorial plans at
106
the meso-scale suitable for preventing floods and degradation (in quality and quantity) of water
107
resources.
108
2. Materials and Methods
109
In order to assess the impact of basin ecosystems on hydrological cycle and water quality of a
110
watershed, the proposed methodology is based on the use of both temporal and timeless indicators
111
and it is applied to different scenarios of land use and soil management. Time indicators were
112
evaluated at annual scale in accordance with [56].
113
2.1. Assessment of hydrological ecosystem services
114
2.1.1. Water provisioning (WS)
115
The service "water provisioning" from an eco-systemic point of view is defined as water storage
116
in rivers, lakes and aquifers [57]. This service is correlated to inflows into the water bodies and to the
117
water harvesting systems and infrastructures [58]. To quantify this service, the “water supply”
118
indicator is used. It can be expressed in different ways by combining the following terms: (i) the
119
runoff [59], (ii) the ratio between availability and demand for water resources [60], (iii) the total
120
volume of uptake water [61] for different socio-economic purposes.
121
The approach proposed in this study is based on parameters which are generally available from
122
meteorological and hydrological data-sets. So the water supply (WS in mm yr-1) was estimated
123
following the model developed by [62]:
124
WS = SPTC− ET − EF (1)
125
where SPTC is the precipitation water [mm yr-1], ET is evapotranspiration [mm yr-1] and EF is the
126
water requirement for maintaining the aquatic ecosystems [mm yr-1], which for the Italian territory is
127
30% of the rains [63]. As for ET, the literature annual average values have been considered. They
128
were calculated by using the water balance at the plot scale and then spatialized at the watershed
129
level. The economic value of the “water provisioning” service was assessed in accordance with [49],
130
using the unit average Italian water rate: 0.71 € m-3. This fixed economic value is established by the
131
National Authority for Energy, Gas and the Water System. Alternatively, the water rate can be more
132
accurately estimated, taking into account the relationship between availability and demand [60].
133
2.1.2. Flow regulating (WC)
134
Ecosystems offer the service "flow regulating" through the influence of soil-plant system on
135
hydrological flows [57]. This service is directly related to the volume of water intercepted by
136
vegetation and stored into the soil profile or in the aquifers [64]. These hydrological parameters
137
depend on soil tillage and agro-forest management. For this reason, the “flow regulating” directly
138
affects the processes of rainfall – runoff transformation and, consequently, the hydraulic hazard. For
139
the quantification of flow regulating by “rainfall – runoff” process evaluation, several indicators
140
have been proposed, such as: (i) soil - water storage capacity [65], (ii) soil infiltration capacity [61]
141
and (iii) water conservation efficiency. These indicators refer to the water amount which is stored
142
into the soil profile and withdrawn from the surface runoff [49, 66].
In this study the flow regulating was quantified by the timeless water conservation (WC, in m3)
144
indicator, it takes into account potential water losses due to evapotranspiration and soil - water
145
storage. This indicator has been calculated with reference to rainfall with a return time of 200 years.
146
This time period is usually considered in assessing the territory protection from flood. Therefore, the
147
volume of rainfall accumulated into the soil and removed from the runoff was calculated by
148
subtracting the flowed volume in the different land uses to the rainfall amount, characterized by a
149
return time of 200 years:
150
WC = Volrain− Volrunoff (2)
151
where Volrain [m3] is the 200-year rainfall volume estimated on the basis of climatic possible curves
152
and Volrunoff is the runoff volume through the stream gauging station, estimated through the
153
"rational formula" described in section 2.3 (assessment of surface runoff ).
154
The economic value of the flow regulating service has been calculated with reference to the WC
155
indicator on the basis of the costs for the construction of storm-water retention system with
156
equivalent volume. Analysis of storm-water retention system project shows that the unit cost varies
157
from 5 to 15 € m-3. This value does not take into account the management and maintenance costs. The
158
chosen value has been assumed to be 5.16 € m-3 of detention basin [67] (Autorità di Bacino dei
159
FiumiTrigno, Biferno e Minori, Saccione e Fortore). This evaluation is consistent with that proposed
160
by [68]. So the presence of a forested area is economically equivalent to water retention system that
161
can contain the same water quantity.
162
2.1.3. Water purification (COD)
163
The service "water purification" is defined as the attitude of ecosystems to remove pollutants by
164
means of chemical, physical, micro-biological and mechanical processes [44]. The most used
165
indicators for quantifying this service are the percentage of forest surface and the percentage of
166
riparian forests along the river [68, 69].
167
In this study, for quantifying the "water purification" service, the water quality parameters
168
influenced by land use have been used as indicator. The concentration of pollutants in surface water
169
has been assessed on the basis of the forest surface and other land uses within the same basin [2]. In
170
particular, it is possible to estimate the Chemical Oxygen Demand (COD in mg l-1) parameter, which
171
describes the surface water pollution, on the basis of the following formula:
172
ln(COD) = −0.08C − 5.47F − 2.93G + 0.29W + 0.7B + 1.69 (3)
173
where C is the conventional cultivated area [%], F forest [%], G pasture [%], W water bodies [%] and
174
B the impermeable surfaces [%] calculated respect to total basin surface. The coefficients used in the
175
relation (3) were determined by [2] through data processing related to land use and water quality.
176
By means of the ratio COD/TOC = 3, it is possible to estimate the Total Organic Carbon (TOC in mg
177
l-1) which represents an indirect measure of the organic matter in the waters. This parameter makes it
178
possible to establish the economic suitability of water treatment for drinking use (TOC ≤ 4 mg l-1)
179
and for the next human consumption (TOC ≤ 2 mg l-1) [70].
180
The economic evaluation of the "water purification" service can be carried out based on changes
181
in TOC resulting from changes in soil use. In this paper, the cost of the active carbon needed to
182
reduce the TOC to the most suitable values for drinking use has been calculated. In fact, through the
183
reduction of TOC, it is possible to estimate the amount of powdered activated carbon (PAC in mg l-1)
184
needed for the purification of the water and the relative costs [71]:
185
PAC = TOCreduction
0.063 (4)
186
Analysis of water treatment plant project shows that the unit PAC cost varies from 1.6 (adopted
187
value) to 1.9 € kg-1.
188
2.1.4. Soil protection (βe)
189
The “soil protection” service has been evaluated from the close interrelations between erosion,
190
solid transport and water quality. Actually this ecosystem service is the most complex to define and
191
quantify. The indicator here adopted for quantifying soil protection is the “ecosystem service
192
mitigated impact on soil erosion” (βe in t ha-1 yr-1), it is the basin potentiality, provided by the
193
presence of areas covered with vegetation [72, 73] as:
194
βe= Γ × Cfactor (5)
195
where Cfactor (dimensionless) is vegetation cover factor and is the structural impact [74]. is
196
calculated as:
197
Γ = R × LS × K (6)
198
R is the rainfall erosivity (MJ mm ha−1 h−1 yr−1), LS is the topographic factor (dimensionless), and K is
199
the soil erodibility (t h MJ−1 mm−1).
200
Finally, this service can be quantified, on an annual basis (t ha-1 yr-1), through the difference
201
between water erosion in different types of land use with respect to bare soil conditions. Values of βe
202
[t ha-1 yr-1] allow determining the positive or negative impact of land use on the amount of average
203
annual soil loss per surface unit.
204
The capacity of ecosystems to protect the soil is expressed by means of the parameter es
205
[adimensional], according the definition by [72]:
206
Es = 1 – Cfactor (7)
207
In literature there are different Cfactor values in relation to soil use [12], plant species and
208
agricultural practices [55]. Only soil related values have been used in this work due to the lack of
209
site-specific knowledge on soil tillage, pruning and green (or crop) residues management.
210
By the above definitions, the unit economic value of the soil for replacement varies between 44.6
211
e 255.1 € t-1, including transport and filling costs [75]. A value of 45 € t-1 was assumed in this study
212
and it represents the Italian situation. This value is consistent with the prices for backfilling
213
operations in public works.
214
2.1.5. Assessment of the economic values
215
For the economic evaluation of ecosystem services, it is worth noting that there is no overlaps
216
between the range of asset cost values: water 0.71 € m-3; powdered activated carbon 1.6 ÷ 1.9 € kg-1;
217
storm-water retention system 5 ÷ 15 € m-3; soil replacement 44.6 ÷ 255.1 € t-1(soil and hydraulic
218
works). Furthermore, since all indicators are linearly related to specific costs, the variation of that are
219
linearly reported in the final values of the indicators in object.
220
Other ecosystem services not strictly related to the water cycle have not considered in this
221
study.
222
2.2. Assessment of water carrying capacity
223
The water resources carrying capacity (WRCC in inhabitants) is a key indicator for the study of
224
available water resources and their sustainable management [76]. It allows to compare the
225
availability and the requirement of water resources. The WRCC can be estimated on the basis of
226
socio-economic and ecological parameters [48, 76, 77]. Considering that the carrying capacity is the
227
number of individuals that the environment can support [78], the largest population supported with
228
water resources produced by ecosystems in a specific river basin can be defined as:
229
WRCC = WS
WD×α (8)
230
where WS is available water [m3 yr-1], WD is the water supply equal to 92 m3 inh.-1 [79] (National
231
Regulatory Plan for Aqueducts, 1963), and α is the use coefficient, assumed equal to 0.8, which is the
232
value commonly used for designing city sewers.
233
2.3. Assessment of surface runoff
234
The peak flow during flood events is an important parameter for dimensioning hydraulic
235
infrastructures and for defining the floodplain areas (Flood Directive 2007/60/CE) [80]. In order to
236
realistically estimate the runoff value, advanced methodologies for rainfall – runoff transformation
237
are available [81]. The most commonly used method is the "rational formula" for its simplicity and
238
the reduced amount of input data required [82]. In order to estimate peak flow (QP) this formula is
239
particularly used in small basins:
240
QP= C ×
itr
3.6× A (9)
241
where C [adimensional] is runoff coefficient, itr [mm h-1] is the rainfall intensity for assigned return
242
time, A [km2] is the watershed surface. Specific experimental data are available concerning the
243
runoff coefficient in the analyzed basin [83]. Assuming a return time of 200 years, the rainfall
244
intensity for the study area is 18.2 mm h-1. This value was calculated on the basis of pluviometric
245
probabilistic curves for the studied area [84].
246
2.4. The study area
247
The “Bonis” hydrographic basin (39°25’15’’N e 16°12’38’’E) is located in the province of
248
Cosenza in the Calabrian Region (Figure 1). From the hydrological point of view, an annual average
249
rainfall of 1200 mm and average losses for evapotranspiration of 300 mm are reported [85].
250
251
Figure 1 - Bonis River Basin [84]
252
Table 1 - Morphometric parameters of the Bonis basin
253
Basin area 1.387 km2
Basin perimeter 5.7 km
Length of river 2.2 km
Average height of basin 1’131 m
Maximum height of the basin 1’301 m
Height of runoff measurement station 975 m
Average slope of the basin 43.4 %
Slope of river 12.5 %
Average slope of the drainage network 24.5 %
Altitude difference of the main river 275 m
Altitude difference between basin’s closing section and watershed 326 m
Drainage density 7.43 km km-2
Gravelius coefficient 1.37
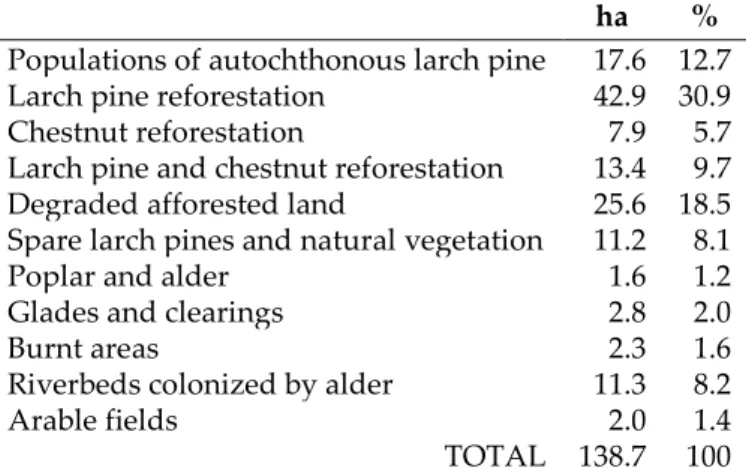
Table 2 - Land use in the Bonis basin
254
ha %
Populations of autochthonous larch pine 17.6 12.7
Larch pine reforestation 42.9 30.9
Chestnut reforestation 7.9 5.7
Larch pine and chestnut reforestation 13.4 9.7
Degraded afforested land 25.6 18.5
Spare larch pines and natural vegetation 11.2 8.1
Poplar and alder 1.6 1.2
Glades and clearings 2.8 2.0
Burnt areas 2.3 1.6
Riverbeds colonized by alder 11.3 8.2
Arable fields 2.0 1.4
TOTAL 138.7 100
The basin has been the object of numerous experimental studies and it is characterized in detail
255
by the hydro-geomorphologic and territorial points of view (Tables 1 and 2). Soil use determines a
256
flow coefficient between 0.18, in the case of forests having good vegetative status, and 0.35 as a result
257
of the cuttings for maintenance and fire-fighting actions [83].
258
2.5. Scenarios
259
Since the proposed methodology allows either the evaluation of hydrological services provided
260
by the ecosystems, or the determination of the carrying capacity, or the effects on the soil of the rainy
261
events, different scenarios of land use and canopy management were analyzed to evaluate the
262
effects on hydrological eco-services. Specifically, the following scenarios were considered: 1) forest
263
cover with good vegetative status (baseline scenario); 2) forest with low vegetation vigor (e.g. after
264
cutting or fire-fighting actions); 3) agricultural conversion on 50% of the basin surface; 4) soil sealing
265
on 1.5% of the basin surface (e.g., roads, tourist resorts). Scenarios 1 and 2 are related to the current
266
land use (Table 2) but with two different levels of forest vegetation vigor. Scenarios 3 and 4 are
267
related to a change in land use compared to that described in Table 2 with the insertion of
268
agricultural or impervious areas and relative reduction of the forest area.
269
3. Results
270
The application of the proposed methodology allows the quantitative and economic evaluation
271
of the hydrological services provided by the ecosystems in the Bonis basin. The four above defined
272
indicators have been calculated for four land use scenarios and they are reported as following:
273
Table 3 "water provisioning" (WS), Table 4 "water flow regulation" (WC), Table 5 “water
274
purification” (COD) and Table 6 “soil protection” (βe). In the Table 4, in addition to the
275
quantification of the "water regulation" service, the 2-century peak flow (Equation 9) was also
276
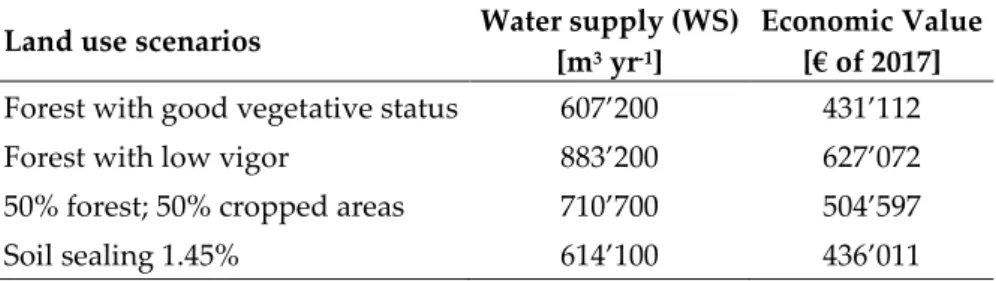
reported, indicative of the effects of meteoric events at the soil surface.
277
WS has highest values (Table 3), both in terms of water provisioning and economic value when
278
the forest cover is characterized by low plants’ vigor, while the lowest value is estimated in the case
279
of forest having high values of leaf area. This information can be successfully used to improve
280
decisions planning, with particular attention to (i) agro-forestry, (ii) water management, (iii) plan of
281
hydraulic infrastructures to meet the water demand from the various socio-economic sectors. From
282
the economic point of view, the value of the water provisioning service depends mainly on
283
climatological aspects (rainfall and evapotranspiration) that cannot be significantly controlled by
284
anthropic action on the basin. Actually the choice of dry farming systems or of species
285
drought-tolerant, or having a reduced leaf area, can increase the amount of water provision (and, as
286
a consequence, the economic benefit from this ecosystem service).
287
Table 3 - Ecosystem service "water provisioning" of the Bonis basin: variations at annual scale time of
288
physical and economic values in four land use scenarios of quantitative (WS) and economic values
Land use scenarios Water supply (WS) [m3 yr-1]
Economic Value [€ of 2017]
Forest with good vegetative status 607’200 431’112
Forest with low vigor 883’200 627’072
50% forest; 50% cropped areas 710’700 504’597
Soil sealing 1.45% 614’100 436’011
290
Regulating water flow is an eco-systemic service (WC, Table 4) closely related to meteoric
291
events, and specifically to runoff. From the values reported in table 4 it is evident that the amount of
292
water flow does not change at a yearly scale in the different scenarios. However WC affects the peak
293
flow and, consequently, the hydraulic hazard of the basin. Peak flow is closely related to soil use and
294
vegetation management. Moreover, when the area is covered by forest, the lamination effect on
295
water flows is better distributed than in other scenarios. This relation is linked to the runoff
296
coefficient, experimentally determined for the Bonis basin by [83] Veltri et al. (2013) before and after
297
the vegetation cutting. In the scenarios “forest” and “forest with low vigor” the runoff coefficients
298
were experimentally determined, while in agricultural conversion scenarios, and under soil sealing
299
conditions, the outflow coefficients were obtained from table values commonly used for
300
hydrological models. Furthermore, the economic value of the water flow regulating ecosystem
301
service (Table 4) has been closely related to vegetation, whose characteristics significantly affect
302
interception, evapotranspiration and infiltration processes.
303
Crops with high leaf area and developed root system subtract further meteoric water from the
304
runoff component of the hydrological balance, having positive effects on the economic value of the
305
eco-systemic service “water flow regulating”. And the results show that the reduction of leaf area,
306
due to forest cutting, results in a reduction in the economic value of the water regulation service of
307
approximately 12’000 €.
308
The water purification service has been quantified by estimating the TOC and COD quality
309
parameters (Table 5). Values reported in Table 5 do not indicate any difference among different
310
forest managements. Moreover, the results show that the agricultural conversion of forestland
311
causes an increase in the organic and inorganic compounds present in the waters. However, in all
312
scenarios, the COD and TOC values are suitable for the human consumption. In fact, the estimated
313
concentrations are lower than the quality thresholds established by national and international
314
drinking water regulations (Legislative Decree 31/2001) [86]. The economic value of the ecosystem
315
service can not be estimated in absolute terms as it is related to the variations in quality caused by
316
land use changes. For this reason, relatively to the total water volume produced annually from the
317
basin, the active charcoal (PAC) was estimated as the amount needed to reduce the TOC from
318
agriculture scenario to the TOC values calculated in the forest scenario. The required activated
319
charcoal costs € 1’871.
320
Table 4 - Ecosystem service "water flow regulation" of the Bonis basin: variations of physical (WC)
321
and economic values in four land use scenarios. Peak flow and runoff (2-century return time) are also
322
reported.
323
Land use scenarios
Peak flow [m3 s-1] Runoff [m3] Water conservation (WC)[m3] Economic value [€ of 2017]
Forest with good vegetative status 1.26 2’464 108’901 561’929
Forest with low vigor 2.46 4’812 106’553 549’811
50% forest, 50% cropped areas 3.49 6’524 104’541 539’436
Table 5 - Ecosystem service "water purification" of the Bonis basin: variations of physical and
324
economic values in four land use scenarios. COD is Chemical Oxygen Demand; TOC is Total Organic
325
Carbon; PAC is powdered activated carbon.
326
Land use scenarios
COD [mgl-1] TOC [mgl-1] PAC [mg l-1]
Water purification cost [€ of 2017]
per liter basin scale
Forest with good vegetative status 0.029 0.010 -
Forest with low vigor 0.029 0.010 -
50% forest; 50% cropped areas 0.340 0.113 1.65 2.63 x 10⁻⁶ 1’871
Soil sealing 1.45% 0.032 0.011 0.02 2.53 x 10⁻⁸ 15
The "soil protection" service (Table 6) was evaluated in all scenarios. The results show a marked
327
increase in soil loss due to the variation of the Cfactor from 0.02 (forest areas) to 0.20 (cultivated areas)
328
in half the area of the basin.
329
Table 6 - Eco-systemic service “soil protection” of the Bonis basin (mitigated impact on soil erosion):
330
variations of quantitative and economic values in four land use scenarios. Water erosion prevention:
331
avoided soil losses for basin surface (t year-1) respect to the "bare soil" conditions.
332
Land use scenarios Ecosystem service “soil
protection” [t yr-1]
Value of the avoided erosion [€ of 2017]
Forest with good vegetative status 2376.9 106’961
Forest with low vigor 2189.3 98’516
50% forest; 50% cropped areas 1813.9 81’628
Soil sealing 1.45% 2377.8 107’001
As for the water purification, the service can not be estimated in absolute terms, but only by
333
comparing the current situation with the “bare soil” conditions. It follows that the soil necessary to
334
restore the amount lost in the agricultural conversion (563 t yr-1) in one year is 25’335 € yr-1.
335
Considering the resulting value from all ecosystem services associated to each scenario (Table
336
7), the most convenient one, if compared to the baseline scenario, results to be the forest with a low
337
vigor. Here the runoff increases to the advantage of the water provisioning but to the slight
338
disadvantage of the water retention capacity. In order to evaluate the ecosystem service, for
339
scenarios 3 and 4, the cost for water purification are negative because represent a degradation of
340
water quality.
341
Table 7– Hydrological eco-systemic service value of the Bonis basin and comparison with baseline
342
scenario
343
Land use scenarios Ecosystem service value
[€ of 2017]
Relative ecosystem service value [€ of 2017]
Forest with good vegetative status 1’100’002 /
Forest with low vigor 1’275’399 175’397
50% forest; 50% cropped areas 1’123’790 23’788
Soil sealing 1.45% 1’104’550 4’548
344
Regarding the capacity of water resources produced in the Bonis basin, the WRCC indicator
345
was equal to 8’500 people in the forest cover scenario. The reduction of leaf coverage by means of
346
cutting, or agricultural conversion, results in an increase in carrying capacity as the greater
production of water allows to meet the needs of a larger number of inhabitants (about 10’000
348
people).
349
Given the close dependence of WRCC on WC indicator, which depends on rainfall, particular
350
attention must be paid to future climate scenarios.
351
In addition, in order to align water availability to requirements, it can be advisable to introduce
352
unconventional water (reclaimed water) for alternative uses (industry, irrigation) and alleviating the
353
pressure on resources for the direct human consumption (drinking water).
354
In planning a Mediterranean agro-forest area, the reduction of the evapotranspiration levels
355
should be suitable, and, in case of irrigated farming systems, species growing with both
356
conventional and non-conventional water resources should be preferred. However, this issue needs
357
to be properly harmonized with the aim of protecting the territory from the adverse effects of floods
358
[87].
359
Results of this study show that the intensity of these phenomena is closely related to the soil use
360
and management. Specifically, the amount of runoff and its hydrodynamic characteristic depend
361
significantly on the type of canopy and its vegetative state. With regard to the Bonis basin (Table 4),
362
the available data allowed to estimate the peak flow QP for rainy events with a return time of 200
363
years. In conditions of good vegetative status, the estimated QP200 was 1.26 m3s-1. This value
364
increases to 2.46 m3s-1 in the immediate post-cutting period. The increase in the flow rate caused by
365
the forest system management is thus 100%, with significant effects on the intensity of alluvial
366
phenomena. The magnitude of the negative impact on runoff increases further in the case of
367
agricultural conversion of 50% of the basin, resulting in a peak flow of 3.49 m3s-1.
368
369
4. Discussion
370
Interventions on the eco-systems and on the territory described above mainly affect soil loss,
371
water provisioning and its purification. Once quantified the available water, the water harvesting
372
systems can be planned at a basin scale. In fact, water losses associated with vegetation transpiration
373
have a positive impact on the water flow regulating service and potentially negative for the supply
374
of water resources. At the same time, forest vegetation results in a strong protective action against
375
the soil removal caused by erosion. However these aspects needs to be properly analyzed since the
376
presence of vegetation also determines the space-time distribution of water resources by reducing
377
runoff velocity and the potential for increasing groundwater storage and infiltration [88, 83, 56]. The
378
different dynamics of these hydrological processes affect the hydraulic residence time in the basin
379
and the reduction of the seasonal variation of the seasonal fluctuations [89]. It has been shown that
380
the increase in the forest area reduces irregularities in the runoff and increases the water retention
381
time within the catchment area [88]. A significant negative correlation between forest area and water
382
pollution has been also identified [2]. The amount of water with qualitative characteristics suitable
383
for anthropic uses is a key element for determining the environmental carry capacity. This capacity
384
is in fact defined as the maximum consumption of natural resources that can be supported in an
385
area, without compromising the state of quality and quantity of water in an ecosystem [90, 91, 92].
386
Modelling studies of the water balance and evapotranspiration can improve the estimation of
387
the hydrological quantities with positive effects on the evaluation of ecosystem services.
388
In perspective, the potential of this methodology, developed for territorial planning at
389
micro-scales, can increase if the empirical functions used in this exercise will be replaced by
390
mathematical models.
391
To transform the quantitative results in economic value achievable from the eco-system
392
services, the unit costs are taken into account. In the paragraph 2.1.5 the ranges of these costs are
393
reported for each considered service. In the exercise here reported for the Bonis watershed case
394
study, the effective costs usually used in Italy have been considered. These values generally
395
correspond to the minimum economic values of the indicated ranges, mainly for two costs items:
396
storm – water retention and soil replacement.
In order to validate the robustness of the proposed methodology, the results of a sensitivity test
398
are analyzed. It consists in using different unitary costs for estimating the values of an ecosystem
399
service and then to compare the results. Therefore, the ecosystem economic value has been
400
recalculated for the following hypotheses: case i) unit costs (see paragraph 2.1.5) referred to the
401
minimum values of ranges; case ii) maximum unit cost for storm - water retention systems and
402
invariance of other economic parameters; case iii) maximum unit cost for soil replacement and
403
invariance of the other economic parameters; case iv) average unit costs for storm - water retention
404
systems and for soil replacement, invariance of other economic parameters.
405
Figure 2 shows an economic sensitivity analysis which allows to validate the robustness of the
406
proposed approach. The maximum increase (respect to case i) in the total value of ecosystem
407
services is obtained (130%) in the case iii). As for the case ii) the increment is 92% and it corresponds
408
to about 50% in the case iv).
409
If the unit cost attributed to the ecosystem services varies within the above-reported ranges
410
(paragraph 2.1.5), the trends do not change with the land use scenario. The only exception is
411
observed for the third land use scenario: where the 50% of lands is used by cropping systems to the
412
detriment of the forest territory: here the economic value of the hydrological eco-services is
413
systematically the lowest. The sensitivity analysis suggests that any increase in the cost of soil
414
replacement (as for the cases iii and iv) entails the economic significance of the forest surfaces in a
415
watershed, in terms of their extend, care and sound management.
416
417
418
Figure 2 – Sensitivity analysis: variations of the economic values of the hydrological eco-services
419
according four cost cases in four land use scenarios
420
5. Conclusions
421
The research has shown that, under typical Mediterranean conditions, changes in land use and
422
vegetation management have a significant impact on eco-hydrological processes occurring at the
423
watershed scale. For this reason, the analysis of the effects of territorial planning on the hydrological
424
cycle and on the quality is a prerequisite in order to protect the state of water resources and
425
hydrogeological equilibria at the same time. As an example, water provisioning (WS) could be
426
improved by 17 % when the forest surface is halved, however the peak flow increases (by 176%) as
427
well the soil erosion (563 t y-1). These figures change when the forest is adequately managed (low
428
vigor due to the cutting): respect to the forest not properly managed (Forest with good vegetative
429
status) WS improves by 45% and the peak flow increases by 95% (about the half of the previous
430
scenario when the cropped areas occupy the 50 % of the watershed) and the soil erosion is of the
431
same extent: 188 t y-1 more.
432
The proposed methodology is an useful tool for designing appropriate water harvesting
433
systems. Moreover the methodology allows to quantitatively analyze the effects of planning land
434
use on actual or future water resources availability, water quality and the intensity of flood
435
phenomena. It also provides a rigorous economic quantification of ecosystem services, in order to be
436
0 500000 1000000 1500000 2000000 2500000 3000000case i: minimum cost of soil and hydraulic works
case ii: maximum cost of hydraulic works
case iii: maximum cost of soil replacement
case iv: medium cost of soil and hydraulic works
Ec o no m ic v al ue s [€ o f 2017]
Forest with good vegetative status Forest with low vigor
50% forest; 50% cropped areas Soil sealing 1.45%
able to tailor more precise and suitable policies measures for forest areas or for managing the land
437
use in a watershed.
438
The sensitivity analysis confirms that the proposed approach provides effective results also in
439
estimating economic values of the ecosystem services, even if unit cost (mainly for the soil
440
replacement or the storm - water retention systems) considerably changes.
441
In perspective, the economic estimation of the ecosystem services allows to consider incentives,
442
or tax policy, as a tool for the river basin planning, by supporting the land use variations which
443
might improve the state of water resources. These measures are also foreseen in the Water
444
Management Plans (2000/60 / CE) and the Floods (Dir. 2007/60 / EC) to improve water status and
445
water retention.
446
Acknowledgments: This work was partially carried out within the "ALForLab" Project (PON03PE_00024_1)
447
co-funded by the 2007-2013 National Operational Program for Research and Competitiveness (PON R & C),
448
through the European Regional Development Fund (FESR) and national resources (rotation fund (FDR) - MIUR
449
Action and Cohesion (CAP) Plan).
450
The contribution to the execution of this article was equally divided by the Authors.
451
References
452
1. Mastrorilli, M.; Zucaro, R. Towards sustainable use of water in rainfed and irrigated cropping systems:
453
review of some technical and policy issues. AIMS Agriculture and Food 2016, 1: 294-314 DOI:
454
10.3934/agrfood.2016.3.294
455
2. Huang, J.; Zhan, J.; Yan, H.; Wu, F.; Deng, X. Evaluation of the Impacts of Land Use on Water Quality: A
456
Case Study in Th eChaohu Lake Basin. Sci. World J. 2013, 329187:1-329187:7, doi:10.1155/2013/329187.
457
3. Weatherhead, E.K.; Howden, N.J.K. The relationship between land use and surface water resources in the
458
UK. Land Use Policy2009, 26(1), :S2:43-S2:50, doi:10.1016/j.landusepol.2009.08.007.
459
4. Ran, J.; Nedovic-Budic, Z. Integrating spatial planning and flood risk management: A new conceptual
460
framework for the spatially integrated policy infrastructure. Comput. Environ. Urban Syst. 2016, 57, 68–79,
461
doi:10.1016/j.compenvurbsys.2016.01.008.
462
5. Yong, S.T.Y.; Chen, W. Modeling the relationship between land use and surface water quality. J. Environ.
463
Manage. 2002, 66, 377–393, doi:10.1006/jema.2002.0593.
464
6. Jackson, B.M.; Wheater, H.S.; Mcintyre, N.R.; Chell, J.; Francis, O.J.; Frogbrook, Z.; Marshall, M.; Reynolds,
465
B.; Solloway, I. The impact of upland land management on flooding: insights from a multiscale
466
experimental and modelling programme. J. Flood Risk Manag. 2008, 1, 71–80,
467
doi:10.1111/j.1753-318X.2008.00009.x.
468
7. Scanlon, B.R.; Jolly, I.; Sophocleous, M.; Zhang, L. Global impacts of conversions from natural to
469
agricultural ecosystems on water resources: Quantity versus quality. Water Resour. Res. 2007, 43(3),
470
W03437:1-W03437:18, doi:10.1029/2006WR005486.
471
8. Anderson, J.M.; Burt, T.P. The role of topography in controlling through flow generation. Earth Surf.
472
Process. Landf. 1978, 3, 331–344, doi:10.1002/esp.329003040.
473
9. Dunne, T. Field studies of hillslope flow processes. In: Hillslope Hydrology, Kirkby, M.J. (Ed.), John Wiley &
474
sons, Chichester, U.K. 1978, 227-293, ISBN: 978-0-471-99510-4.
475
10. Renard, K. G.; Foster, G. R.; Weesies, G. A.; Porter, J. P. RUSLE: Revised universal soil loss equation. J. Soil
476
Water Conserv. 1991, 46, 30-33.
477
11. Mogollòn, B.; Frimpong, E.A.; Hoegh, A.B.; Angermeier, P.L. An empirical assessment of which inland
478
floods can be managed. J. Environ. Manage. 2016, 167, 38-48, doi:10.1016/j.jenvman.2015.10.044.
12. Haregeweyn, N.; Tsunekawa, A.; Poesen, J.; Tsubo, M.; Meshesha, D.T.; Fenta, A.A.; Nyssen, J.; Adgo, E.
480
Comprehensive assessment of soil erosion risk for better land use planning in river basins: case study of
481
the Upper Blue Nile. River. Sci. Total Environ. 2017, 574, 95-108, doi:10.1016/j.scitotenv.2016.09.019.
482
13. Wang, B.; Zhang, G.-h.; Shi, Y.-y.; Zhang, X.C.; Ren, Z.-p.; Zhu, L.-j. Effect of natural restoration time of
483
abandoned farmland on soil detachment by overland flow in the Loess Plateau of China. Earth Surf.
484
Process. Landforms 2013, 38, 1725–1734. doi:10.1002/esp.3459
485
14. Xiao, Q.; McPherson, E.G.; Ustin, S.L.; Grismer, M.E.; Simpson, J.R. Winter rainfall interception by two
486
mature open-grown trees in Davis, California. Hydrol. Process. 2000, 14, 763-784,
487
doi:10.1002/(SICI)1099-1085(200003)14:4<763::AID-HYP971>3.0.CO;2-7.
488
15. Price, K.; Jackson, C.R.; Parker, A.J. Variation of surficial soil hydraulic properties across land uses in the
489
southern Blue Ridge Mountains, North Carolina, USA. J. Hydrol. 2010, 383, 256–268,
490
doi:10.1016/j.jhydrol.2009.12.041.
491
16. Wahren, A.; Feger, K.H.; Schwarzel, K.; Munch, A. Land-use effects on flood generation – considering soil
492
hydraulic measurements in modeling. Adv. Geosci. 2009, 21, 99–107, doi:10.5194/adgeo-21-99-2009.
493
17. Tyszka, J.; Stolarek, A. Changes in runoff as an indicative measure of water retention status in the
494
Białowiea Primeval Forest. Folia For. Pol., series A, 2013, 55(2), 72-88, doi:10.2478/ffp-2013-0008.
495
18. Neris, J.; Jiménez, C.; Fuentes, J.; Morillas, G.; Tejedor, M. Vegetation and land-use effects on soil
496
properties and water infiltration of Andisols in Tenerife (Canary Islands, Spain). Catena 2012, 98, 55–62,
497
doi:10.1016/j.catena.2012.06.006.
498
19. Thompson, S.E.; Harman, C.J.; Heine, P.; Katul, G.G. Vegetation‐infiltration relationships across climatic
499
and soil type gradients. J. Geophys. Res. 2010, 115, G02023:1 - G02023:12, doi:10.1029/2009JG001134.
500
20. Lin, B.; Chen, X.; Yao, H.; Chen, Y.; Liu, M.; Gao, L.; James, A. Analyses of land use change impacts on
501
catchment runoff using different time indicators based on SWAT model. Ecol. Indic. 2015, 58, 55–63,
502
doi:10.1016/j.ecolind.2015.05.031.
503
21. Lin, K.; Lv, F.; Chen, L.; Singh, V.P.; Zhang, Q.; Chen, X. Xinanjiang model combined with Curve Number
504
to simulate the effect of land use change on environmental flow. J. Hydrol. 2014, 519, 3142–3152,
505
doi:10.1016/j.jhydrol.2014.10.049.
506
22. Liu, Y.B.; De Smedt, F.; Hoffmannb, L.; Pfister, L. Assessing land use impacts on flood processes in
507
complex terrain by using GIS and modeling approach. Environ. Model. Assess. 2004, 9, 227–235,
508
doi:10.1007/s10666-005-0306-7.
509
23. Marapara, T.R. Eco-hydrology interactions between trees, soil and water in terrestrial and wetland areas:
510
The effect of tree planting on water flow dynamics in Wairarapa Wetlands, New Zealand, Ph.D Thesis,
511
Victoria University, Wellington New Zeland, 2016.
512
24. Bloschl, G.; Ardoin-Bardin, S.; Bonell, M.; Dorninger, M.; Goodrich, M.; Gutknecht, D.; Matamoros, D.;
513
Merz, B.; Shand, P.; Szolgay, J. At what scales do climate variability and land cover change impact on
514
flooding and low flows? Hydrol. Process 2007, 21, 1241–1247, doi:0.1002/hyp.6669.
515
25. Smith, L. K.; Voytek, M. A.; Böhlke, J. K.; Harvey, J. W. Denitrificationin nitrate-rich streams: application of
516
n2:ar and 15n-tracer methods in intact cores. Ecol. Appl. 2006, 16, 2191–2207.
517
doi:10.1890/1051-0761(2006)016[2191:DINSAO]2.0.CO;2.
518
26. Saghafian, B.; Khosroshahi, M. Unit Response Approach for Priority Determination of Flood Source Areas.
519
J. Hydrol. Eng. 2005, 10(4), 270-277, doi:10.1061/(ASCE)1084-0699(2005)10:4(270).
520
27. Du, S.; Shi, P.; Rompaey, A.V.; Wen, J. Quantifying the impact of impervious surface location on flood
521
peak discharge in urban areas. Nat. Hazards 2014, 76, 1457-1471, doi:10.1007/s11069-014-1463-2.
28. Garmendia, E.; Mariel, P.; Tamayo, I.; Aizpuru, I.; Zabaleta, A. Assessing the effect of alternative land uses
523
in the provision of water resources: Evidence and policy implications from southern Europe. Land Use
524
Policy 2012, 29, 761–770, doi:10.1016/j.landusepol.2011.12.001;
525
29. Nyeko, M.; D’Urso, G.; Immerzeel, W.W. Adaptive simulation of the impact of changes in land use on
526
water resources in the lower Aswa basin. J. Agr, Eng. 2012, 43, 159-164, doi:10.4081/jae.2012.e24.
527
30. O’Connell, E.; Ewen, J.; O’Donnell, G.; Quinn, P. Is there a link between agricultural land-use management
528
and flooding? Hydrol. Earth Syst. Sci. 2007, 11(1), 96-107.
529
31. Andréassian, V. Waters and forests: from historical controversy to scientific debate.J. Hydrol. 2004, 291, 1–
530
27. doi:10.1016/j.jhydrol.2003.12.015.
531
32. Castellini, M.; Iovino, M.; Pirastru, M.; Niedda M.,; Bagarello, V. Use of BEST Procedure to Assess Soil
532
Physical Quality in the Baratz Lake Catchment (Sardinia, Italy) Soil Sci. Soc. Am. J. 2016, 80: 742 755,
533
doi:10.2136/sssaj2015.11.0389
534
33. Barbano, A.; Braca, G.; Bussettini, M.; Dessì, B.; Inghilesi, R.; Lastoria, B.; Monacelli, G.; Morucci, S.; Piva,
535
F.; Sinapi, L.; Spizzichino, D. Propostametodologica per l’aggiornamento delle mappe di pericolosità e di
536
rischio - Attuazione dellaDirettiva 2007/60/CE relativa alla valutazione e alla gestione dei rischi da
537
alluvioni (D.L. n.49/2010). Ed. ISPRA, Roma, Italy, Manuali e Linee Guida 82/2012, Publisher: ISPRA,
538
Istituto Superiore per la Protezione e la Ricerca Ambientale, ISBN: 978-88-448-0571-5.
539
34. Souchere, V.; King, D.; Daroussin, J.; Papy, F.; Capillon A. Effects of tillage on runoff directions:
540
consequences on runoff contributing area within agricultural catchments. J. Hydrol. 1998, 206, 256-267,
541
doi:10.1016/S0022-1694(98)00103-6.
542
35. Valle, R.F. Jr.; Varandas, S.G.P.; Pacheco, F.A.L.; Pereira, V.R.; Santos, C.F.; Cortes, R.M.V.; Fernandes,
543
L.F.S. Impacts of land use conflicts on riverine ecosystems. Land Use Policy 2015, 43, 48-62,
544
doi:10.1016/j.landusepol.2014.10.015.
545
36. Butler, C.; Pidgeon, N. From ‘flood defence’ to ‘flood risk management’: Exploring governance,
546
responsibility, and blame. Environ. Plan. 2011, 29(3), 533–547, doi:10.1068/c09181j.
547
37. Bosch, J.M.; Hewlett, J.D. A review of catchment experiments to determine the effect of vegetation changes
548
on water yield and evapotranspiration. J. Hydrol. 1982, 55, 3-23, doi:10.1016/0022-1694(82)90117-2.
549
38. Harrison, P.A.; Berry, P.M.; Simpson, G.; Haslett, J.R.; Blicharska, M.; Bucur, M.; Dunford, R.; Egoh, B.;
550
Garcia-Llorente, M.; Geamănă, N.; Geertsema, W.; Lommelen, E.; Meiresonne L.; Turkelboom, F. Linkages
551
between biodiversity attributes and ecosystem services: a systematic review. Ecosyst. Serv. 2014, 9, 191–203,
552
doi:10.1016/j.ecoser.2014.05.006.
553
39. Boelee, E.; Yohannes, M.; Poda, J.N.; McCartney, M.; Cecchi, P.; Kibret, S.; Hagos, F.; Laamrani H. Options
554
for water storage and rainwater harvesting to improve health and resilience against climate change in
555
Africa. Reg. Environ. Change. 2013, 13, 509-519, doi:10.1007/s10113‐012‐0287‐4.
556
40. Wheater, H.; Evans, E. Land use, water management and future flood risk. Land Use Policy 2009, 26(1),
557
S2:51–S2:64, doi:10.1016/j.landusepol.2009.08.019.
558
41. Pisante, M.; Stagnari, F.; Grant, C.A. Agricultural innovations for sustainable crop production
559
intensification. It. J. of Agron. 2012, 7:300-311.
560
42. Stagnari, F.; Jan, S.; Galieni, A.; Pisante, M. Sustainable agricultural practices for water quality protection.
561
In: Ahmad P (ed) Water Stress and Crop Plants: A Sustainable Approach 2016, pp 75-85.
562
43. Ramazzotti, S.; Stagnari, F.; Pisante, M. Integrated soil and water management for vineyards in southern
563
Italy: A case study. It. J. of Agron. 2008, 3:117-118.
44. Grêt-Regamey, A.; Bugmann, H.; Burlando, P.; Celio, E.; de Buren, G.; Koellner, T.; Knoepfel, P.; Pappas,
565
C.; Ryffel, A. Securing hydrological ecosystem services through catchment-wide land-use management. In
566
Managing alpine future II: inspire and drive sustainable mountain regions, proceedings of the Innsbruck
567
conference, Austria, 21 - 23 November, 2011, Borsdorf, A., Stötter, J., Veulliet, E., Verl. derÖsterr. Akad.
568
derWiss, 2011, 124 – 133, https://serval.unil.ch/resource/serval:BIB_BD1F27C78C5F.P001/REF.
569
45. Naiman, R.J.; Décamps, H. The ecology of interfaces: riparian zones. Annu. Rev. Ecol. Evol. Syst. 1997, 28,
570
621–658, doi:10.1146/annurev.ecolsys.28.1.621.
571
46. Pires, M. Watershed protection for a world city: the case of New York. Land Use Policy 2004, 21, 161–175,
572
doi:10.1016/j.landusepol.2003.08.001.
573
47. Chang, H.S.; Hsieh, H.Y.An exploratory study on land use planning of disaster prevention: A case study
574
of Kaohsiung new town. Procedia Environ. Sci. 2013, 17, 382–391, doi:10.1016/j.proenv.2013.02.051.
575
48. Li, W.M.; Zhang, K. Evaluation and analysis of water resources carrying capacity in arid zone – A case of
576
Manas basin. In Water Resources and Environment Proceedings of the 2015 International Conference on Water
577
Resources and Environment: Beijing, China, 25-28 July 2015, Scholz M., CRC Press/Balkema: Leiden, The
578
Netherlands 2016, 103-108.
579
49. Morri, E; Pruscini, F.; Scolozzi, R.; Santolini, R. A forest ecosystem services evaluation at the river basin
580
scale: Supply and demand between coastal areas and upstream lands (Italy). Ecol. Indic. 2014, 37, 210–219,
581
doi:10.1016/j.ecolind.2013.08.016.
582
50. Kinnell, P.I.A. Event soil loss, runoff and the Universal Soil Loss Equation family of models: A review. J.
583
Hydrol. 2010, 385, 384–397, doi:10.1016/j.jhydrol.2010.01.024.
584
51. Ventrella, D.; Stellacci, A.M.; Castrignanò, A.; Charfeddine, M.; Castellini, M. Effects of crop residue
585
management on winter durum wheatproductivity in a long term experiment in Southern Italy. Europ. J.
586
Agronomy 2016, 77, 188–198
587
52. Pisante, M.; Stagnari, F.; Acutis, M.; Bindi, M.; Brilli, L.; Di Stefano, V.; Carozzi, M. Conservation
588
agriculture and climate change. Conservation Agriculture 2015, pp. 579-620
589
53. Wall,G.J.; Coote, D.R.; Pringle, E.A.; Shelton, I.J. RUSLEFAC - Revised UniversalSoil Loss Equation for
590
Application in Canada. In: A Handbook for Estimating Soil Loss from Water Erosionin Canada, Publisher:
591
Research Branch, Agriculture and Agri-Food, Ottawa, Canada,2002, Contribution No.
592
AAFC/AAC2244E:117.http://sis.agr.gc.ca/cansis/publications/manuals/2002-92/rusle-can.pdf
593
54. Reeves, D.W. Cover crops and rotations. In: Advances in Soil Science, Springer-Verlag, New York, NY, USA,
594
1994, pp. 125–172.
595
55. Panagos, P.; Borrelli, P.; Meusburger, K.; van der Zanden, E.H.; Poesen, J.; Alewell, C. Modelling the effect
596
of support practices (P-factor) on the reduction of soil erosion by water at European scale. Environ. Sci.
597
Policy 2015, 51, 23-34, doi:10.1016/j.envsci.2015.03.012.
598
56. Brauman, K.A.; Daily, G.C.; Ka’eo Duarte, T.; Mooney, H.A. The Nature and Value of Ecosystem Services:
599
An Overview Highlighting Hydrologic Services. Annu. Rev. Environ. Resour. 2007, 32, 67-98,
600
doi:10.1146/annurev.energy.32.031306.102758
601
57. De Groot, R.S.; Wilson, M.A.; Boumans, R.M.J. A typology for the classification, description and valuation
602
of ecosystem functions, goods and services. Ecol. Econ. 2002, 41, 393–408,
603
doi:10.1016/S0921-8009(02)00089-7.
604
58. Nunez, D.; Nahuelhual, L.; Oyarzun, C. Forests and water: the value of native temperate forests in
605
supplying water for human consumption. Ecol. Econ. 2006, 58, 606–616, doi:10.1016/j.ecolecon.2005.08.010