Age and productivity. Human capital
accumulation and depreciation
A.
R
UZIK-S
IERDZINSKA,
M.
L
IS,
M.
P
OTOCZNA,
M.
B
ELLONI,
C.
V
ILLOSIONEUJOBS Working Paper No. 17.2
June 2013
Abstract
This NEUJOBS research report focuses on links between age, productivity and lifelong learning. Various data sources (EU-SILC, LFS, Structure of Earnings Survey, SHARE, ELSA, SHARELIFE) and methodological approaches were used in this report.
Our analysis identifies clusters of countries with common characteristics of age-earnings profiles (for certain groups of employees) and allows for an explanation of those differences. Some differences can be attributed to the share of sectors, education types, and occupations in country-specific employment. Others are due to labour market institutions and the (dis)incentives to work at older ages provided by social security systems. Additionally, the dynamics of earnings after age 50 differ less between educational and occupational groups than at earlier ages.We show that the dynamics of average wages are strongly influenced by the timing of entering and leaving labour market. An estimation of the impact of LLL on productivity (measured by earnings) at older ages shows that for employees aged 50+, participation in training increases wages in the short-term.
NEUJOBS Working Documents are intended to give an indication of work being
conducted within the NEUJOBS research project and to stimulate reactions from other experts in the field. Texts published in this series are ultimately destined for academic publishing. The views expressed in this paper are those of the authors and do not necessarily represent any institution with which they are affiliated. See the last page for more information about the NEUJOBS project.
Available for free downloading from the NEUJOBS website (http://www.neujobs.eu)
Contents ... 2
1. Introduction ... 1
2. Literature review ... 2
2.1 Age and productivity ... 2
2.2 Lifelong learning ... 3
3. Analyses of age-earnings profiles and productivity for selected EU countries... 7
3.1 Age-earnings profiles, employment and institutions ... 7
3.2. Individual career paths ... 24
3.3. Age-earnings profiles in different groups of employees ... 46
4. Possibility to improve productivity at older ages by LLL... 58
4.1. Descriptive analysis based on SHARE and ELSA databases ... 59
4.2. Estimation results of the effect of LLL on older worker’s wages ... 68
5. Conclusions ... 78
1
Age and productivity.
Human capital accumulation and depreciation
A
NNAR
UZIK-S
IERDZINSKA(CASE),
M
ACIEJL
IS,
M
ONIKAP
OTOCZNA(IBS),
M
ICHELEB
ELLONI,
C
LAUDIAV
ILLOSIO(C
ERP)
NEUJOBS
W
ORKINGP
APERN
O.
X/D
ATE1. Introduction
This report has been prepared as deliverable 17.2 for the NEUJOBS project by researchers from the Center for Socio-Economic Research (CASE) and the Institute of Structural Research (IBS), Poland, with input from (CeRP), Italy.
Due to ageing, the population structure of the labour force is changing. The demographic transition will especially affect the European labour market. Additionally, due to rapid technological change, labour markets in many countries require skill transition and lifelong learning to increase the possibility of work until older age. That makes it very important to analyse the impact of ageing on average participation rates or labour productivity and, consequently, on economic growth. The general aim of this working paper is to analyse the links between age, labour productivity and human capital using various (mainly European) datasources and methods. The focus of the research was earnings in the life-cycle of individuals who are active in the labour market. We looked at age-earnings profiles and their connection to individual and employment characteristics, life-long learning, and labour market institutions. Different empirical approaches have been used in order to utilise information from various datasets in the best possible ways. We adopted the assumption that the observed wages of employees are correlated with their productivity, so they can be used as a proxy for productivity1.
After reviewing relevant literature in chapter 2, in chapter 3, we focus on age-earnings profiles and productivity for the EU countries.
Part 3.1 presents a comparison of age-earnings profiles in relation to age-employment structures, using cross section data from EU SILC. We check if the productivity losses postulated by the literature after age 50 affect the earnings profiles, and to what extent the average profiles are affected by the selectivity of retirement transition. We use non-parametric kernel estimators and semi-non-parametric regression models. The results show that the falling employment rate after qualifying for retirement benefits can hardly be attributed to decreasing personal productivity or earnings ability.
Part 3.2. uses data from the SHARELIFE retrospective survey on labour market careers in order to check the validity of the results obtained for individual careers. It turns out
1 Such an assumption should hold for at least certain types of professions. We are also aware
about the possible pay-productivity gap at older ages but due to a lack of access to matched employer-employee data, such an analysis was not possible.
entering and leaving the labour market. Additionally, technological and institutional change seems to influence the wage dynamics of subsequent cohorts. We have also found out that the dynamics of earnings after the age of 50 differ less between educational and occupational groups than earlier.
The aim of part 3.3 is to analyse the relative age-earnings profiles in EU countries. The individual Structure of Earnings Survey (SES) data were used to estimate age-monthly earnings profiles as a loglinear empirical wage models. We show how much earnings change with age and what is the age of maximum expected monthly earnings for full-time employees in different countries, education, types of professions and sectors. Chapter 3 shows that European countries could be grouped into clusters distinguished on the basis of the employment rate in the 51-55 age group and the average length of professional life. In separate clusters, certain similarities in age-earning profiles can be observed.
In chapter 4 we analyse lifelong learning and its potential to improve productivity at older ages. In this chapter, we use SHARE and ELSA datasets as a source of information on individual wages and participation in training activities. Estimated models suggest that the impact of training at older ages on wages may be sizable. Understanding mechanisms governing change of age-earnings or age-productivity profiles helps to formulate appropriate advice for policymakers in order to adapt labour markets to an ageing workforce. Thus, in the conclusion, we discuss the policy implications of our results.
2. Literature review
2.1
Age and productivity
Individual productivity is hard to measure directly and therefore the change of productivity in workers during their lifespan is not directly observable. What is more, the productivity of a worker does not depend only on his abilities and skills but also on the workplace characteristics. However, there are observable variables that signal intrinsic productivity. By change in intrinsic productivity, we understand the shifts that are driven by personal and not workplace-related traits. First, the general health status can be observed. Then, the ability to perform specific tasks (physical or intellectual) during a lifetime might be tested. Finally, the employment rates and earnings of various age groups and cohorts are measured through the use of social surveys. Neoclassical economics contends that wages mirror marginal productivity and apart from personal wealth and preferences, it is low productivity that pushes people out of work. There are also some studies that research firms’ productivity, trying to disentangle the effects of age structure on its workforce. In this part of the report, we overview the main conclusions from the enumerated strands of literature.
The literature on changes in ability to perform working tasks with age concludes that it rises in the first 10 years of working life due to general education and learning-by-doing and maxes out at about 30-35 years old. Then it becomes stable until around 50, when it starts declining. The process of declining productivity is rather slow and strongly depends on both personal and job characteristics (Göbel and Zwick 2009). The ability to work and the age interval of rapid depreciation varies greatly among workers depending on the type of tasks and human capital they possess. Some abilities like reading, vocabulary or ability to cooperate depreciate very slowly, whereas cognitive speed and memory activities are more prone to evaporate with age. Fitness levels (e. g. hand precision, body coordination) are lost most quickly (Verhaegen and Salhouse 1997, Waldman and Avolio 1986 , Park et al. 1999, Maitland et al. 2000). This dimension of ageing is common not only to human beings but also to other primates (Minois and Bourg 1997). These processes might be partially offset by certain behaviours. Katzman (1993) argues that participating in educational courses increases synaptic density in the neocortical association cortex, and could therefore delay the onset of dementia by up to 4–5 years.
An important aspect of the loss of productivity is not only the loss of ability to perform tasks, but also the changing nature of the tasks, which speeds up the deterioration of competences (Keyfitz 1984, Autor et al. 2003). The more rapid the technological change, the faster competences become out-of-date. When this is combined with the loss of ability and motivation to gain new competences, accompanied by the shorter expected working time of older persons, then they become more prone to a loss in productivity, employment and earnings.
Wages do not precisely reflect the pattern of intrinsic productivity as in some types of jobs, the youngest workers are underpaid and the oldest are overpaid. This is a result of information asymmetry between employer and employee, which affects labour contracts in such a way, that it is optimal to underpay young workers and overpay those with more experience (Lazear 1979). However, with the use of an employer-employee dataset for the Netherlands, van Ours and Stoeldraijer (2010) found little evidence of age-related pay-productivity gap. Other empirical results on this phenomenon are not definitive (see Skirbekk 2008 for an overview).
Most studies dealing with age-productivity or age-earnings relation focus on one country on even one industry within a country, with the exception of the OECD 1998 report. Therefore any evidence on the relation between labour market institutions and the life-cycle dynamics of productivity and wages with relation to employment is rather scarce. We try to fill this gap in Chapter 3.
2.2
Lifelong learning
Another interesting strand of literature is focused on the ability to maintain or increase productivity through education, especially lifelong learning. The concept of lifelong learning (LLL) was introduced during the 1970s. The OECD report entitled Recurrent
Education: A Strategy for Lifelong Learning (OECD 1973) was one of the first official
documents assessing the importance of LLL among the education policy priorities. Since then, the consensus on the importance of LLL for providing countries with the
of the firms and the economy, and for reducing socioeconomic disparities within countries, has steadily grown among the international research and policy community and national policy makers (see e.g. OECD 1996, European Commission 2000).
In spite of its longstanding tradition, LLL is still a vague concept. The European Commission defines it as “all learning activity undertaken throughout life, with the aim of improving knowledge, skills/competences and/or qualifications for personal, social and/or professional reasons” (European Commission 2001). LLL encompasses the traditional formal education system (schools, training institutions, universities, etc.), non-formal learning (structured on-the-job training) and informal learning (such as skills learned from family members or people in the community) (Sohnesen and Blom 2005, see also Badescu and Saisana 2008).2
The effect of training on workers’ productivity: a review
Many studies analyse the effect of training on various labour market outcomes such as (un)employment (Bonnal et al. 1997, Gritz 1993, Dieckhoff 2007, Picchio and van Ours 2013, Crépon et al. 2007; Lechner et al. 2008), reintegration into work (Ok and Tergeist 2003, Dieckhoff 2007), career advancement (Dieckhoff 2007), early retirement (Kristensen 2012, de Luna et al. 2010, Montizaan et al. 2007), job satisfaction and perceived job security (Lang 2012). Much of the research attention has been devoted to studying the effects of training on workers’ productivity.
The theoretical foundations of the effects of training on workers’ productivity lie in the human capital theory (Becker 1964, 1993). According to this theory, expenditure on training and education should be considered an investment, since it is undertaken to increase personal incomes. An individual's decision to invest in training is based on a comparison of the net present value of the costs and benefits of such an investment. Individuals are assumed to invest in training during an initial period and to receive returns on the investment in subsequent periods. Workers pay for training by receiving a lower wage while being trained. Since training is thought to make workers more productive, workers collect the returns from their investment in later periods through higher marginal products and higher wages. Human capital models usually decompose training into specific training, which increases productivity in only one firm, and general training, which increases productivity in more than one firm. General training is financed by workers, and the workers receive all of the returns to this training. In contrast, employees and employers share both the costs and the returns of specific training.
2Bengtsson (2009) claims that such a wide definition of LLL has contributed to preventing the
efficient development and implementation of education policies which are alternative to the traditional front-end model. On average, in OECD countries, an individual can expect to receive 988 hours of instruction in non-formal education during his or her working life, 715 of which are instruction in job-related education. There is a huge heterogeneity across countries in the number of expected hours of non-formal education, with Nordic countries (DK, SW, FI, NO) being at the top of the ranking and southern and eastern EU countries (PL, TUR, HU, EL, IT) at the bottom (OECD 2011).
A lot of research efforts have been dedicated to empirically testing Becker’s theory. One branch of the literature attempts to measure the effects on productivity directly, by modeling and estimating the firm production function. These studies commonly exploit information from linked employer-employee datasets or from a survey of firms which contains information on firms’ value added and/or turnover. Among them, it is worth mentioning Ichniowski et al. (1997), Black and Lynch (2001), Dearden et al., (2006), Göbel and Zwick (2010), and Heywood et al. (2010), which report a positive association between company training and productivity. The second branch of this literature evaluates the effect of training on productivity indirectly, by means of its effect on workers’ wages. It assumes that wages are a sufficient statistic for productivity (Dearden et al. 2006) and relies on the traditional neoclassical labour market model with perfectly competitive wages.
One of the first studies belonging to this second type of literature is by Lynch (1992), who estimated wage returns to training for the US, using the early waves of NLSY data (1981 and 1983). She shows that private-sector training plays a significant role in the determination of wages and causes a wage growth of 70 percent among young workers in the United States who do not graduate from college. Using more recent waves of the same dataset, a series of studies such as Loewenstein and Spletzer (1998), Parent (1999), Veum (1995) and Frazis and Loewenstein (2005) confirm Lynch’s findings and find training has a positive effect on wages in the US.
Similarly to the US, the positive effects of training on wages are commonly found in European countries. Nevertheless, the size of the estimated effect varies widely across countries and, for the same country, depends on the data and analytical methods used. An extended empirical literature on this topic exists for the UK. Booth (1991) finds high returns (11per cent for men and 18 per cent for women) of company training on UK workers’ earnings. Relying on different data and methods, however, Booth (1993) finds a much lower effect (1 per cent). Using NCDS data, Blundell et al. (1996, 1999) find positive returns ranging from 3 per cent to 6 per cent depending on the method and sample used; similar results are finally obtained by Arulampalam and Booth (2001). Positive effects of training on wages have also been found for other European countries: Norway (1 per cent increase; Schøne 2004), Switzerland (2 per cent increase; Gerfin 2004), and Portugal (30 per cent for men and 38 per cent for women; Budria and Pereira 2007).
Results for Germany and France are less clear. Using the German GSOEP data, Pischke (2001) finds insignificant wage returns to training, while Mühler et al. (2007) report a significant effect of about 5 to 6 per cent for general training and no effect for firm-specific training. Kuckulenz and Zwick (2003) use data from the Qualification and Career
Survey and show that internal training does not translate into higher earnings while
external training does. Goux and Maurin (2000) find no significant wage effect of trained French workers; however this result is at odds with Fougère et al. (2001) who find positive returns to training for French job-switchers.
Cross-country comparisons of these results are not straightforward because of the different methods and models used, different specifications and also different definitions of training. A first comparative perspective is offered by the OECD (1999), according to which workers who have undergone further training have a higher level
effect of training is insignificant in the case of France and the Netherlands. Bassanini et al. (2007), using ECHP data, estimate a positive impact of training incidence on hourly earnings for all analysed countries, ranging from 3.7 per cent for the Netherlands to 21.6 per cent for Greece.3 Similar findings on the same data and countries are obtained
by Ok and Tergeist (2003).
In a study presented in chapter 4, we focus on older workers. The incidence (and return) of training is often found to decrease with age (e.g. Booth 1991, Bassanini et al. 2007, D´Addio et al. 2010). This result is consistent with Becker’s human capital theory (Becker 1964), since older workers have a shorter working life to amortize investments in training and therefore have less incentive to participate (Warr and Fay, 2001). At the same time, personnel managers tend to have the perception that older employees are less able or willing to learn (Warr and Birdi 1998). Finally, some empirical studies argue that training is less effective for older than for younger employees (e.g. Zwick 2011).
In addition to age, wage returns to training are often found to be heterogeneous with respect to the individual characteristics of the trained employees such as gender, (formal) educational attainments, and professional background. For instance, Parent (2003) for Canada and Blundell et al. (1996) for the UK find lower returns for women than for men. The association between returns to training and returns to education is unclear. For example, Lynch (1992) for the US, Blundell et al. (1996) for the UK, and Kuckulenz and Zwick (2006) for Germany find that returns are higher for more educated workers than for less educated, while Long (2001) for Australia, Budria and Pereira (2007) for Portugal and OECD (1999) for a variety of countries suggest the opposite.4 Concerning returns heterogeneity with respect to professional background,
Budria and Pereira (2007) e.g. report that experienced workers earn more from training than workers with less experience, especially in the private sector. On the contrary, Kuckulenz and Zwick (2006) for Germany find that returns to training are higher for job entrants than for tenured employees.
Returns to training are sometimes found to be higher for workers who switch to a different job than for workers who stay at the same job after having finished training (Loewenstein and Spletzer 1998, Booth and Bryan 2007). In line with what the human capital model predicts, the existence of differential returns between job-switchers and non-switchers crucially depends on the type of training: the latter profit more from internal training (Budria and Pereira 2007), whereas the former gain more from
3 When applying fixed effects, Bassanini et al. (2007) find returns to training which are sensibly
lower and statistically significant only in Denmark, the UK, Italy, Greece, Finland, Portugal and Belgium.
44 It has been stressed that the association between returns to education and returns to training
may give rise to important equity issues. For example, if the returns to training are higher for the less educated, then policies targeted at increasing the program participation of less educated individuals can reduce income inequality; this is especially important if returns to education are high. On average, in OECD countries, individuals with a tertiary education will receive three times as many hours of instruction in non-formal education as those with low levels of education (OECD 2011).
external and general training. Kuckulenz and Zwick (2003) for Germany report that employees with a permanent job contract benefit from higher training returns than those employed on a temporary basis.
Finally, it is debatable whether the amount of training (i.e. number of episodes of training throughout the working life, length of the courses, etc.) affects returns. The evidence is, once again, mixed. Booth and Bryan (2007) find that wages increase with the number of training courses. In contrast, Arulampalam and Booth (2001) only find significant returns to incidence, while the number of training courses is insignificant. Franzis and Loewenstein (2005) report that the wage return to an extra hour of training diminishes rapidly with the amount of training received.
3. Analyses of age-earnings profiles and productivity for selected
EU countries
3.1
Age-earnings profiles, employment and institutions
The aim of this part of the report is to present a comparison of age-earnings profiles in various European countries in relation to age-employment structures. We use cross section data, taking into account the limits of such an analysis compared to a longitudal approach. We check if the universal individual productivity losses after age of 50 as postulated by the literature affect the earnings profiles in various countries, and to what extent the average age-earnings profiles are affected by the selectivity of the transition to retirement.
This work adds to the existing results by presenting a cross-country comparison of hourly wages by yearly age, trying to take into consideration the general and specific human capital. In most of the available results, the age-earnings profiles are presented in 5-10-year age groups, with the oldest being 65+. That makes it impossible to draw any conclusions about the earnings of the oldest workers. What is more, the presented results are not restricted to wages, but all labour related earnings are taken into consideration. The analysis sheds light on the interaction between the employment and productivity profiles among European countries.
We show that there are significant differences in the age-wage patterns across countries which can hardly be attributed to changes in ability to perform certain tasks with age. The regression results let us ascribe most of the differences in the behaviour of average hourly earnings to the changes in the working force structure. The decline of hourly wages is smallest in countries with the longest working life and with the lowest retirement replacement rate, indicating that the construction of pension entitlements strongly affects not only employment, but also the wage structure of the population. Additionally, our work delivers some evidence in favour of moving the retirement age to 65-75 years as we did not find proof of significant losses of hourly wages in that lifespan.
delivering reliable data on labour income, working time and job-related characteristics, that is comparable among countries. Income is reported for the whole previous year. It includes all sources of personal and household income, with a distinction for wages and self-employment, as well as the earnings structure (wage, taxes, social system contribution). In practice, however, the data on gross earnings are available for the biggest sample for most countries and therefore we decided to use gross earnings. The results from surveys from the years 2004-2009 (earnings from 2003-2008) are pooled together, previously normalized with the mean hourly earnings for given country. The hourly earnings are based on the variables indicating gross yearly earnings (from self-employment and wage labour), number of months in work, and usual number of hours worked per week. Due to unreliable data for the number of months spent working, especially for youngsters in Iceland and the UK, the sample was cut to only those working the whole year. The results do not change without this restriction. Taking these remarks into consideration, we test the results after excluding the controversial country/years observation. We have also excluded Malta from the analysis. To remove outliers, one percent of the highest and lowest earners were excluded. As a result, we obtain the relative hourly earnings for every person, with 1 indicating average hourly earnings in the country.
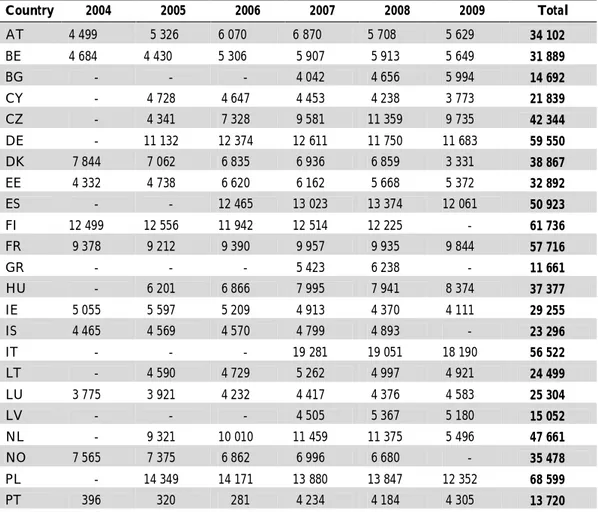
Table 1 Number of observations of hourly earnings for every country and every year
Country 2004 2005 2006 2007 2008 2009 Total AT 4 499 5 326 6 070 6 870 5 708 5 629 34 102 BE 4 684 4 430 5 306 5 907 5 913 5 649 31 889 BG - - - 4 042 4 656 5 994 14 692 CY - 4 728 4 647 4 453 4 238 3 773 21 839 CZ - 4 341 7 328 9 581 11 359 9 735 42 344 DE - 11 132 12 374 12 611 11 750 11 683 59 550 DK 7 844 7 062 6 835 6 936 6 859 3 331 38 867 EE 4 332 4 738 6 620 6 162 5 668 5 372 32 892 ES - - 12 465 13 023 13 374 12 061 50 923 FI 12 499 12 556 11 942 12 514 12 225 - 61 736 FR 9 378 9 212 9 390 9 957 9 935 9 844 57 716 GR - - - 5 423 6 238 - 11 661 HU - 6 201 6 866 7 995 7 941 8 374 37 377 IE 5 055 5 597 5 209 4 913 4 370 4 111 29 255 IS 4 465 4 569 4 570 4 799 4 893 - 23 296 IT - - - 19 281 19 051 18 190 56 522 LT - 4 590 4 729 5 262 4 997 4 921 24 499 LU 3 775 3 921 4 232 4 417 4 376 4 583 25 304 LV - - - 4 505 5 367 5 180 15 052 NL - 9 321 10 010 11 459 11 375 5 496 47 661 NO 7 565 7 375 6 862 6 996 6 680 - 35 478 PL - 14 349 14 171 13 880 13 847 12 352 68 599 PT 396 320 281 4 234 4 184 4 305 13 720
RO - - - 7 226 6 764 6 391 20 381 SE 6 146 6 371 7 328 8 186 8 622 - 36 653 SI - 10 882 12 970 12 010 12 363 12 606 60 831 SK - 6 338 6 328 6 476 7 398 7 115 33 655 UK - 9 798 9 321 8 807 8 139 6 961 43 026 Total 70 638 153 157 175 854 227 925 228 290 177 084 1 032 948
In the final sample, there were almost 3.1 Mio observations of people over 15 years old, and over 1 Mio observations of earners. Their distribution among years-countries is presented in Table 1. There are differences in the year-country composition of the sample, but we do not expect it to influence the results. However, we check it by adding year-dummies to the regressions.
Methods
We use the non-parametric kernel estimators and semi-parametric regression models, that best enable us to show the hourly earnings profiles. Every model is estimated separately for every country. The kernel estimators are well-suited for checking the continuous relation between age and earnings without a need for any functional form assumption. To deepen the analysis, the semi-parametric regression models are estimated. In the semi-parametric approach, an assumption about functional relations among some variables are made, but the key relation between age and earnings remains free from functional assumptions. Therefore, we can present the changes in the smooth wage-earnings profile after factoring out some variables. In all specifications, we choose the Epanechnikov kernel with degree 0 (mean smoothing), and the bandwidth is chosen based on the ROT method for asymptotically optimal constant bandwidth (Fan and Gijbels 1996). The semi-parametric estimator is double residual Robinson’s (1988) estimator.
Employment profiles and clusters of countries
The actual loss in productivity and the ability to work at older ages manifests itself on the extensive side – quitting employment - as well as on the intensive side: shortening the working hours and reducing the hour wage rate. They all mirror the loss of productivity, ability, and motivation to work as well as labour market institutions arrangements in the country, including common beliefs, laws, and political institutions. Therefore, we first present the age-employment profiles to groups of countries with similar patterns. We expect that the employment rates in the age groups contain most of the information on important dimensions of labour market institutions.
The differences among countries in age-employment profiles obtained a great deal of attention in the economic and sociological literature. The older part of the profile was studied by Riedel and Hofer (2012), who show the determinants of the transitions from work to retirement. On the contrary, we focus our analysis on the effects of the employment rates on earnings profiles. We start by presenting a comparison of the employment rates based on a kernel estimator for one-year age groups from EU-SILC
groups for the year 2008, as LFS is the source for official employment rate reporting (see Figure 1).
Figure 1. Employment rates in European countries based on different definitions from EU-SILC and EU-LFS data
0 .5 1 0 .5 1 0 .5 1 0 .5 1 0 .5 1 0 .5 1 0 .5 1 15 25 35 45 55 65 75 15 25 35 45 55 65 75 15 25 35 45 55 65 75 15 25 35 45 55 65 75 AT BE BG CY CZ DE DK EE ES FI FR GR HU IE IS IT LT LU LV NL NO PL PT RO SE SI SK UK
EU-SILC - labour income LFS EU-SILC - declared state
e m p lo y m e n t ra te age
Source: own calculation based on EU-SILC 2006-2009 and EU-LFS 2008.
Notes: The LFS employment rate for every 5-year age group is presented for the mean age of the group (e. g. 23) and the points connected. For EU-SILC, all employment rates for a single cohort are calculated using a kernel estimator.
The general pattern of employment rates across age groups is the following. It starts with low levels of around 20% for the 15-19 age group and grows to about 80% for 25-55, only to drop below 20% at about 65 years old. Despite the differences among datasets, it seems that the EU-SILC shows very similar employment patterns to the LFS, even though there are some differences in the definition of employment. LFS define an employed person as someone who worked in a paid job for at least 1 hour in the week prior to the survey. On the contrary, based on EU-SILC, we define an employed person as someone whose main declared state for at least six months last year was employment or someone who earned anything from employment in the previous year. The differences in definitions manifest themselves in employment rates in age groups, but general differences among countries remain similar. EU-SILC seems to lower the employment rates for people below 30 in Austria, Germany, Denmark and to move down the entire profile for Ireland, Poland and United Kingdom, especially when it is based on earnings. It indicates a larger share of people working only for part of the year than in other countries. For some countries, the LFS and labour earnings employment rates are more similar (UK, Iceland), but generally the EU-SILC employment rates are more similar to each other than to the LFS one. It indicates that the differences might come from differences between the surveys and taking LFS from only 2008, whereas EU-SILC is taken from 2003-2008.
There are some interesting outliers in the employment rates with relation to the average ones. In Denmark, Norway, Sweden, Iceland and the United Kingdom, the whole employment profile lies over the mean for all countries. Despite their institutional differences, these countries seem to be the best examples of effective activation policies, especially among people 45+. On the other side of the spectrum are countries where the generally low level of employment is magnified in older age groups, such as Poland or Hungary. They are characterized by very low levels of effective retirement age, especially among women.
employment rate for all countries. 0 .5 1 0 .5 1 0 .5 1 0 .5 1 0 .5 1 0 .5 1 0 .5 1 0 .5 1 0 .5 1 15 25 35 45 55 65 75 15 25 35 45 55 65 75 15 25 35 45 55 65 75 15 25 35 45 55 65 75
High-short:, AT High-short:, BG High-short:, CZ High-short:, FR
High-short:, SK
Low-long:, CY Low-long:, ES Low-long:, GR Low-long:, IE
Low-long:, LT Low-long:, PT Low-long:, RO
Low-short:, BE Low-short:, HU Low-short:, IT Low-short:, LU
Low-short:, PL Low-short:, SI
High-long:, DE High-long:, DK High-long:, EE High-long:, FI
High-long:, IS High-long:, LV High-long:, NL High-long:, NO
High-long:, SE High-long:, UK
ER for specific country Mean ER for all countries
e m p lo y m e n t ra te age
Source: own calculation, EU-SILC 2006-2009.
Notes: EU-SILC employment rate definition - at least 6 months in employment.
To sum up the analysis of employment rates, we conducted a cluster analysis based on the LFS employment rates of 50+ year old, which creates a framework for further analysis. With the use of LFS employment rates for 5-year age groups from 50 years old, four groups of countries can be distinguished. The clusters of countries are best characterized in two dimensions: the employment rate at 51-55 years and the average length of employment. The first group (Austria, France, Czech Republic, Slovakia and Bulgaria) is called “high-short” because it contains countries with high employment rates of 50 year olds though not necessarily throughout the whole prime age, but the employment rate falls rapidly with age afterwards. On the contrary, in the second group, entitled “low-long” (Ireland, Cyprus, Portugal, Spain, Greece, Lithuania, Romania), employment is not so high at the prime age, but it remains quite high after age 50. Countries with the weakest labour market are named “low-short” (Belgium, Luxemburg, Italy, Hungary, Slovenia, Poland) as they have low employment rates which drop quickly after age 50. The final group of countries with the healthiest labour markets is characterized by high employment rates at all ages and is named “high-long” (Norway, Sweden, Finland, Netherlands, Denmark, Germany, Latvia, Estonia, Iceland, United Kingdom – see Figure 3). We will stick to these clusters in further analysis because they are more informative in the context of age-earnings than the traditional institutional classifications such as North, Central-East, South, Continental or Liberal (e.g. Ebbinghaus and Whiteside 2012).
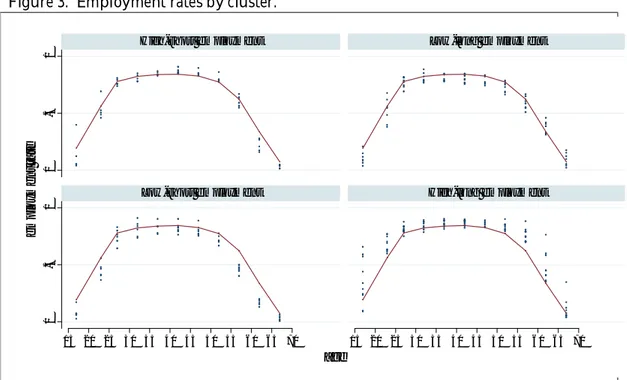
Figure 3. Employment rates by cluster.
0 .5 1 0 .5 1 15 20 25 30 35 40 45 50 55 60 65 70 15 20 25 30 35 40 45 50 55 60 65 70
High-short employment Low-long employment
Low-short employment High-long employment
e m p lo y m e n t ra te age
Remarks: Dot stands for particular countries, line represents unweighted mean of employment rates for all countries.
There is some controversial classification among the countries in the clusters. In Belgium and Slovenia, the employment rates at the prime age are similar to the average of all countries, but as they start to drop before 50, we classify these countries in the Low-short group and not in the High-short group. In Romania, employment rates start to go down before fifty but remain high after 65 and therefore it is classified as low-long and not low-short. To be sure that the final results are not attributed to these decisions, we check if these cases affect the final results.
Differences among countries in the age-employment profiles for people below 45 are commonly attributed to the variety of labour market institutions and cultural differences for cohorts older than 50 are mostly ascribed to the construction of the pension system. The younger people are entitled to retirement benefits, the earlier they leave the labour market and the employment rate drops (Blöndal and Scarpetta 1999).
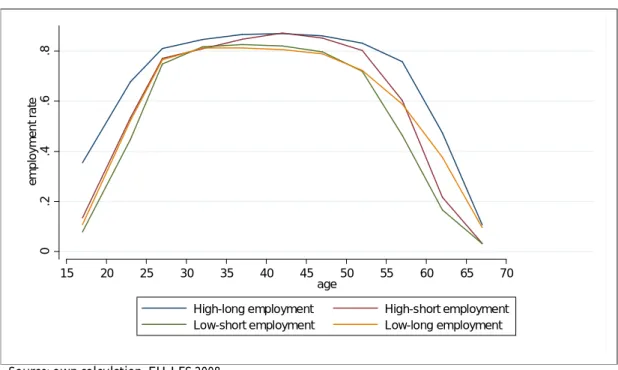
Figure 4. Mean employment rates in clusters by age group.
Source: own calculation, EU-LFS 2008.
Remarks: the profiles for a cluster obtained by averaging the profile for all countries from given cluster.
Age-hourly earnings profiles
The employment rates at older ages and working time affect average wages. If older people work part-time, combining retirement and social benefits with labour income, one can expect a loss in monthly wages. As this phenomenon is quite well documented (O’Reilly and Fagan 1998), we focus our attention strictly on hourly wages which
0 .2 .4 .6 .8 e m p lo y m e n t ra te 15 20 25 30 35 40 45 50 55 60 65 70 age
High-long employment High-short employment Low-short employment Low-long employment
should not be affected by working time. It is however susceptible to be influenced by the average across the population. Leaving employment is not a purely random process. On the one hand, the least productive persons may leave first, turning the average wage to racket. On the other hand, low-paid workers may have the lowest retirement benefits and therefore may be forced to work longer than better paid persons with higher benefits and savings. Finally, various abilities depreciate at different rates which might also make the labour-retirement transition not random. To control these factors, we show not only average age-wage profiles, but we also run a semi-parametric regression to control for such characteristics as education, occupation and sex.
The average hourly earnings-age profiles are quite similar among countries. They double to triple from 15 to 35 years of age, partly due to higher educated people entering the labour market after age of 20, then they become flat with a slight downturn after 50 or 60 years. It is hard to say much about earnings after age 70, as for most countries, due to the drop in the sample size (employment rates are less than 10%) and growth in variance, the standard error becomes too big to draw any conclusions.
There are some countries in which earning patterns behave strangely. In Luxemburg, the profile is much steeper than average with the top at around 60. It may however reflect the true behaviour of earnings, as the Luxemburg economy structure differs vastly from that of other countries; it is just one big city with a huge financial sector and many affluent residents. In Romania it is quite the opposite; the profile plunges after 60 with quite high employment rates after that time indicating many elderly people working. We attribute this effect to low retirements benefits and a huge and low productive agricultural sector in which elderly workers are concentrated (Roman and Roman 2002, OECD 2008). It is hard to find an explanation for the top at 25 years and then the steep drop in earnings afterwards in Latvia and Estonia (see Figure 5). It could be that these are small post-communist countries with a high premium for people with qualifications that are more adequate to the technology-based market economy, than for workers with qualifications better suited to the past economy. It is therefore a consequence of the interaction of age and technological progress in these countries. Taking the above points into account, we check our results by excluding the questionable countries from the sample.
Source: own calculation, EU-SILC 2004-2009. .5 1 1 .5 .5 1 1 .5 .5 1 1 .5 .5 1 1 .5 .5 1 1 .5 .5 1 1 .5 .5 1 1 .5 .5 1 1 .5 .5 1 1 .5 20 30 40 50 60 70 80 20 30 40 50 60 70 80 20 30 40 50 60 70 80 20 30 40 50 60 70 80
High-short, AT High-short, BG High-short, CZ High-short, FR
High-short, SK
Low-long, CY Low-long, ES Low-long, GR Low-long, IE
Low-long, LT Low-long, PT Low-long, RO
Low-short, BE Low-short, HU Low-short, IT Low-short, LU
Low-short, PL Low-short, SI
High-long, DE High-long, DK High-long, EE High-long, FI
High-long, IS High-long, LV High-long, NL High-long, NO
High-long, SE High-long, UK
HE for specific country conf. int.
Mean HE for all countries
h o u rl y e a rn in g s age
Notes: hourly earnings are normalized so that the mean hourly earnings equals 1 for every country, 95% confidence interval.
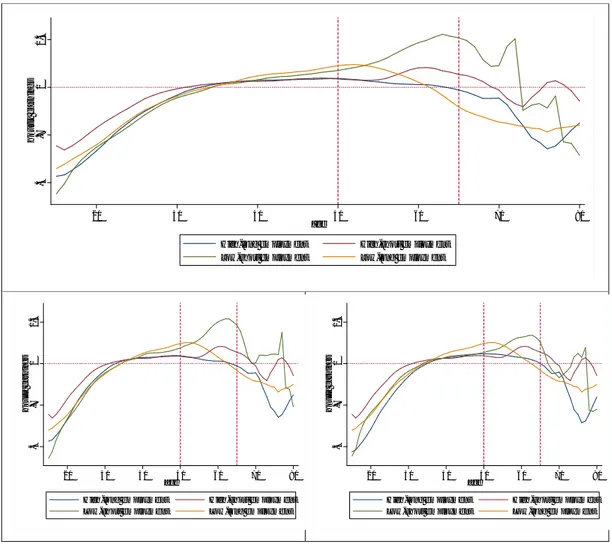
Averaging the profiles within clusters reveals the relation between employment and earnings age patterns. For the countries with the healthiest labour market (high employment rates, long employment), hourly productivity profiles are flattest, and between 35 and 67 years almost do not change. On the contrary, for all remaining clusters, there are quite interesting dynamics after 45. In low-long countries, there is no flat interval in the whole profile; the peak of average earnings comes at 50 and then drops afterwards quickly. In countries with low-short employment, the average hourly wages start to grow at about 50 years old and top at sixty and then drop sharply after 65. The profile for countries with a high-short employment pattern combines features of high-long and low-short countries. It is flat until age 55 as in high-long countries, and then it resembles the low-short countries as it grows until 60 and then drops. We attribute the dynamics of the hourly earnings at 50-65 mainly to averaging effects for the following reasons:
The drop in employment rates is the most prevailing phenomenon in that lifespan on the labour market.
A jump in wages in the late fifties does not correspond to any convincing theory of wage determination.
The individual life-cycle earnings profiles do not show any hump-shapes in this part of life (see section 3.2 for details).
The following regression results flatten the profiles, especially at that age. Sticking to averaging effects leads to the conclusion that in high-long employment countries, the transitions to retirement are evenly distributed across workers and these transitions are quite smooth. The drop in earnings around age 70 takes place due to the drop in personal productivity and because only those with very low retirement benefits or capital income remain employed. The argument for that is that the employment rate at age 70 exceeds 10 per cent only in countries with quite liberal pension systems – with either low replacement rates (Estonia, Latvia, United Kingdom) or a high effective retirement age (Romania, Portugal). Furthermore, earnings start to drop quite steeply after 70, which should, however, be treated with caution due to the small samples (see Figure 6).
In countries with high-short and low-short employment patterns, the growth in average hourly wages reflects the pattern of low-paid workers leaving the labour market prematurely. In such systems, the availability of early retirement benefits or social aid discourages lower-paid workers from working, as the replacement rate for them is high compared to higher paid workers. The average replacement rate for countries with short employment is around 53%, whereas in countries with long employment it is around 45%. Unfortunately, the OECD reports only the average replacement rate and does not report the replacement rate by age or wage-decile.5
and for long employment it is almost 65.6 Therefore we argue that the rising average
hourly earnings before age 60 are a result of acquiring the right to benefits at a younger age and higher replacement rates in these countries.
The profile for low-long countries presents a similar story. The effect of prematurely leaving employment starts earlier and the loss of average productivity after age 60 is deeper than in other countries. Although the employment rates after 65 are quite high, among those who remain in employment, lower paid workers dominate. In effect, the average hourly earnings drop below the mean before 65, the earliest among all clusters of countries.
Figure 6. Mean hourly earnings profiles for clusters: all countries included (upper plot) and excluding outliers in respect to the classification to employment clusters - Belgium, Slovenia, Romania (lower left plot) and in respect to specific productivity profiles - Estonia, Latvia, Luxemburg, Romania, Slovenia (lower right plot).
6 OECD, 2008. .4 .7 1 1 .3 h o u rl y e a rn in g s 20 30 40 50 60 70 80 age
High-long employment High-short employment Low-short employment Low-long employment
.4 .7 1 1 .3 h o u rl y e a rn in g s 20 30 40 50 60 70 80 age
High-long employment High-short employment Low-short employment Low-long employment
.4 .7 1 1 .3 h o u rl y e a rn in g s 20 30 40 50 60 70 80 age
High-long employment High-short employment Low-short employment Low-long employment
Source: own calculation, EU-SILC.
To check the results presented above, we factor out the observable characteristics of workers running semi-parametric regressions for each country for workers at age 50+. We want to differentiate between general and specific human capital. Therefore we first include the variables reflecting general human capital (sex, education, occupation) and specific aspects (experience, job change in the previous year). We present the results for every country (Figure 7) but for analytical purposes the profiles for every cluster are averaged (Figure 8).
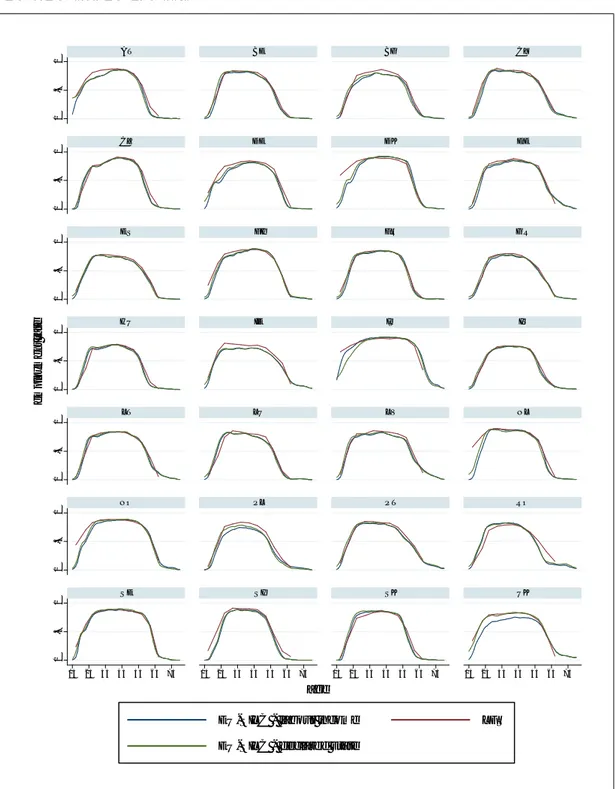
Figure 7. Hourly earnings by age and countries – semi-parametric regression results.
Source: own calculation, EU-SILC.
Notes: occupation groups gathered in four groups: highly skilled non-manual, lower skilled non-manual, skilled manual, elementary occupation (Whelan, Maitre and Nolan, 2011). Including experience and job
.5 1 1 .5 .5 1 1 .5 .5 1 1 .5 .5 1 1 .5 .5 1 1 .5 .5 1 1 .5 .5 1 1 .5 .5 1 1 .5 .5 1 1 .5 50 55 60 65 70 75 80 50 55 60 65 70 75 80 50 55 60 65 70 75 80 50 55 60 65 70 75 80
High-short, AT High-short, BG High-short, CZ High-short, FR
High-short, SK
Low-long, CY Low-long, ES Low-long, GR Low-long, IE
Low-long, LT Low-long, PT Low-long, RO
Low-short, BE Low-short, HU Low-short, IT Low-short, LU
Low-short, PL Low-short, SI
High-long, DE High-long, DK High-long, EE High-long, FI
High-long, IS High-long, LV High-long, NL High-long, NO
High-long, SE High-long, UK
conf. int. factoring out: sex, education, occupation raw factoring out also: experience, job change
h o u rl y e a rn in g s age
change was not possible for some countries due to data quality. Confidence interval for regression with sex, education and occupation.
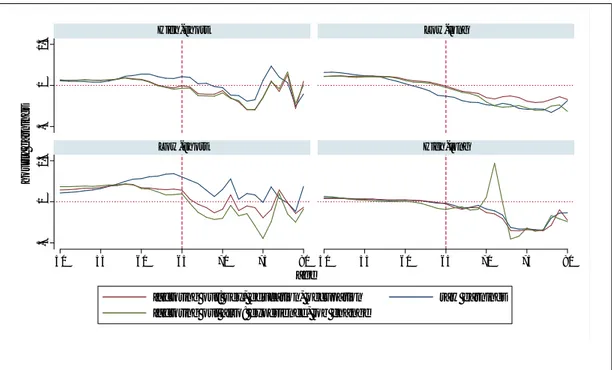
The results for specific clusters differ greatly. For high-long countries, the profiles do not change when the characteristics are taken into account whereas for all other clusters, the results differ significantly. The effect of factoring out sex, education and occupation generally influences the patterns much more than further including general experience and recent job change. Taking into account all characteristics flattens the earning profiles in all clusters. In high-short and low-short countries, the hump-shape noticed after 50 years almost disappears and the resulting profiles become much more alike among clusters. In low-short employment countries, there still seems to be a more important drop in hourly earnings after ending 65 years.
Romania delivers a great example of the strength of averaging effects. Quite a high level of employment after age 60 leads to a drop in average earnings by about 70%, but when taking into account sex, education and occupation, this drop is reduced to just 20%. This confirms the previous result, that a high employment rate for older persons in Romania can be attributed to low-qualified persons leaving employment due to the lack of retirement benefits.
Figure 8. The effects of factoring out general and specific human capital for hourly earnings-age profiles by clusters.
Source: own calculation, EU-SILC.
.5 1 1 .5 .5 1 1 .5 50 55 60 65 70 75 80 50 55 60 65 70 75 80 High-short Low-long Low-short High-long
factoring out: sex, education, occupation raw earnings factoring out also: experience, job change
h o u rl y e a rn in g s age
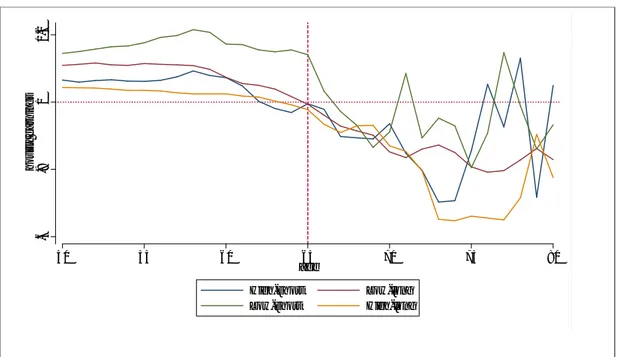
Figure 9. Hourly earnings after factoring out sex, education and occupation averaged for clusters, age group 50+.
Source: own calculation, EU-SILC.
Conclusions
The comparison of only employment rates among countries shows that there are huge differences in labour market participation at all ages and there is lot of space for increasing the employment levels in some countries, especially at older ages. There are also huge drops in employment rates when people become eligible for retirement benefits. As the literature shows, the quick decline in the employment rate does not correspond with a loss of ability to perform work-related tasks. Therefore the retirement age seems to artificially shorten the working life of individuals in all countries, but these phenomena do vary greatly among countries.
The decline in the hourly earnings of older persons is smallest in countries with the highest employment rates in all age groups and it rises in importance after 70 years of age. Most of the dynamics of the average wage can be attributed to changes in the labour force structure and not to personal productivity changes. Combining evidence for quite a large group of countries (28) enables us to observe that countries with higher employments rates after 60 do not show any quicker decline in wages than countries with a lower employment rate of older persons. This would be the case if the personal productivity dropped quickly afterwards. Therefore we can conclude that the falling employment rates at the age when one qualifies for retirement benefits can hardly be attributed to a drop in personal productivity or earning ability.
.6 .8 1 1 .2 h o u rl y e a rn in g s 50 55 60 65 70 75 80 age High-short Low-long Low-short High-long
The intellectual ability to perform more complicated and productive tasks depreciates slower with age than fitness, which is mostly needed in lower-paid jobs. The expected consequence of this would be that people who are engaged in non-manual tasks would work longer, thus driving the earnings profile up. We find evidence of average earnings rising before 65 only in countries were employment rates after 50 are low and flat earning profiles in countries with high employment rates. In the 65-75 age group, we observe a decline in average hourly earnings in almost all countries. The last result remains true after factoring out personal and job-related characteristics which seem to reflect not only averaging effects but also the loss of productivity at that age. However, losses in earnings are not bigger that 2-3 percent a year after age 65. Therefore, we find evidence that it is lower-paid individuals who are leaving the labour market prematurely in countries with low employment rates and some signals of actual loss of hourly earnings after age 65. Most changes in average wages before age 65 should be attributed to institutional differences among European countries and not to individual life-cycle productivity profiles.
We tried to deliver preliminary answers to the question: to what extent do labour market institutions and pension systems affect the average and individual life-cycle earnings profiles? We find evidence that younger eligibility for retirement and higher replacement rates make lower-paid individuals exit labour market prematurely, i.e. before they lose the ability to perform work-related tasks. This conclusion still needs to be tested with the use of longitudal data.
Additionally, we found that the age structure of the work force strongly affects the dynamics of average earnings and therefore the comparison of dynamics of wages ignoring the age structure of the population might lead to confusing results. As we used cross section data, we could not take into account the cohort effects, so this issue remains open for further research.
Introduction
In the previous section, the results based on hourly earnings-age profiles with the use of cross-section dataset were discussed. We now turn to a retrospective survey in order to check the validity of the results obtained for individual careers. Moreover, we enrich the analysis by including more dimensions of human capital accumulation and depreciation. Firstly, the SHARELIFE retrospective survey and imputing methods are carefully discussed. Then, we present the results on the frequency of job changes and work experience during a lifetime. We find a bipolar pattern when looking at the working time in the population. Thereafter, the age-employment and age-earning patterns in all countries are presented. To explain the differences among countries, additional characteristics such as cohorts, gender, education and occupation are applied to the analysis. We identify the patterns of the occupational flows in subsequent stages of life.
Sample description
The Survey of Health, Ageing and Retirement in Europe (SHARE) is the only recent study which allows for the examination of the paths of life of the 50+ population living across European countries. The first wave of the survey was conducted in 2004 in twelve countries (Austria, Belgium, Denmark, France, Germany, Greece, Israel, Italy, Netherlands, Spain, Sweden, Switzerland) for more than 30,000 respondents. In the second wave (2006), three new countries joined the project: Czech Republic, Poland and Ireland, increasing the sample size to nearly 35,000. Wave 3 took place in 2008 and covered the respondents who participated in waves 1 and/or 2. The fourth and final wave was held in 2011 and included several new countries: Estonia, Hungary, Portugal and Slovenia, again increasing the sample size to almost 60,000 observations. The SHARE questionnaire contains comprehensive questions about demographic characteristics, relations with children, physical and mental health, employment, pensions, income, consumption and other activities of people aged 50 and older. SHARE interviewers must reach every respondent who participated in even one of the previous waves, thereby enabling a longitudinal analysis.
In our analysis we use data from the third wave of the SHARE survey run in 2008, which focuses on people’s life history. A retrospective structure of the questionnaire allows us to recreate individual job and wage paths. Everyone who had ever worked was asked about the characteristics of each job during his/her work career. From the work history section of SHARELIFE, we obtained information about the years each job started and ended, the first monthly (after tax) wage, the last monthly (after tax) wage in the main job, and current earnings if still working. Moreover, individuals from SHARELIFE also took part in waves 1 and/or 2 and answered questions about their current earnings.
We investigate the life-cycle earnings for 11 countries: Austria, Belgium, Denmark, France, Germany, Greece, Italy, Netherlands, Spain, Sweden and Switzerland. Poland
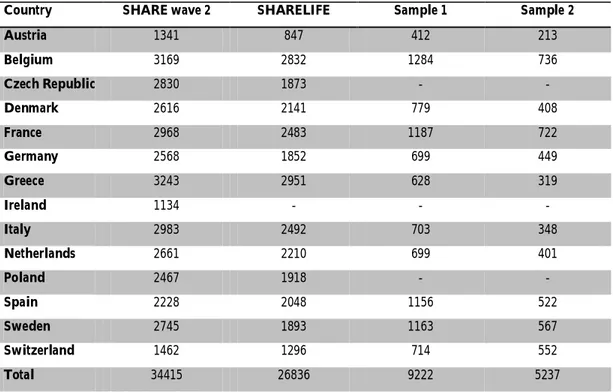
and the Czech Republic are excluded due to data quality issues. In Poland, it is hardly possible to determine whether earnings were in the new or old Polish zlotys (the devaluation took place in 1995 and there were some periods of high inflation). All means taken to cope with these problems did not provide the minimum quality of data needed. In the Czech Republic, median earnings between 1987 and 1988 increased from 3 thousand to 13 thousand and remain at that level and there is no easy way to eliminate the effect of this change on final results. The sample was restricted to individuals who reported earnings in the national currency, which led us to 9222 observations. The structure of the sample is presented in Table 2.
Table 2. Sample size in SHARE wave 2, SHARELIFE and our samples by country.
Country SHARE wave 2 SHARELIFE Sample 1 Sample 2
Austria 1341 847 412 213 Belgium 3169 2832 1284 736 Czech Republic 2830 1873 - - Denmark 2616 2141 779 408 France 2968 2483 1187 722 Germany 2568 1852 699 449 Greece 3243 2951 628 319 Ireland 1134 - - - Italy 2983 2492 703 348 Netherlands 2661 2210 699 401 Poland 2467 1918 - - Spain 2228 2048 1156 522 Sweden 2745 1893 1163 567 Switzerland 1462 1296 714 552 Total 34415 26836 9222 5237
Source: own calculation based on SHARE.
Remarks: Sample 1 - whole sample: everyone who had ever worked and reported earnings in national currency, Sample 2 - only-long-work-experience sample: respondents who gained a minimum of 30 years of work experience between ages 25 and 65.
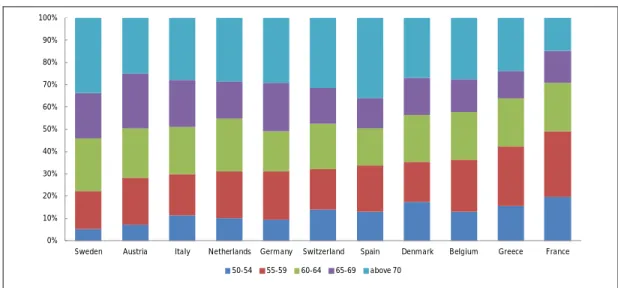
In all countries except for France, more than 60% of respondents are above 60 years old (see Figure 10). Employment rates for persons aged 60 to 64 are approximately two times lower than in 55-59 age group – 34% vs. 63% (LFS, 2011). Therefore, for most respondents, their whole work history is available.
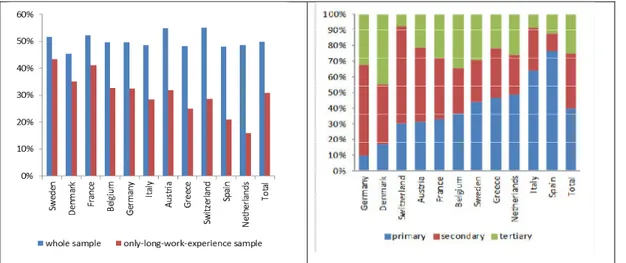
Restricting the sample to respondents with work experience of more than 30 years results in a decrease in the share of women in all countries. The largest decrease can be observed in the Netherlands, Spain and Switzerland. Women in Europe, especially in Southern countries, tend to leave the labour market more often and for longer periods mainly due to raising children (see Figure 11). In the Netherlands and Switzerland, the
of cases, while in the other countries of interest this is true in about 40% of cases (Lyberaki et al. 2011).
Figure 10. Sample structure by age of respondents in 2008.
Source: own calculation based on SHARELIFE.
Countries differ strongly in terms of education attainment of people over 50 years of age, which might have an impact on the earnings profile, but it is much less linked with work experience than gender. Eliminating respondents with short work experience does not change the sample structure in terms of education. Unfortunately, the educational structure of the final sample is not representative in some countries. In Switzerland, the share of people with tertiary education is about three times lower than in the Eurostat database statistics (30% vs. 8%, 2008), as opposed to in Denmark, where that share in our sample is about twice as large (28% vs. 45%, 2008). Among other countries, the structure of the sample by education is close to Eurostat data (see Figure 12).
Figure 11. Percent of females in the samples.
Figure 12. Educational structure of the sample 0% 10% 20% 30% 40% 50% 60% 70% 80% 90% 100%
Sweden Austria Italy Netherlands Germany Switzerland Spain Denmark Belgium Greece France 50-54 55-59 60-64 65-69 above 70
Source: own calculation based on SHARELIFE.
Table 3. Number of jobs by gender, education and birth year.
Whole sample Country Total
Gender Education Birth year
males female test primary secondary tertiary test 1949-58 1939-48 1929-38 before 1929 test Austria 2,53 2,73 2,37 *** 2,63 2,55 2,33 * 2,56 2,93 2,56 2,27 *** Belgium 2,20 2,48 1,91 2,33 2,16 2,09 2,30 2,61 2,30 2,12 *** Switzerland 3,44 3,70 3,22 3,40 3,57 2,64 3,73 3,93 3,82 2,63 Germany 2,79 2,87 2,70 *** 2,79 2,76 2,80 * 2,80 2,80 2,76 2,83 ** Denmark 3,81 4,28 3,25 3,96 4,01 3,64 *** 3,84 4,28 4,00 3,62 ** Greece 1,37 1,43 1,30 1,34 1,44 1,30 * 1,42 1,40 1,52 1,33 *** Spain 2,15 2,55 1,73 2,22 2,22 1,87 * 2,39 2,54 2,55 1,84 France 2,49 2,94 2,08 2,53 2,44 2,42 * 2,65 2,78 2,56 2,54 Italy 2,16 2,50 1,80 2,24 2,04 2,06 ** 2,42 2,69 2,11 2,14 * Netherlands 2,95 3,16 2,72 2,80 3,07 3,06 ** 3,17 3,13 3,24 3,14 Sweden 3,39 3,69 3,10 3,51 3,38 3,20 * 3,39 3,61 3,36 3,08 ** Total 2,65 2,92 2,38 2,55 2,77 2,64 2,82 2,89 2,91 2,66
Only-long-work experience sample
Country Total
Gender Education Birth year
males female test primary secondary tertiary test 1949-58 1939-48 1929-38 before 1929 test Austria 2,56 2,73 2,19 *** 2,93 2,56 2,27 * 2,37 2,57 2,73 2,64 *** Belgium 2,30 2,49 1,91 2,61 2,30 2,12 2,25 2,17 2,58 2,52 ** Switzerland 3,73 3,67 3,87 * 3,93 3,82 2,63 3,71 3,90 3,77 2,98 *** Germany 2,80 2,82 2,75 * 2,80 2,76 2,83 *** 2,58 3,03 2,66 2,53 * Denmark 3,84 4,27 3,06 4,28 4,00 3,62 * 3,86 3,89 3,89 3,31 *** Greece 1,42 1,48 1,25 1,40 1,52 1,33 *** 1,51 1,48 1,27 1,23 *** Spain 2,39 2,47 2,10 *** 2,54 2,55 1,84 2,47 2,49 2,39 1,90 *** France 2,65 3,04 2,10 2,78 2,56 2,54 *** 2,78 2,68 2,28 1,81 * Italy 2,42 2,56 2,08 2,69 2,11 2,14 2,53 2,43 2,37 2,17 *** Netherlands 3,17 3,13 3,43 * 3,13 3,24 3,14 *** 3,10 3,28 3,10 2,98 *** Sweden 3,39 3,66 3,05 3,61 3,36 3,08 * 3,26 3,52 3,34 3,20 *** Total 2,82 2,94 2,56 2,89 2,91 2,66 2,75 2,93 2,80 2,61 *
Source: own calculation based on SHARELIFE.
Remarks: to test statistically significant difference between samples we use the following as variables: (1) with two samples, the Wilcoxon rank-sum test and (2) with more than two samples, the Kruskal-Wallis equality-of-populations rank test. ***, ** and * indicates respectively significance at level 1, 5 and 10%.
Recreating the life-earnings profiles based on information about a few moments of life from a retrospective survey entails several methodological challenges. The growth rate of wages is an outcome of three factors: individual lifecycle dynamics of income, economic growth, and inflation. Firstly, some currencies were liquidated or denominated and the money lost its value due to inflation. Secondly, there are various observations of earnings for individuals at varying ages. Furthermore, the dynamics of average wage influences the profile and the data on average wage are hardly available for most countries before 1960. Finally, only the data on net wages are available in SHARE, whereas during 3-4 decades of working life, the tax wedge changes hugely in some countries and most average wage dynamics from international databases include only gross wage data. In this section we present the ways we cope with these problems.
A person with median work experience in our sample worked two jobs during his or her life and reported earnings in three moments of his working life, mostly at the beginning of each job, at the end of the main job, the end of his or her last job or current earnings (see Table 3). This was the raw information which helped us recreate the working life earnings profile for every worker. Depending on the country, we have an average of 2 to 5 sources of information on earnings per individual respondent, according to the characteristics of work in each country (see Figure 14), especially changing jobs.
The socio-demographic structure of the sample has little impact on the number of jobs during a person’s life time and hence on the amount of information about earnings. Variation within education groups and year of birth in most countries is not statistically significant (see Table 3). The opposite is true of gender, which strongly differentiates the number of jobs during one’s lifetimes. Females take up new jobs less often, especially in Spain, France and Italy. In Southern Europe, family ties are strong and family policy does not have much impact.
Table 4. Comparison of inflation and growth rate of SHARELIFE nominal earnings (%).
Country
Average annual rate of inflation
Average annual growth rate of SHARELIFE nominal earnings after
imputation 1950-1960 1960-1970 1970-1980 1990-2000 2000-2008 1970-2008 1950-1960 1960-1970 1970-1980 1990-2000 2000-2008 1970-2008 Sweden 3 3 5 2 1 3 7 9 6 2 1 4 Denmark 2 2 5 2 2 3 9 9 7 2 1 4 Austria 4 3 6 2 2 4 10 11 6 4 1 4 France 8 4 7 2 2 4 7 5 10 2 -2 5 Belgium 3 3 7 2 2 4 8 6 6 3 3 4 Germany 6 4 9 2 2 5 5 5 4 3 3 4 Switzerland 18 7 9 2 2 5 6 7 5 2 2 3 Netherlands 5 4 8 2 2 5 8 10 7 3 1 4 Spain 4 3 12 3 2 7 16 12 11 5 2 7 Italy 13 6 14 4 3 8 10 11 10 6 5 7 Greece 2 2 13 8 3 11 7 8 9 5 0 6