Discovery of new risk loci for IgA nephropathy implicates genes
involved in immunity against intestinal pathogens
A full list of authors and affiliations appears at the end of the article.
Abstract
We performed a genome-wide association study (GWAS) of IgA nephropathy (IgAN), the most common form of glomerulonephritis, with discovery and follow-up in 20,612 individuals of European and East Asian ancestry. We identified six novel genome-wide significant associations, four in ITGAM-ITGAX, VAV3 and CARD9 and two new independent signals at HLA-DQB1 and DEFA. We replicated the nine previously reported signals, including known SNPs in the HLA-DQB1 and DEFA loci. The cumulative burden of risk alleles is strongly associated with age at disease onset. Most loci are either directly associated with risk of inflammatory bowel disease (IBD) or maintenance of the intestinal epithelial barrier and response to mucosal pathogens. The geo-spatial distribution of risk alleles is highly suggestive of multi-locus adaptation and the genetic risk correlates strongly with variation in local pathogens, particularly helminth diversity, suggesting a possible role for host-intestinal pathogen interactions in shaping the genetic landscape of IgAN.
IgA nephropathy (IgAN) is the most common form of primary glomerulonephritis and the
leading cause of end-stage kidney failure in China1. The diagnosis is made by kidney
biopsy, which shows predominant deposition of IgA-containing immune complexes in the glomerular mesangium, leading to glomerulonephritis, glomerular sclerosis, and progressive
Users may view, print, copy, and download text and data-mine the content in such documents, for the purposes of academic research,
subject always to the full Conditions of use:http://www.nature.com/authors/editorial_policies/license.html#terms
Corresponding Authors: Ali Gharavi, MD, Department of Medicine, Division of Nephrology, Columbia University, 1150 St Nicholas Ave, Russ Berrie Pavilion #413, New York, NY 10032, USA, Tel: 212-851-5556, Fax: 212-851-5461, [email protected]. Richard P. Lifton, MD, PhD, Department of Genetics, Howard Hughes Medical Institute, Yale University School of Medicine, 300 Cedar Street, TAC S-341D, New Haven, CT 06520, USA, Tel: 203-737-4420, Fax: 203-785-7560, [email protected].
Author contributions:
K.K., R.P.L., and A.G.G. conceptualized and designed the study; S.S.C., F.S., H.J.S., G.A., C.I., B.F.V., N.D., L.D.V., C.B., E.S., F.E.B., A.A., S.S., M.R., A. Amore, L.P., R.C., M.S., P.R., R.M., G.M.G., G.C., M.B., F.L., L.A., M.D., M.M., A.M., G.F., E.B., G.B., C.P., R.M., C.M., D.D.L, D.S., A.P., R.P., S.F., S.C., M.G., M. Gigante, L.G., P.Z., D.M., V.T., F.E., T.R., J.F., T.K., J.N., K.M., L.P., M.Z., M.M.W., M.R.B., K.P., D.G., J.B., L.T., F.B., G. Canaud., A.B., M.M., U.P., H.S., S.G., I.N., Y.C., J.X., P.H., N.C., H.Z., R.J.W., J.N., B.A.J., J.F., B.S., and D.C recruited study participants, contributed DNA samples, and performed clinical characterization of subjects; D.G., J.B., J.F., A.B., B.S., and D.C contributed genotype data; Y.L., S.P., S.S., C.F., Y.C., J.X., and P.H. prepared DNA samples; Y.L., S.P., S.S., C.F., Y.C., J.X., and P.H. assisted in genotyping, sequencing and wet lab experiments; K.K. and Y.L. managed clinical and genetic data; K.K., M.V., D.F., S.L., and A.G.G. analyzed data; K.K., R.P.L., and A.G.G. wrote the manuscript.
Competing Financial Interests:
The authors declare no competing financial interests.
Accession Codes:
EGAS00000000031, phs000431.v1, phs000431.v2
URLs:
HHS Public Access
Author manuscript
Nat Genet. Author manuscript; available in PMC 2015 May 01.
Published in final edited form as:
Nat Genet. 2014 November ; 46(11): 1187–1196. doi:10.1038/ng.3118.
Author Manuscript
Author Manuscript
Author Manuscript
loss of kidney function. The etiology of IgAN is poorly understood and the genetic architecture is complex. The disease is most prevalent in East Asians, less frequent in Europeans, and relatively rare in individuals of African ancestry. For example, Asian-Americans have a 4-fold higher incidence of end-stage renal disease due to IgAN compared
to European-Americans, and nearly 7-fold higher compared to African-Americans2. IgAN
affects individuals of all age groups, with a peak incidence in the 2nd or 3rd decade of life;
the factors determining age of onset are unknown.
To date, there have been three GWAS for IgAN3–5. The results of these studies demonstrate
a strong contribution of the major histocompatibility (MHC) locus to disease risk. The two largest studies, both based on Asian discovery cohorts, detected four additional non-HLA loci, including chromosome 1q32, comprising a common deletion of the complement factor H related CFHR3 and CFHR1 genes (CFHR3,1-delta); 8p23 comprising the α-defensin (DEFA) gene cluster; 17p13 (including TNFSF13), and 22q12 (including HORMAD2 and
several other genes)3,4. Cumulatively, these GWAS loci explain about 5% of the total
disease risk. Additionally, variation in risk allele frequency explains a substantial fraction of the observed ethnic variation in disease prevalence, with risk alleles having substantially
higher frequencies in Asians compared to Europeans3. These findings raise the possibility
that additional disease loci might have been missed owing to fixation of risk alleles in Asian populations. To identify new disease loci, we performed a GWAS twice the size of the prior largest study and have analyzed a discovery cohort based predominantly on European subjects.
RESULTS
Study Design
In stage I (discovery) we performed a genome-wide analysis in 2,747 biopsy-confirmed cases and 3,952 controls, including three new cohorts comprising 1,553 cases and 3,050 controls of European ancestry and the previously published Han Chinese discovery cohort of 1,194 cases and 902 controls (Table 1, Supplementary Tables 1–3, Supplementary Note). For each cohort, we performed principal component analyses to assure adequate ancestry matching between cases and controls (Supplementary Figure 1). All individual samples were imputed to a common set of >1 million SNPs (Supplementary Table 4) using ancestry-matched HapMap-3 reference panels (Supplementary Figure 2). Primary association testing was performed after accounting for imputation uncertainty and significant principal
components of ancestry. We detected minimal effect of population stratification within each cohort (λ 1.01–1.06, Supplementary Figure 3). The association results from individual cohorts were combined using genome-wide fixed effects meta-analysis. We identified multiple suggestive signals and several distinct peaks exceeding genome-wide significance in the joint analysis of the discovery cohorts (Supplementary Figure 4). Top signals, defined
by P < 5 × 10⁻⁵, were genotyped in additional 4,911 cases and 9,002 controls (stage II),
followed by meta-analysis to identify genome-wide significant signals across the combined cohorts of 20,612 individuals. This two-stage design was adequately powered to detect ORs as small as 1.15–1.25 (Supplementary Table 1).
Author Manuscript
Author Manuscript
Author Manuscript
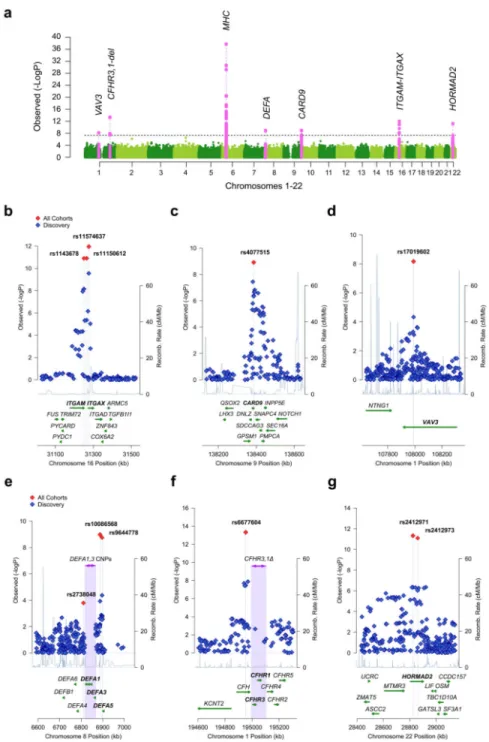
In the combined analysis, we identified six new genome-wide significant signals (Figure 1, Supplementary Figure 5, Table 2, and Supplementary Tables 5, 6, and 7). These included four signals in three novel loci, chr.1p13 (VAV3 locus), chr.9q34 (CARD9 locus), and chr. 16p11 (ITGAM-ITGAX locus), and two new independent signals within the previously known HLA-DQ/DR and DEFA regions. We also confirmed associations at all nine previously identified loci at chr.6p21 (HLA-DQ/DR, TAP1/PSMB8, and HLA-DP loci), chr. 1q32 (CFHR3,1-delta locus), chr.8p23 (DEFA locus), chr.17p13 (TNFSF13 locus), and chr. 22q12 (HORMAD2 locus).
New IgAN susceptibility loci
Chr.16p11: ITGAM-ITGAX locus—This locus represented the strongest novel non-HLA signal (Figure 1b). The top signal, rs11574637, is an intronic SNP in ITGAX encoding leukocyte-specific integrin αX, a component of complement receptor 4 (CR4) involved in leukocyte cell adhesion, migration, and phagocytosis of complement-coated particles by
monocytes and macrophages6. This SNP was genome-wide significant in the discovery
phase (OR 1.47, P = 2.8 × 10⁻¹⁰) and in the combined meta-analysis (OR 1.32, P = 8.1 ×
10−13). It is noteworthy that the risk allele (T) at this locus represents an ancestral (chimp)
allele with frequency of 0.82 in Europeans and 1.0 in Asians, explaining why this strong signal was not detected in prior GWAS based on Asian discovery cohorts. Prior studies have
shown that rs11574637 is associated with risk of systemic lupus erythematosus (SLE)7.
Interestingly, the IgAN risk allele (T) is protective against SLE, suggesting complex interplay between these two disorders causing nephritis.
In addition, we detected another genome-wide significant intergenic SNP in this region,
rs11150612 (P = 1.3 × 10⁻¹¹), which is poorly correlated with rs11574637 (r2 = 0 for Asians
and r2 = 0.12 in Europeans). Stratified conditional analysis strongly suggests that
rs11150612 represents an independent signal and will require confirmation in larger
European cohorts (conditioned OR 1.13, P = 1.6 × 10⁻⁶, Supplementary Table 8). The risk
allele at rs11150612 is a derived (non-chimp) allele with frequency of 0.36 in Europeans and 0.75 in Asians. This allele is also associated with increased expression of ITGAX in
peripheral blood cells8 (Supplementary Table 9). Moreover, examination of 1000 Genomes
data revealed that this risk allele is in strong LD with an ITGAX missense variant predicted
to be damaging (rs2230429, P517R, r2=0.97, but not typed in our study, Supplementary
Table 10).
Chr.9q34: CARD9 locus—We observed a genome-wide significant signal at rs4077515
(OR 1.16, P = 1.2 × 10⁻⁹, Figure 1c), which was supported by both Asian and European
cohorts (Supplementary Table 6). The rs4077515-T risk allele results in p.Ser12Asn substitution in CARD9 (encoding Caspase recruitment domain-containing protein 9, an adapter protein that promotes activation of NF-κB in macrophages). This substitution is
associated with higher expression of CARD9 in monocytes9, lymphoblastoid cell lines10,
and peripheral blood cells8 (Supplementary Table 9). This same allele also confers increased
risk of ulcerative colitis and Crohn’s disease11,12 (Supplementary Table 11).
Author Manuscript
Author Manuscript
Author Manuscript
Chr.1p13: VAV3 locus—The top signal, rs17019602 (Figure 1d) is an intronic SNP in VAV3, a gene encoding a guanine nucleotide exchange factor for Rho GTPases that is
important for B- and T-lymphocyte development and antigen presentation13,14 (OR 1.17, P
= 6.8 × 10⁻⁹). Both Asian and European cohorts support this association (Supplementary
Table 6). A common variant in VAV3 has previously been associated with hypothyroidism,
likely secondary to autoimmune etiology15. However, the hypothyroidism risk allele shows
no linkage disequilibrium with rs17019602 (r2 = 0), indicating that the IgAN signal
represents a distinct allele at this locus.
Identification of novel and ethnicity-specific signals at known loci
Chr.6p21: Novel signal at HLA-DQ/DR locus—The strongest signal in the present GWAS represents a novel association within the HLA-DQ/DR locus (rs7763262, OR 1.41, P
= 1.8 × 10−38; Supplementary Figure 6). This signal persisted after conditioning on the
previously described SNPs in the region (conditioned OR 1.31, P = 6.2 × 10⁻¹⁴,
Supplementary Table 12); the three previously reported SNPs remained significant after conditioning on rs7763262. Notably, we detect a stronger effect of rs7763262 in Europeans
(OR 1.49, P = 1.2 × 10⁻³⁰) compared to Asians (OR 1.30, P = 1.2 × 10⁻¹⁰, Supplementary
Table 6, OR difference P = 0.012). To identify specific HLA alleles that may underlie associations in this region, we imputed classical HLA alleles (Supplementary Table 13). Stepwise conditional analysis identified four independent genome-wide significant
associations (Supplementary Table 14), including DQA1*0101 (OR 1.53, P = 1.7 × 10⁻¹⁵),
DQA1*0102 (OR 0.68, P = 1.7 × 10⁻¹⁴), DQB1*0201 (OR 0.71, P = 2.6 × 10⁻¹³), and DQB1*0301 (OR 1.33, P = 2.2 × 10⁻¹²). On conditional analysis, these classical alleles account for most of the SNP associations at this interval (Supplementary Table 15). Chr.6p21: Population-specific effects at TAP1/PSMB8 locus—The previously
reported risk allele at this locus (rs2071543, a Q49K missense variant in PSMB8)3
represents a strong cis-eQTL associated with increased peripheral blood expression of TAP2, PSMB8, and PSMB98, which encode proteins involved in antigen processing and presentation (Supplementary Table 9). In this study, rs2071543 displayed significant
heterogeneity across different cohorts (I2 = 76%, Cochrane’s P < 0.05) attributable to
ethnicity-specific effects (Supplementary Table 6). This SNP was genome-wide significant
in Asians (OR 1.41, P = 2.1 × 10⁻⁹), but no association was observed in Europeans (OR
0.99, P = 0.85). This difference was not explained by differences in risk allele frequency in Asian and European controls (0.80 and 0.87 respectively), suggesting variation in LD structure between Europeans and Asians, or the presence of an Asian-specific risk allele at this locus.
Chr.8p23: DEFA locus—A GWAS in Asians previously implicated rs2738048 in this locus, which contains a cluster of related genes encoding the α-defensin anti-microbial
peptides4. We detected a new genome-wide significant signal in this region represented by
rs10086568 (OR 1.16, P = 1.0 × 10⁻⁹, Figure 1e). All cohorts regardless of ethnicity
supported this new association. In contrast, we observed only a weak association at
rs2738048 (OR 1.10, P = 1.6 × 10⁻⁴), with evidence of significant heterogeneity across
different cohorts (Cochrane’s P < 0.05). In the ethnicity-specific analyses, the association of
Author Manuscript
Author Manuscript
Author Manuscript
rs2738048 was evident only in Asian cohorts (OR 1.23, P = 1.3 × 10⁻⁷ in Asians; OR 1.02, P = 0.58 in Europeans; Supplementary Table 6), and this finding was not explained by differences in risk allele frequency in Asian and European controls (0.68 and 0.69
respectively). Because rs2738048 and rs10086568 are not in linkage disequilibrium (r2 <
0.03), mutual conditioning had little effect on these results (Supplementary Table 16). To date, variation at this locus has not been identified by GWAS of other phenotypes, suggesting that the DEFA association may be specific to IgAN.
Replication of four other known loci and total variance explained
Our GWAS provided genome-wide significant confirmation of three previously reported loci on chr.1q32 (CHFR3,1-delta), chr.6p21 (HLA-DP), and the chr.22q12 (HORMAD2) and confirmed one of the two previously reported SNPs on chr.17p13 (TNFSF13, rs3803800) (Table 2, Figure 1, and Supplementary Figure 6). We also confirmed the additive effect of the TNFSF13 and HORMAD2 risk alleles on serum IgA levels
(Supplementary Figure 7). Cumulatively, the 15 new and replicated GWAS loci explained 6.2% of the risk in the European cohorts and 7.6% of the variation in disease risk in the Chinese cohorts.
The genetic risk score is associated with the age of disease onset
We hypothesized that a higher burden of genetic susceptibility alleles may also influence the severity or onset of kidney disease. To test this hypothesis, we computed a genetic risk score as the weighted sum of the number of the alleles multiplied by the log of the OR for each of the individual loci. We detected a highly significant association between the genetic risk score and age of diagnosis among the 3,409 cases with available data, with 14 of 15 risk alleles individually contributing to this association. Risk alleles promoted earlier disease onset (Figure 2b and c, Supplementary Table 17), with each quintile of the genetic risk score
changing the age of onset by 1.2 years (P = 2.8 × 10⁻¹³). This effect was robust to
adjustments for cohort or ethnicity. Nonetheless, these loci explained only about 1.4% of the total variance in age of disease onset. Additional analysis of single SNP-phenotype
correlations pointed to rs7763262-C risk allele (HLA-DQ/DR locus) as most strongly
associated with age of diagnosis (P = 3.2 × 10⁻⁴) and greater risk of progression to end-stage
kidney disease (per allele HR 1.72, P = 3.6 × 10⁻³). Exploratory analyses of other
parameters of disease severity and progression were generally not statistically significant (Supplementary Tables 17–19).
Geospatial pattern of genetic risk suggests polygenic adaptation
We previously demonstrated that the worldwide distribution of IgAN risk alleles was
correlated with distance from Africa and paralleled the prevalence of IgAN2,3. The
distribution for the 15-SNP risk score derived from the present study showed an even greater difference among worldwide populations and was more correlated with geography (52
HGDP populations, r = 0.33, p < 1.0 × 10⁻¹⁶, Supplementary Figure 8a). We observed no
evidence of hard selective sweeps at any of the individual loci by haplotype-based selection
tests in Asians and Europeans16. For several loci, ancestral alleles have lower frequencies in
Africans, suggesting that local selective pressures could be operating in Africa. The
Author Manuscript
Author Manuscript
Author Manuscript
observed correlation of risk score with distance from Africa is unlikely to be a chance event; based on 10,000 permutations of 15 randomly drawn SNPs matched for average allele frequency to each IgAN SNP, we found that the observed geo-spatial correlation was in the upper tail of the null distribution (empiric P = 0.026, Supplementary Figure 8b). The IgAN risk allele frequencies were also highly differentiated across HapMap III populations (average Fst of 0.237, Supplementary Table 20). Notably, the risk alleles with larger effect size displayed greater differences in frequency among populations, further suggesting a non-random change in allele frequencies across populations (Supplementary Figures 8d and e). Taken together, these observations are best explained by polygenic adaptation to local environments (soft selective sweeps acting simultaneously on multiple existing loci) or more
complex selective pressures not easily detectable by classical tests of selection17,18.
Overlap with susceptibility loci for other phenotypes
We identified many overlaps with susceptibility loci for other phenotypes documented in the NHGRI GWAS catalogue, suggesting shared pathogenic pathways (Figure 2a and
Supplementary Table 11). We found both concordant and opposing effects with other immune mediated diseases. The HLA-DQ/DR region had the largest number of overlapping associations; IgAN risk alleles within this locus conferred increased risk of rheumatoid
arthritis19, systemic sclerosis20, alopecia areata21, Graves’ disease22, follicular lymphoma23,
type I diabetes19 and IgA deficiency24. However, these risk alleles for IgAN also reduced
risk for SLE25, multiple sclerosis26, ulcerative colitis27, and hepatocellular carcinoma28. At
the same time, because of extensive LD within the HLA region, some of these associations may be reflective of signal inter-correlation rather than true pleiotropic effects. Among
non-HLA loci, IgAN risk alleles also conferred increased risk for IBD (CARD9 locus)11,12,
elevated serum non-albumin protein and IgA levels (TNFSF13 locus)29, AMD
(CFHR3,1-delta locus)30, and T1DM (HORMAD2 locus)31. Opposing effects were detected for SLE
(ITGAM-ITGAX and CFHR3,1-delta)7,32 and IBD (HORMAD2 locus)12,33.
Notably, detailed annotations revealed that the majority of IgAN loci encode proteins implicated in maintenance of the intestinal barrier and regulation of mucosal immune response to pathogens (Table 3). Three IgAN risk loci are associated with Crohn’s disease
and/or ulcerative colitis (CARD9, HORMAD2 and HLA-DQB1)11,12,34. ITGAM and TNSF13
participate in regulation of IgA-producing cells in the intestine35,36; ITGAM is also required
for interaction between FcαR (CD89) and secretory IgA, the main form of IgA at mucosal
sites37,38. α-defensins are expressed by the intestinal Paneth cells and protect from food- and
water-borne pathogens in the intestine; deficiencies in α-defensins-5 and -6 have been
associated with Crohn’s disease39,40. Finally, CARD9, VAV and PSMB8/9 are involved in
NF-κB activation and are essential for maintenance of the intestinal epithelial barrier and control of the local inflammatory response to infection and CARD9 deficiency produces
susceptibility to invasive fungal infections41–43.
Enrichment of the GWAS for SNPs implicated in autoimmune or inflammatory traits We hypothesized that additional associations with other autoimmune and inflammatory disorders may be present below our replication threshold. Therefore, we performed a gene-set analysis of 582 non-HLA SNPs previously associated with any autoimmune or
Author Manuscript
Author Manuscript
Author Manuscript
inflammatory trait listed in the NHGRI GWAS catalogue. In total, 87/582 (15%) were associated with the risk of IgAN at a nominal P < 0.05 (Figure 3a, Supplementary Table 21). This distribution was never observed in 10,000 permutations of phenotype on genotype, indicating a highly significant excess of positive associations (empiric P < 0.0001, Supplementary Figure 9). We also detected a consistent excess of direct protein-protein interactions among gene products encoded by the significant and suggestive loci
(Supplementary Figure 10). Among the most prominent autoimmune signals was the PADI4
locus, previously associated with risk of rheumatoid arthritis44 (rs12568771, OR 1.12, P =
1.8 × 10⁻⁶, Supplementary Table 5). These data make clear that additional associations with
other autoimmune and inflammatory disorders are present below our replication threshold and should be pursued in follow-up studies.
When the suggestive and significant loci were tested for enrichment in KEGG pathways, the top overrepresented pathways were “Intestinal Immune Network for IgA Production”
(overlap coefficient of 25%, P < 1.0 × 10⁻¹⁶, Figure 3b) and “Leishmania Infection”, a
protozoan infection involving the skin, viscera and mucosa (overlap coefficient of 15%, P =
6.8 × 10⁻¹⁵). Notably, the pathway enrichment scores and all network connectivity
parameters were consistently increased with the addition of the top SNPs at varying FDR levels, providing additional support for the role of these loci in the pathogenesis of IgAN (Supplementary Figure 10).
Association of the IgAN genetic risk score with pathogen diversity
The enrichment for pathways involving intestinal immunity and mucosal pathogens strongly suggested that the distinctive geographic pattern of IgAN risk alleles might have been shaped by an adaption to local environment. To better define potential environmental factors that could account for such an adaptive process, we performed an association analysis of the IgAN genetic risk score for HGDP populations with 14 ecological variables previously
defined for these populations reflecting local climate, pathogen load, and dietary factors45
(Supplementary Table 22a). The genetic risk was nominally associated with climatic and dietary factors. However, there was a very strong positive association of the IgAN genetic risk score with local pathogen diversity (measured as the number of different pathogen species in the area, including viruses, bacteria, protozoa, and helminthes, r = 0.61, P = 6.0 ×
10−7, Figure 4a). In the analysis of individual pathogen classes, the strongest association was
for helminth diversity (r = 0.68, P = 1.0 × 10⁻⁸, Figure 4b), which accounted for nearly all
the association with pathogen diversity on a stepwise regression analysis. In the final combined model, only helminth diversity and geography were independently associated with the IgAN genetic risk score (Supplementary Table 22b).
Discussion
In this study, we identify six novel signals that contribute to IgAN, including four in novel loci (ITGAM-ITGAX, VAV3 and CARD9) and two in known regions (HLA-DQB1, DEFA), and replicate nine of the previously reported genome-wide significant signals. The loci discovered in this study reside at the intersection of multiple canonical pathways, and point to critical steps in the pathogenesis of IgAN (maintenance of the intestinal mucosal barrier,
Author Manuscript
Author Manuscript
Author Manuscript
activation of mucosal IgA production, NF-κB signaling, defense against intracellular pathogens, and complement activation). Collectively, these 15 independent risk alleles significantly influence the age of disease onset. Moreover, we demonstrate significant overlap of these loci with other autoimmune and inflammatory disorders, placing IgAN in this disease spectrum.
The striking association of risk allele frequencies with geography and local helminth diversity is most consistent with multi-locus adaptation to environment. While our analysis cannot exclude unmeasured environmental factors or other pathogens that are associated with helminth diversity, helminth infection itself is a potential source of selection pressure. Helminth infection has been a major source of morbidity and mortality in human history,
and even today occurs in 25% of the world population46, with the highest global burden of
soil-transmitted helminthes infections occurring in Asia, significantly contributing to
pediatric mortality46,47. Intriguingly, secondary forms of IgAN are known to develop in the
setting schistosomiasis, a common helminth infection48. Recent data also indicate that
schistosome infection specifically impairs the ability of ITGAM-positive (CD11b+)
dendritic cells to stimulate CD4+ T-cells49. These findings strongly suggest that the
increased incidence of IgAN in some geographic areas may represent an untoward
consequence of protective adaptation to mucosal invasion by local pathogens. The enhanced immune response conferred by risk alleles would simultaneously explain the known association of mucosal infections as a trigger for IgAN.
Host-pathogen interactions have similarly exerted a critical influence on the genetic
architecture of IBD12. Consistent with this finding, IgAN loci are either directly associated
with risk of IBD (HLA-DQ/DR, CARD9, HORMAD2) or encode proteins involved in maintenance of the intestinal mucosal barrier or regulation of mucosal immune response (DEFA, TNFSF13, VAV3, ITGAM-ITGAX, PSMB8; Table 3). Network and enrichment analyses further point to perturbations of the immune pathway of intestinal IgA production as a central defect in the disease pathogenesis (Figure 3, Supplementary Figure 10, and Supplementary Table 21). These results clearly link intestinal mucosal inflammatory disorders and IBD with risk of IgAN and may explain why these two diseases co-occur more
often than expected by chance50. These data are also consistent with the clinical observation
that mucosal infections frequently trigger episodes of glomerulonephritis in IgAN, and with
the key role of IgA in defense at mucosal surfaces51.
Finally, these results demonstrated that most IgAN risk loci are shared with other immune-mediated diseases and identified 87 suggestive associations with non-HLA autoimmune and inflammatory SNPs. These analyses predict that follow-up studies of autoimmune and inflammatory variants, particularly among patients with early onset of disease, will yield additional genome-wide significant associations and further clarify links to environmental risk factors.
Author Manuscript
Author Manuscript
Author Manuscript
Methods
Study Design and Power Analysis
The study was designed in two stages. Stage I (the discovery phase) involved a genome-wide meta-analysis of four discovery cohorts (2,747 cases and 3,952 controls) imputed to a common set of >1 million SNPs. Stage II (the replication phase) involved genotyping of the top signals from stage I in ten additional cohorts of European and Asian ancestry (4,911 cases and 9,002 controls). We carried out power calculations for this design under the following assumptions: a disease prevalence of 1%; a log-additive risk model; perfect LD
between a marker and a disease allele; a follow-up significance threshold of 5×10 5; and
joint (stage I and II) significance level of 5×10 8. The power of our study was calculated for
a range of disease allele frequencies (0.10–0.50) and effect sizes (genotypic risk ratio 1.10–
1.50). The effect sizes detectable at α = 5×10 8 with a power of 80% were also estimated
(Supplementary Table 1). The calculations were performed using CaTS software75. All
subjects provided informed consent to participate in genetic studies and the Institutional Review Board of Columbia University as well as local ethic review committees for each of the individual cohorts approved our study protocol.
GWAS Discovery Study (Stage I)
The cohorts, genome-wide genotyping, genotype quality control, ancestry analysis, and imputations are described in detail in the Supplementary Note and Supplementary Tables 2– 4. We implemented strict quality control filters for each of the cohorts, including elimination of samples with low call rates, duplicates, ancestry outliers, samples with cryptic relatedness or samples with detected gender mismatch (Supplementary Table 2). We applied principal component (PC) -based ancestry-matching algorithms to reduce any potential bias of population stratification (Supplementary Table 3). After implementation of ancestry matching, we dramatically reduced the number of significant PCs for each cohort and we demonstrated that cases and controls were evenly distributed along the PC axes without significant outliers (Supplementary Figure 1). To improve coverage across different platforms, we performed imputation to a common set of >1 million HapMap-III SNPs (Supplementary Table 4 and Supplementary Note). Only SNPs with high imputation quality
(r2>0.8) were included in association analyses. After ancestry matching, imputation, and
quality control, there were four cohorts included in stage I: the Italian Discovery Cohort of 1,045 cases and 1,340 controls (1,132,157 imputed markers), the Chinese Discovery Cohort of 1,194 cases and 902 controls (1,027,812 imputed markers), the French Discovery Cohort of 205 cases and 159 controls (1,032,453 imputed markers) and the US Discovery Cohort of 303 cases and 1,551 controls (1,118,683 imputed markers). The primary association testing was performed within each cohort individually under a multiplicative (log-additive) model and after accounting for imputation uncertainty using an allelic dosage method. Significant principal components of ancestry were included as covariates in the association analysis of each individual cohort. Ancestry-adjusted effect estimates and standard errors were derived for each SNP and the results were combined genome-wide using fixed effects. The
meta-analysis results were verified using two independent software packages (PLINK v.1.0776
and METAL77). The genome-wide distributions of P values were examined visually using
QQ-plots for each individual cohort as well as for the combined analysis. We also estimated
Author Manuscript
Author Manuscript
Author Manuscript
genomic inflation factors for each genome-wide analysis78 (Supplementary Figure 3). The final meta-analysis QQ-plot showed no global departures from the expected distribution of P values and the overall genomic inflation factor was estimated at 1.047 (Supplementary Figure 4).
Follow-up of Suggestive Signals (Stage II)
Based on the examination of QQ-plots from Stage I, we selected a P-value threshold of
5×10⁻⁵ to define signals for follow-up analyses. This threshold corresponds to the positive
FDR of 13% (Q-value software)79. The threshold defined 435 top SNPs that were
subsequently prioritized for replication. Of the 435 SNPs, 320 (74%) were localized within the known susceptibility loci, including 286 SNPs across the HLA loci, 30 SNPs on chr. 22q12.2 (HORMAD2 locus) and additional 4 SNPs on chr.1q32 (CFHR3/1-delta locus). The remainder 115 SNPs were clustered into distinct loci on the basis of their physical location and regional patterns of LD. Conditional logistic regression analysis was carried out to confirm correct SNP grouping and to detect independent signals. For follow-up genotyping, we prioritized independent SNPs with the lowest P-value within each independent locus. We additionally required that each SNP is successfully typed or imputed in at least three of the four analyzed cohorts. We excluded loci supported only by a single SNP (“singleton signals” defined by absence of supporting signals with P<0.01 within the same block of LD). In case genotyping failed, we selected a back-up SNP based on strength of association, LD with the top SNP, quality of genotyping or imputation, and ability to design working primers. Additionally, we included representative SNPs for the two recently discovered
GWAS loci in Chinese4, the TNFSF13 locus (rs3803800 and rs4227) and the DEFA locus
(rs2738048). In total, we successfully acquired and analyzed genotype data for 50 carefully selected SNPs representative of the top 37 distinct genomic regions in 13,913 replication samples (4,911 cases and 9,002 controls). The composition of the replication cohorts, genotyping methods and genotype quality control are summarized in the Supplementary Note and Supplementary Table 2. The association analyses were first carried out
individually within each of the 10 included cohorts. Similar to stage I, the results were next combined using a fixed effects model. For each SNP, we derived pooled effect estimates, their standard errors, and 95% confidence intervals. We also estimated the degree of
heterogeneity using heterogeneity index (I2) and Cochrane’s Q test in the combined
analysis80. The complete summary of association results for all 50 SNPs tested in replication
cohorts is provided in Supplementary Tables 5, 6, and 7. Imputation Analysis of Classical HLA Alleles
For each of the cohorts with available genome-wide genotype data, we imputed classical HLA alleles at -A, -B, -C, -DQB1, -DQA1, and -DRB1 loci. We used HapMap Caucasian Utah (CEU) samples as reference for imputation of Caucasian cohorts and combined Han Chinese Beijing (HCB) and Japanese of Tokyo (JPT) samples for Asians. The reference panels were constructed by phasing combined SNP genotype and HLA typing data. The
phasing and imputation were performed using two independent methods: MACH81 and
BEAGLE-382. Any poorly imputed alleles (R-sq < 0.3) were eliminated from association
testing at the level of individual cohorts. The imputed allelic concordance rate between the two methods was 98.1%. In addition, direct sequencing of the informative coding segments
Author Manuscript
Author Manuscript
Author Manuscript
of HLA-DQB1 gene in a random subset of 155 samples demonstrated that our imputation had 89.0% sensitivity and 91.5% specificity. The association testing in each cohort was performed using allelic dosage method with adjustment for significant principal components
in PLINK76. The final results were combined across cohorts using fixed effects
meta-analysis in METAL77 (Supplementary Table 13). Conditional analyses were performed
using stepwise logistic regression with Bayesian Information Criterion (BIC) as a selection criterion (Supplementary Table 14, Step function, R version 3.0)
Pairwise Epistasis Screen
We screened all possible pairwise interaction terms for association with disease using 1-df LRT comparing two nested logistic models: one with main effects only and one with main effects and a multiplicative (log-additive) interaction term. We included cohort membership as a fixed covariate in both models. We excluded 7 pairwise interaction terms between SNPs
in partial linkage disequilibrium (r2>0.1) resulting in a total of 98 independent interactions
tested (Supplementary Table 23). The results were ranked in the order of significance and positive false discovery rate (q-values) were calculated. Suggestive interaction terms were defined as exceeding a significance threshold that was Bonferroni-corrected for the number
of independent tests (p < 0.05/98 or 5×10⁻⁴).
Interrogation of Protein-Protein Interaction (PPI) Networks
We interrogated two comprehensive PPI network datasets using two independent methods.
First, we used the Disease Association Protein-Protein Link Evaluator (DAPPLE)83. This is
a network connectivity tool based on InWeb84, an integrated database of known PPIs with
12,793 nodes and 169,810 high-confidence interactions based on MINT, IntAct, BIND, PPrel, ECrel, and Reactome. Statistical significance of network connectivity parameters for individual proteins and for the entire seed set was assessed using 1,000 within-degree node-label permutations (Supplementary Figure 10). As an independent confirmatory analysis, we
downloaded the Protein Interaction Network Analysis (PINA) dataset85, which combines
annotated PPI data from 6 databases (MINT, IntAct, DIP, BioGRID, HPRD, and MIPS/ MPact). This large network consisted of 14,784 nodes and 107,802 unique edges (last
release December 10th, 2012). To integrate our GWAS results with PPI data, and to identify
modules enriched in disease-associated genes, we used a dense module searching method
(dmGWAS v.2.0)86. Briefly, we performed a global search for modules with maximum
proportion of low P-values by designating the top-scoring GWAS genes as seeds and selecting neighboring nodes (with a shortest path to any node in the module ≤ 2) that optimize subgraph’s overall significance. The extracted subnetworks were merged and visualized using R (igraph v.0.5.2).
Other Methods of Prioritizing Candidate Genes
To interrogate putative functional SNPs that were not typed or imputed in our dataset, we
systematically identified all variants that were in high LD (r2 > 0.5) with the 15 IgAN
GWAS SNPs based on 1000 Genomes data. These variants were further annotated using
ANNOVAR87, SeattleSeq88, and HaploReg289 (Supplementary Table 10). We also analyzed
a subset of 1,073 SNPs that represented tags for the known common copy number
Author Manuscript
Author Manuscript
Author Manuscript
polymorphisms90. Additionally, we identified all genes whose expression was correlated
with the IgAN susceptibility SNPs in cis- or trans- and at P < 10−5 (Supplementary Table 9).
For this purpose, we used the following recently published eQTL datasets: (1) meta-analysis
of transcriptional profiles from peripheral blood cells of 5,311 Europeans8, (2) primary
immune cells (B-cells and monocytes) from 288 healthy Europeans9; (3) 400
lymphoblastoid cell lines (LCL) derived from asthmatic children10, and (4) eqtl.uchicago
browser with compiled data across several tissues. Finally, we utilized GRAIL (Gene Relationships Across Implicated Loci), an online tool that uses PubMed text mining results
to assess network connectivity between genes residing in implicated GWAS loci91. To
prioritize candidate genes, each individual gene was tested for significant enrichment in GRAIL connectivity to genes residing in other loci.
Genetic Risk Score
To assess cumulative effects of the newly detected loci, we built a logistic regression model based on the 15 SNP predictors with independent contribution to disease risk. The risk score was calculated as a weighted sum of the number of risk alleles at each locus multiplied by the log of the adjusted OR for each of the individual loci. The percentage of the total
variance explained was estimated by Nagelkerke’s pseudo R2 from the logistic regression
model with the risk score as a quantitative predictor and disease state as an outcome (SPSS Statistics v.21.0, IBM 2013).
Geospatial Risk Analysis
For this purpose, we used publicly available genotype data of HapMap III (1,184 individuals representative of 11 populations) and the Human Genome Diversity Panel (HGDP; 1,050 individuals representative of 52 worldwide populations). The HGDP individuals have been previously genotyped for 660,918 markers using Illumina 650Y arrays (Stanford
University). High quality genotype data was available for 13 out of 15 IgAN SNPs, with missing genotypes for rs10086568 and rs7763262. We imputed rs7763262 with high
confidence (imputation r2 > 0.99) using all combined HapMap-III populations for reference.
Instead of rs10086568, we used a near-perfect proxy rs9644778 (r2=94%, D′=1.00), which
was also genome-wide significant in our study (P = 1.8 × 10⁻⁹). Using these data, we
calculated individual risk score profiles for all individuals in the HGDP dataset. The risk score was standardized across populations using a Z-score method: Standardized Risk Score = (Individual Risk Score – Worldwide Mean)/Worldwide Standard Deviation. The median standardized risk scores for each population were compared across continents. We correlated standardized risk profiles with the longitude, latitude, and geographic distance from Africa.
Testing for Genetic Drift
To evaluate if the observed allelic differentiation is due to genetic drift, we analyzed 10,000 sets of SNPs randomly drawn from the genome but matched to the IgAN SNPs based on average minor allelic frequency on a per-SNP basis. In each permutation round, we scored all 1,050 HGDP individuals with the risk score calculated from the set of randomly selected SNPs. The risk scores were correlated with the distance from Africa to generate distributions of null statistics against which we compared the observed geospatial correlation. Empirical
Author Manuscript
Author Manuscript
Author Manuscript
P-value was defined as the number of permuted statistics more extreme than the observed statistic divided by the total number of permutations (Supplementary Figure 8). Empiric P-value < 0.05 was considered statistically significant. The permutation procedure was implemented using a custom script in PERL programming language.
Correlations with Environmental Variables
We investigated correlations between the newly defined genetic risk score and 14 environmental variables previously defined for each of the HGDP populations
(Supplementary Table 22a). The environmental variables were downloaded directly from
Fumagalli et al.45, and included climatic factors (relative humidity, mean annual
temperature, precipitation rate, net short wave radiation flux, and physical distance from the sea), subsistence strategies (relative amount of agriculture, animal husbandry, fishing, hunting, and gathering) and pathogen diversity (number of different species of viruses, bacteria, protozoa, and helminthes). We applied Pearson’s correlation analysis, as well as partial correlation to test median standardized genetic risk before and after controlling for geographic distance from Africa (SPSS Statistics v.21.0). Because many of the ecological factors are inter-correlated, we also applied a stepwise feature selection algorithm (BIC selection criterion) to construct the best predictive regression model of genetic risk (step function, R v.3.0). At entry, we included each of the broad predictor categories separately (climate, subsistence, pathogens), followed by all 14 predictors combined, with additional adjustment for the distance from Africa (Supplementary Table 22b).
Clinical Phenotype-Genotype Correlations
We analyzed baseline demographic and clinical data from the time of renal biopsy,
including age, gender, body mass index, serum creatinine (SCr), albumin (Alb), hemoglobin (Hgb), 24-hour protein excretion (P24), microscopic hematuria, systolic blood pressure (SBP), diastolic blood pressure (DBP), and history of gross hematuria. The diagnosis of hypertension was based on SBP ≥ 140 mmHg, or DBP ≥ 90 mmHg, or history of
antihypertensive medication use. The level of protein excretion was measured by a 24-hour urine collection or estimated based on urinary protein-to-creatinine ratio; the proteinuria values were normalized using ln(P24+1) transformation. The degree of renal tissue injury
was graded using the Haas92 classification. Estimated glomerular filtration rate (eGFR) was
evaluated using the Modification of Diet in Renal Disease (MDRD) equation for
Europeans93 and the modified MDRD version for Chinese94. Chronic kidney disease (CKD)
was classified based on the eGFR intervals according to the Kidney Disease Outcomes
Quality Initiative (K/DOQI) practice guidelines95. End stage renal disease (ESRD) was
defined by eGFR < 15 ml/min/1.73m2 or initiation of renal replacement therapy (dialysis or
kidney transplantation). Longitudinal data after kidney biopsy were available for 1,607 patients with a mean follow-up time of 7.9 years. Out of 1,607 patients, 459 reached the endpoint of ESRD within the follow-up period. For screening genotype-phenotype correlations, we used linear regression for quantitative traits, logistic regression for binary traits, and Cox proportional hazards models for survival analysis with SNP predictors coded under additive genetic model. The associations for eGFR, P24, Alb, Hgb, histopathology scores, and serum levels of IgA and IgA1 were adjusted for age, gender, and cohort/ ethnicity. Association testing for the age of diagnosis and onset of ESRD were performed
Author Manuscript
Author Manuscript
Author Manuscript
before and after adjustment for sex and cohort/ethnicity. The analysis of kidney disease progression was adjusted for age, sex, cohort/ethnicity, baseline eGFR (minimally adjusted model) as well as P24 and Haas histopathology score (full model). Statistical analyses were implemented in R version 3.0 and SPSS Statistics version 21 (IBM).
Genetic Overlap with Other Phenotypes
To systematically cross-annotate IgAN susceptibility loci against all previously published
GWAS findings, we downloaded the latest NHGRI GWAS catalogue (September 2013)96.
We filtered all published SNPs that were (1) associated with any disease phenotype or trait
at a genome-wide significance (p < 5 × 10⁻⁸) and (2) resided within the genomic regions of
association with IgAN. For each SNP association, we manually verified the direction of effect for a reference allele based on original publications. Next, each selected SNP from the catalogue was queried against our GWAS results to extract the odds ratios and p-values for associations with IgAN. The directionality of allelic effects was assessed to identify pleiotropic alleles with concordant or opposed effects (Supplementary Table 11). We
calculated a maximum r2 between SNPs associated with each catalogued trait and the 15
SNPs from our study based on the data from HapMap-III and 1000 Genomes project. We
defined overlapping susceptibility alleles if r2 exceeded 0.50. Lastly, we constructed a
susceptibility overlap map that connects each of the IgAN loci to the previously associated GWAS traits and highlights associations with SNPs in high LD with the top IgAN signals (Figure 2a).
Testing Inflammatory/Autoimmune Subset Hypothesis
We analyzed 582 unique SNPs representative of all non-HLA autoimmune and
inflammatory disease-associated GWAS loci out of the 11,276 listed in the NHGRI GWAS
catalogue (September, 2013)96. The association results for this set were visually examined
for overrepresentation of significant signals using a QQ-plot (Figure 3a). Next, we tested the
autoimmune hypothesis using a previously published GWAS-HD approach97. This involved
testing 582 unique SNPs simultaneously for association with IgAN using the GWAS discovery cohorts. To preserve the LD pattern between SNPs, the IgAN phenotype was permuted 10,000 times within each cohort. In each round of permutation, corresponding association analysis was performed using logistic regression after adjustment for cohort membership, and a sum of the Wald (1-d.f.) association statistics of the 582 SNPs was calculated. The empirical P value was calculated as the proportion of the permutation samples whose sum statistic was larger than that in the observed sample (Supplementary Figure 9).
Gene Annotation and Network Analysis of Autoimmune/Inflammatory SNPs
Based on the observed distribution of P-values, we defined two arbitrary thresholds for inclusion of suggestive signals in downstream network analyses: positive FDR < 10%
(corresponding to P < 5.9 × 10⁻³) and positive FDR < 25% (corresponding to P < 0.05). The
SNPs meeting these criteria were clustered into distinct loci based on genomic location and pairwise linkage disequilibrium. The disease locus was defined by nearest recombination hotspots in the 3′ and 5′ direction of the top SNP and overlapping intervals were merged into
Author Manuscript
Author Manuscript
Author Manuscript
a single locus. All genes that intersect this interval, including 100-kb upstream and 40-kb downstream of the largest isoform (to include regulatory DNA), were considered as contained within the disease locus. The candidate gene sets (union of all genes within the candidate loci), were used as seeds in the sequential GRAIL and DAPPLE analyses
(Supplementary Figure 10). These gene sets were also used for pathway analysis using Gene
Set Enrichment Analysis (GSEA)98. The KEGG pathway enrichment map (Figure 3b) was
constructed using the Enrichment Map (v.1.2)99. Network graphs were visualized in
Cytoscape (v.2.8).
Supplementary Material
Refer to Web version on PubMed Central for supplementary material.
Authors
Krzysztof Kiryluk1, Yifu Li1, Francesco Scolari2,3, Simone Sanna-Cherchi1, Murim Choi4,5, Miguel Verbitsky1, David Fasel1, Sneh Lata1, Sindhuri Prakash1, Samantha Shapiro1, Clara Fischman1, Holly J. Snyder1, Gerald Appel1, Claudia Izzi2,6, Battista Fabio Viola7, Nadia Dallera2,3, Lucia Del Vecchio8, Cristina Barlassina8, Erika Salvi8, Francesca Eleonora Bertinetto9,10, Antonio Amoroso9,10, Silvana Savoldi11, Marcella Rocchietti11, Alessandro Amore12, Licia Peruzzi12, Rosanna Coppo12, Maurizio Salvadori13, Pietro Ravani14,15, Riccardo Magistroni16, Gian Marco Ghiggeri17, Gianluca Caridi17, Monica Bodria17, Francesca Lugani17, Landino Allegri18, Marco Delsante18, Mariarosa Maiorana18, Andrea Magnano18, Giovanni Frasca19, Emanuela Boer20, Giuliano Boscutti21, Claudio Ponticelli22, Renzo Mignani23, Carmelita Marcantoni24, Domenico Di Landro24, Domenico Santoro25, Antonello Pani26, Rosaria Polci27, Sandro Feriozzi27, Silvana Chicca28, Marco Galliani28, Maddalena Gigante29, Loreto Gesualdo30, Pasquale Zamboli31, Dita Maixnerová32, Vladimir Tesar32, Frank Eitner33,34, Thomas Rauen33, Jürgen Floege33, Tibor Kovacs35,36, Judit Nagy35,36, Krzysztof Mucha37, Leszek Pączek37, Marcin Zaniew38, Małgorzata Mizerska-Wasiak39, Maria Roszkowska-Blaim39, Krzysztof Pawlaczyk40, Daniel Gale41, Jonathan Barratt42,43, Lise Thibaudin44, Francois Berthoux44, Guillaume Canaud45,46, Anne Boland47, Marie Metzger48, Ulf Panzer49, Hitoshi Suzuki50, Shin Goto51, Ichiei Narita51, Yasar Caliskan52, Jingyuan Xie53, Ping Hou54, Nan Chen53, Hong Zhang54, Robert J. Wyatt55,56, Jan Novak57, Bruce A. Julian58, John Feehally42,43, Benedicte Stengel48, Daniele Cusi8, Richard P. Lifton4,59, and Ali G. Gharavi1
Affiliations
1Dept. of Medicine, Div. of Nephrology, College of Physicians and Surgeons,
Columbia University, New York, New York, USA 2Div. of Nephrology, Azienda
Ospedaliera Spedali Civili of Brescia, Montichiari Hospital, Univ of Brescia, Brescia, Italy 3Dept. of Medical and Surgical Specialties, Radiological Sciences, University of
Brescia, Brescia, Italy 4Dept. of Genetics, Yale University School of Medicine, New
Haven, Connecticut, USA 5Dept. of Biomedical Sciences, Seoul National University
College of Medicine, Seoul, Korea 6Prenatal Diagnosis Unit, Department of
Author Manuscript
Author Manuscript
Author Manuscript
Obstetrics and Gynecology, University of Brescia, Brescia, Italy 7Div. of Nephrology,
Azienda Ospedaliera Spedali Civili of Brescia, Spedali Civili Hospital, Univ of Brescia, Brescia, Italy 8Renal Div., DMCO, San Paolo Hospital, School of Medicine,
University of Milan, Milan, Italy 9Immunogenetics and Biology of Transplantation,
Città della Salute e della Scienza, University Hospital of Turin, Italy 10Medical
Genetics, Dept. of Medical Sciences, University of Torino, Torino, Italy 11Nephrology
and Dialysis Unit, Ospedali di Cirié e Chivasso, Cirié, Torino, Italy 12Nephrology,
Dialysis, and Transplantation Unit, Regina Margheritra Hospital, Torino, Italy 13Div.
of Nephrology and Renal Transplantation, Carreggi Hospital, Florence, Italy 14Dept.
of Medicine, University of Calgary, Calgary, Canada 15Dept. of Community Health
Sciences, University of Calgary, Calgary, Canada 16Div. of Nephrology Dialysis and
Transplantation, Azienda Ospedaliero Universitaria Policlinico di Modena, Università di Modena e Reggio Emilia, Italy 17Div. of Nephrology, Dialysis and
Transplantation, Giannina Gaslini Institute, Genova, Italy 18Div. of Nephrology,
Azienda Ospedaliero-Universitaria and Chair of Nephrology, University of Parma, Parma, Italy 19Div. of Nephrology, Dialysis and Renal Transpantation, Riuniti
Hospital, Ancona, Italy 20Div. of Nephrology and Dialysis, Gorizia Hospital, Gorizia,
Italy 21Div. of Nephrology, Azienda Ospedaliero-Universitaria Ospedali Riuniti di
Trieste, Trieste, Italy 22CP Humanitas Clinical and Research Center, Milan, Italy 23Div. of Nephrology and Dialysis, Infermi Hospital, Rimini, Italy 24Div. of
Nephrology, Cannizzaro Hospital, Catania, Italy 25Div. of Nephology and Dialysis,
Chair of Nephrology, University of Messina, Azienda Ospedaliero-Universitaria Policlinico, Messina, Italy 26Dept. of Nephrology and Dialysis, G. Brotzu Hospital,
Cagliari, Italy 27Nephrology and Dialysis, Hospital of Viterbo, Viterbo, Italy 28Div. of
Nephrology and Dialysis, Sandro Pertini Hospital, Rome, Italy 29Dept. of Medical
and Surgical Sciences, University of Foggia, Foggia, Italy 30Section of Nephrology,
Department of Emergency and Organ Transplantation, University of Bari, Bari, Italy
31Dept. of Nephrology, Second University of Naples, Naples, Italy 32Dept. of
Nephrology, 1st Faculty of Medicine and General University Hospital, Charles University, Prague, Czech Republic 33Dept. of Nephrology, RWTH University of
Aachen, Aachen, Germany 34Kidney Diseases Research, Bayer Pharma AG,
Wuppertal, Germany 35Nephrology Center, Medical Faculty, University of Pécs,
Pécs, Hungary 36Second Dept. of Internal Medicine, Medical Faculty, University of
Pécs, Pécs, Hungary 37Dept. of Immunology, Transplantology, and Internal
Medicine, Medical University of Warsaw, Warsaw, Poland 38Children’s Hospital,
Krysiewicza 7/8, Poznań, Poland 39Dept. of Pediatrics and Nephrology, Medical
University of Warsaw, Warsaw, Poland 40Dept. of Nephrology, Transplantology, and
Internal Medicine, Poznan Medical University, Poznan, Poland 41University College
London-Centre for Nephrology, Royal Free Hospital Pond Street, London 42The
John Walls Renal Unit, University Hospitals of Leicester, Leicester, United Kingdom
43Dept. of Infection, Immunity and Inflammation, University of Leicester, Leicester,
United Kingdom 44Nephrology, Dialysis, and Renal Transplantation Dept., University
North Hospital, Saint Etienne, France 45Service de Néphrologie Transplantation
Adultes, Hôpital Necker - Enfants Malades, Paris, France 46INSERM, Institut Necker
Author Manuscript
Author Manuscript
Author Manuscript
Enfants Malades, Université Paris Descartes, Sorbonne Paris Cité, Paris, France
47Centre National de Génotypage, CEA, Institut de Génomique, Evry, France 48INSERM, Centre for Research in Epidemiology and Population Health, Villejuif,
France and University Paris-Sud, Villejuif, France 49III Medizinische Klinik,
Universitätsklinikum Hamburg-Eppendorf, Hamburg, Germany 50Division of
Nephrology, Dept. of Internal Medicine, Juntendo University Faculty of Medicine, Tokyo, Japan 51Division of Clinical Nephrology and Rheumatology, Niigata
University, Niigata, Japan 52Division of Nephrology, Istanbul Faculty of Medicine,
Istanbul University, Istanbul, Turkey 53Dept. of Nephrology, Ruijin Hospital,
Shanghai Jiao Tong University School of Medicine, Shanghai, China 54Renal Div.,
Peking University First Hospital, Peking University Institute of Nephrology, Beijing, China 55Div. of Pediatric Nephrology, University of Tennessee Health Sciences
Center, Memphis, Tennessee, USA 56Children’s Foundation Research Center, Le
Bonheur Children’s Hospital, Memphis, Tennessee, USA 57Dept. of Microbiology,
University of Alabama at Birmingham, Birmingham, Alabama, USA 58Dept. of
Medicine, University of Alabama at Birmingham, Birmingham, Alabama, USA
59Howard Hughes Medical Institute, Yale University School of Medicine, New
Haven, Connecticut, USA
Acknowledgments
We are grateful to all study participants for their contribution to this work. This study was supported by R01DK082753 (A.G.G., J.N.), R01DK095510 (A.G.G. and R.P.L.), and by the Center for Glomerular Diseases at Columbia University. R.P.L. is an investigator of the Howard Hughes Medical Institute. K.K. is supported by K23DK090207, R03DK099564, and Carl W. Gottschalk Research Scholar Grant from the American Society of Nephrology (ASN). S.S.C. is supported by R21DK098531 and the American Heart Association (AHA) grant 13GRNT14680075. G.M.G. is supported by the Joint Italian Ministry of Health and NIH “Ricerca Finalizzata” and by the “Fondazione Malattie Renali nel Bambino”. D.C. and the HYPERGENES Consortium are supported by InterOmics (PB05 MIUR-CNR Italian Flagship Project). Additionally, we would like to acknowledge individuals from the following organizations: IgA Nephropathy Foundation of America for facilitating recruitment of individuals in the United States; Columbia University Glomerular Center (New York, USA), including: J. Radhakrishnan, D. Cohen, C. Kunis, A. Bomback and P. Canetta for referrals of IgAN cases; The Polish Registry Congenital Malformations (PRCM, Poznan, Poland) including A. Materna-Kiryluk and A. Latos-Bieleńska (supported by the Polish Ministry of Health), for facilitating the recruitment of the Polish IgAN cohort; Judit Nagy at the University of Pécs, Hungary (supported by SROP-4.2.2/B-10/1/2010-0029); GN-PROGRESS study, including F. Martinez, F. Vrtovsnik, and D. Droz for adjudicating all IgAN cases as well as individual center investigators including: X. Belenfant (Hôpital A Grégoire, Montreuil); B. Charpentier, A. Durrbach (AP-HP Hôpital Bicêtre, Kremlin-Bicêtre); G. Rostoker (Hôpital C Galien, Quincy/Senart); J. Rossert, C. Jacquot (AP-HP, Hôpital Européen G Pompidou, Paris); P. Lang, P. Remy (AP-HP Hôpital H. Mondor, Créteil); O. Kourilsky (Hôpital L. Michel, Evry); J-P. Grünfeld, D. Chauveau HP Hôpital Necker, Paris); G. Deray, H. Izzedine (AP-HP Hôpital Pitié Salpétrière, Paris); C. Legendre, F. Martinez (AP-(AP-HP Hôpital Saint-Louis, Paris); and P. Ronco, E. Rondeau (AP-HP Hôpital Tenon, Paris). We would also like to thank L. Sturg from the Biostatistics Division, Dalla Lana School of Public Health at the University of Toronto, Canada for contributing the R code for HD-GWAS analysis.
References
1. Liu ZH. Nephrology in china. Nat Rev Nephrol. 2013; 9:523–8. [PubMed: 23877587] 2. Kiryluk K, et al. Geographic differences in genetic susceptibility to IgA nephropathy: GWAS
replication study and geospatial risk analysis. PLoS Genet. 2012; 8:e1002765. [PubMed: 22737082] 3. Gharavi AG, et al. Genome-wide association study identifies susceptibility loci for IgA
nephropathy. Nat Genet. 2011; 43:321–7. [PubMed: 21399633]
Author Manuscript
Author Manuscript
Author Manuscript
4. Yu XQ, et al. A genome-wide association study in Han Chinese identifies multiple susceptibility loci for IgA nephropathy. Nat Genet. 2012; 44:178–82. [PubMed: 22197929]
5. Feehally J, et al. HLA has strongest association with IgA nephropathy in genome-wide analysis. J Am Soc Nephrol. 2010; 21:1791–7. [PubMed: 20595679]
6. Corbi AL, Larson RS, Kishimoto TK, Springer TA, Morton CC. Chromosomal location of the genes encoding the leukocyte adhesion receptors LFA-1, Mac-1 and p150,95. Identification of a gene cluster involved in cell adhesion. J Exp Med. 1988; 167:1597–607. [PubMed: 3284962] 7. Hom G, et al. Association of systemic lupus erythematosus with C8orf13-BLK and
ITGAM-ITGAX. N Engl J Med. 2008; 358:900–9. [PubMed: 18204098]
8. Westra HJ, et al. Systematic identification of trans eQTLs as putative drivers of known disease associations. Nat Genet. 2013; 45:1238–43. [PubMed: 24013639]
9. Fairfax BP, et al. Genetics of gene expression in primary immune cells identifies cell type-specific master regulators and roles of HLA alleles. Nat Genet. 2012; 44:502–10. [PubMed: 22446964] 10. Dixon AL, et al. A genome-wide association study of global gene expression. Nat Genet. 2007;
39:1202–7. [PubMed: 17873877]
11. Franke A, et al. Genome-wide meta-analysis increases to 71 the number of confirmed Crohn’s disease susceptibility loci. Nat Genet. 2010; 42:1118–25. [PubMed: 21102463]
12. Jostins L, et al. Host-microbe interactions have shaped the genetic architecture of inflammatory bowel disease. Nature. 2012; 491:119–24. [PubMed: 23128233]
13. Fujikawa K, et al. Vav1/2/3-null mice define an essential role for Vav family proteins in lymphocyte development and activation but a differential requirement in MAPK signaling in T and B cells. J Exp Med. 2003; 198:1595–608. [PubMed: 14623913]
14. Swat W, Fujikawa K. The Vav family: at the crossroads of signaling pathways. Immunol Res. 2005; 32:259–65. [PubMed: 16106078]
15. Eriksson N, et al. Novel associations for hypothyroidism include known autoimmune risk loci. PLoS One. 2012; 7:e34442. [PubMed: 22493691]
16. Pickrell JK, et al. Signals of recent positive selection in a worldwide sample of human populations. Genome Res. 2009; 19:826–37. [PubMed: 19307593]
17. Pritchard JK, Pickrell JK, Coop G. The genetics of human adaptation: hard sweeps, soft sweeps, and polygenic adaptation. Curr Biol. 2010; 20:R208–15. [PubMed: 20178769]
18. Teshima KM, Coop G, Przeworski M. How reliable are empirical genomic scans for selective sweeps? Genome Res. 2006; 16:702–12. [PubMed: 16687733]
19. Wellcome Trust Case Control C. Genome-wide association study of 14,000 cases of seven common diseases and 3,000 shared controls. Nature. 2007; 447:661–78. [PubMed: 17554300] 20. Radstake TR, et al. Genome-wide association study of systemic sclerosis identifies CD247 as a
new susceptibility locus. Nat Genet. 2010; 42:426–9. [PubMed: 20383147]
21. Petukhova L, et al. Genome-wide association study in alopecia areata implicates both innate and adaptive immunity. Nature. 2010; 466:113–7. [PubMed: 20596022]
22. Chu X, et al. A genome-wide association study identifies two new risk loci for Graves’ disease. Nat Genet. 2011; 43:897–901. [PubMed: 21841780]
23. Smedby KE, et al. GWAS of follicular lymphoma reveals allelic heterogeneity at 6p21.32 and suggests shared genetic susceptibility with diffuse large B-cell lymphoma. PLoS Genet. 2011; 7:e1001378. [PubMed: 21533074]
24. Ferreira RC, et al. Association of IFIH1 and other autoimmunity risk alleles with selective IgA deficiency. Nat Genet. 2010; 42:777–80. [PubMed: 20694011]
25. Yang W, et al. Meta-analysis followed by replication identifies loci in or near CDKN1B, TET3, CD80, DRAM1, and ARID5B as associated with systemic lupus erythematosus in Asians. Am J Hum Genet. 2013; 92:41–51. [PubMed: 23273568]
26. International Multiple Sclerosis Genetics C et al. Risk alleles for multiple sclerosis identified by a genomewide study. N Engl J Med. 2007; 357:851–62. [PubMed: 17660530]
27. Okada Y, et al. HLA-Cw*1202-B*5201-DRB1*1502 haplotype increases risk for ulcerative colitis but reduces risk for Crohn’s disease. Gastroenterology. 2011; 141:864–871. e1–5. [PubMed: 21699788]
Author Manuscript
Author Manuscript
Author Manuscript
28. Kumar V, et al. Genome-wide association study identifies a susceptibility locus for HCV-induced hepatocellular carcinoma. Nat Genet. 2011; 43:455–8. [PubMed: 21499248]
29. Osman W, et al. Association of common variants in TNFRSF13B, TNFSF13, and ANXA3 with serum levels of non-albumin protein and immunoglobulin isotypes in Japanese. PLoS One. 2012; 7:e32683. [PubMed: 22558069]
30. Chen W, et al. Genetic variants near TIMP3 and high-density lipoprotein-associated loci influence susceptibility to age-related macular degeneration. Proc Natl Acad Sci U S A. 2010; 107:7401–6. [PubMed: 20385819]
31. Barrett JC, et al. Genome-wide association study and meta-analysis find that over 40 loci affect risk of type 1 diabetes. Nat Genet. 2009; 41:703–7. [PubMed: 19430480]
32. Zhao J, et al. Association of genetic variants in complement factor H and factor H-related genes with systemic lupus erythematosus susceptibility. PLoS Genet. 2011; 7:e1002079. [PubMed: 21637784]
33. Imielinski M, et al. Common variants at five new loci associated with early-onset inflammatory bowel disease. Nat Genet. 2009; 41:1335–40. [PubMed: 19915574]
34. McGovern DP, et al. Genome-wide association identifies multiple ulcerative colitis susceptibility loci. Nat Genet. 2010; 42:332–7. [PubMed: 20228799]
35. Litinskiy MB, et al. DCs induce CD40-independent immunoglobulin class switching through BLyS and APRIL. Nat Immunol. 2002; 3:822–9. [PubMed: 12154359]
36. Kunisawa J, et al. Microbe-dependent CD11b+ IgA+ plasma cells mediate robust early-phase intestinal IgA responses in mice. Nat Commun. 2013; 4:1772. [PubMed: 23612313] 37. van Egmond M, et al. Human immunoglobulin A receptor (FcalphaRI, CD89) function in
transgenic mice requires both FcR gamma chain and CR3 (CD11b/CD18). Blood. 1999; 93:4387– 94. [PubMed: 10361137]
38. Van Spriel AB, Leusen JH, Vile H, Van De Winkel JG. Mac-1 (CD11b/CD18) as accessory molecule for Fc alpha R (CD89) binding of IgA. J Immunol. 2002; 169:3831–6. [PubMed: 12244179]
39. Bevins CL, Salzman NH. Paneth cells, antimicrobial peptides and maintenance of intestinal homeostasis. Nat Rev Microbiol. 2011; 9:356–68. [PubMed: 21423246]
40. Wehkamp J, et al. Reduced Paneth cell alpha-defensins in ileal Crohn’s disease. Proc Natl Acad Sci U S A. 2005; 102:18129–34. [PubMed: 16330776]
41. Sokol H, et al. Card9 mediates intestinal epithelial cell restitution, T-helper 17 responses, and control of bacterial infection in mice. Gastroenterology. 2013; 145:591–601. e3. [PubMed: 23732773]
42. Liu JY, et al. Vav proteins are necessary for correct differentiation of mouse cecal and colonic enterocytes. J Cell Sci. 2009; 122:324–34. [PubMed: 19139088]
43. Vigorito E, Gambardella L, Colucci F, McAdam S, Turner M. Vav proteins regulate peripheral B-cell survival. Blood. 2005; 106:2391–8. [PubMed: 15941910]
44. Freudenberg J, et al. Genome-wide association study of rheumatoid arthritis in Koreans: population-specific loci as well as overlap with European susceptibility loci. Arthritis Rheum. 2011; 63:884–93. [PubMed: 21452313]
45. Fumagalli M, et al. Signatures of environmental genetic adaptation pinpoint pathogens as the main selective pressure through human evolution. PLoS Genet. 2011; 7:e1002355. [PubMed: 22072984] 46. Pullan RL, Smith JL, Jasrasaria R, Brooker SJ. Global numbers of infection and disease burden of
soil transmitted helminth infections in 2010. Parasit Vectors. 2014; 7:37. [PubMed: 24447578] 47. Barry MA, Simon GG, Mistry N, Hotez PJ. Global trends in neglected tropical disease control and
elimination: impact on child health. Arch Dis Child. 2013; 98:635–41. [PubMed: 23793132] 48. Barsoum RS. Schistosomal glomerulopathy: selection factors. Nephrol Dial Transplant. 1987;
2:488–97. [PubMed: 3126449]
49. Ferragine CE, Walls CD, Davies SJ. Modulation of innate antigen-presenting cell function by pre-patent schistosome infection. PLoS Negl Trop Dis. 2013; 7:e2136. [PubMed: 23556020] 50. Ambruzs JM, Walker PD, Larsen CP. The histopathologic spectrum of kidney biopsies in patients
with inflammatory bowel disease. Clin J Am Soc Nephrol. 2014; 9:265–70. [PubMed: 24262508]