ITALIAN AGRICULTURE IN FIGURES 2014
SERIES: PUBLICATIONS OF TRENDS AND MACRO-ECONOMIC RESEARCH
IT
ALIAN A
GRICUL
TURE IN FIGURES 2014
I
NEA, established by Royal Decree no. 1418 of 10 May 1928 under Arrigo Serpieri, has its origins in the National Institute of Economy and Statistics founded in 1924, also by Serpieri.INEA was revamped with the Legislative Decree no. 454 of 29 October 1999, which was later mod-ified by Law no. 137 of 6 July 2002. INEA has scientific, statutory,
organ-isational, administrative and finan-cial autonomy, and is under the vigi-lance of the Ministry for Agricultural, Food and Forestry Policies (MIPAAF). The Institute engages in socio-eco-nomic research in the fields of agri-culture, agri-industry, forestry and fishing, at national, Community and international levels. To meet its goals, the Institute promotes research in cooperation with universities and
sci-entific institutions, nationally and internationally. With the decree of the President of the Republic, no. 1708 of 30 December 1965, INEA was desig-nated as a connecting body between the Italian State and the European Union, to set up and manage the Farm Accountancy Data Network (FADN). The Institute is part of the national statistical system (SISTAN) (Leg. Dec. 454/99, Art. 10).
Editing staff
Francesca Marras (head), Laura Aguglia, Paola Doria, Sabrina Giuca, Maria Carmela Macrì, Francesca Pierri, Roberta Sardone, Laura Viganò
Contributors
Laura Aguglia, Davide Bortolozzo, Lucia Briamonte, Silvia Coderoni, Simonetta De Leo, Paola Doria, Stefano Fabiani, Luca Fraschetti, Sabrina Giuca, Teresa Lettieri, Davide Longhitano, Flavio Lupia, Maria Carmela Macrì, Saverio Maluccio, Sonia Marongiu, Francesca Marras, Mafalda Monda,
Francesca Pierri, Maria Rosaria Pupo d’Andrea, Manuela Scornaienghi, Aida Turrini, Laura Viganò
English translation
Barbara Perna
Data processing
Fabio Iacobini and Marco Amato
Planning and layout
INEA’s Graphic office (Jacopo Barone, Piero Cesarini, Fabio Lapiana, Sofia Mannozzi)
Editorial coordination
Benedetto Venuto
Editorial secretarial staff
Roberta Capretti
Secretarial staff
Lara Abbondanza, Debora Pagani, Francesca Ribacchi
Internet edition
Massimo Perinotto
publication is available on the website http://www.inea.it/pubbl/ The copy is allowed by citing the source.
ITALIAN AGRICULTURE IN FIGURES 2014
Editing staff
Francesca Marras (head), Laura Aguglia, Paola Doria, Sabrina Giuca, Maria Carmela Macrì, Francesca Pierri, Roberta Sardone, Laura Viganò
Contributors
Laura Aguglia, Davide Bortolozzo, Lucia Briamonte, Silvia Coderoni, Simonetta De Leo, Paola Doria, Stefano Fabiani, Luca Fraschetti, Sabrina Giuca, Teresa Lettieri, Davide Longhitano, Flavio Lupia, Maria Carmela Macrì, Saverio Maluccio, Sonia Marongiu, Francesca Marras, Mafalda Monda,
Francesca Pierri, Maria Rosaria Pupo d’Andrea, Manuela Scornaienghi, Aida Turrini, Laura Viganò
English translation
Barbara Perna
Data processing
Fabio Iacobini and Marco Amato
Planning and layout
INEA’s Graphic office (Jacopo Barone, Piero Cesarini, Fabio Lapiana, Sofia Mannozzi)
Editorial coordination
Benedetto Venuto
Editorial secretarial staff
Roberta Capretti
Secretarial staff
Lara Abbondanza, Debora Pagani, Francesca Ribacchi
Internet edition
Massimo Perinotto
publication is available on the website http://www.inea.it/pubbl/ The copy is allowed by citing the source.
Now in its 27th edition, the “Italian Agri-culture in Figures”, edited by the National Institute of Agriculture Economics, repre-sents a source of information on the trend of the Italian agro-food system, and it de-picts a detailed picture of the main activi-ties in the agricultural and agro-industrial sector, thus providing a support, also to the institutional stakeholders, aimed at understanding a strategic sector for the Italian economy.
The data highlight that the Italian agricul-ture has contributed to a greater extent to the development of the national value added, thus reaching 2.1% so much as to exceed the average of the EU countries. Even the value of the output in agricul-ture, forestry and fishing is increased by 3.3%, a result which has allowed, there-fore, to reach 56.1 billion euro.
There is still so much to do, there is awareness of the critical points which require a targeted action as, for instance, the issues relating to the red tape, the
access to credit and the generational change. In order to cope with these issues, the Government has decided to intervene urgently through the Legislative Decree “Competitiveness” and, in particular, with the envisaged measures “Campolibero”. Many measures are expected in order to support the young people, such as the mortgages at zero rate, deductions of 19% to people aged less than 35 who are rent-ing lands, and the reduction of 1/3 of the gross wage for more stable hiring. The young people are looking at the agricul-tural sector with ever more interest, from when they choose the type of study, this is why the agriculture should provide a concrete working possibility. Are then ex-pected IRAP deductions, which can reach up to 10,500 euro for hiring young people and women in the southern regions. It has been also created the unique register of controls, it has been extended the use of the injunction before applying administra-tive sanctions, and it is expected the
dem-aterialization of the registers. In order to support the growth and the development of the agricultural firms, three tax cred-its have been established: two at 40% for investments up to 400 thousand euro, for innovation and networks of business, and another one at 40% up to 50 thousand euro for the e-commerce.
Furthermore, within the community ag-ricultural policy, important choices have been taken for the future and the re-launch of the national agro-food sector. In the next seven years, 52 billion euro will be available for investments. It has been allocated a share equal to 11% , more than 426 million euro, for the coupled aid, by fo-cusing resources mainly on those sectors most in need, such as the livestock sector for meat and milk, the arable, the protein plan, durum wheat and olive growing, with the aim of gaining margins of efficiency and boost the productions “made in Italy”. An amount of 80 million euro has been al-located to the farms run by young people,
by increasing of 25% the direct aid for 5 years. Conversely, aid will no longer as-signed to banks, insurances, financial and real estate societies, in order to provide a concrete support to whom lives of agri-culture and contributes to the real growth of the sector. Useful are also the data achieved on the international commerce and the comparison with the agro-food systems and the performance of the other European countries. The export repre-sents one of the most important factor in which the Italian firms are investing, and the Government is providing a support strategy aimed at giving aid to the agro-food “Made in Italy”. The declared aim is that one of increasing the exports of the Italian food and wines, from 33 billion in 2013 up to 50 billion in 2020, also by
act-ing on the structural gaps which charac-terize the Italian supply chain.
The survey also highlights the decrease in the food consumption at the national level. It represents an issue to be deep-ened and a first useful measure has been taken by the Government, by allocating 10 billion euro for the increases of 80 euro in the wages, but there are still so many measures to be taken and which have to be boosted. On the other side, it should not be underestimated the growth of purchas-ing in some sectors, which is ever more increasing, such as the selling of organic products.
The data shown in this volume have shown the importance of the food and wine sec-tor in our culture, in our traditions and in many other aspects of our daily life.
The typical agro-food products represent, in fact, the main reason in the choice of touristic places to be visited, after art and culture. The importance of the relation-ship between food-culture and the deep vocation of the Italian regions do repre-sent a further opportunity of development for our agro-food “Made in Italy”, but we should, nonetheless, discuss and reflect on the difficult issues which relate to the food production. It is, therefore, interest-ing to analyze the section of the survey focused on the themes of nutrition, food habits and food waste. Let’s start meditat-ing, therefore, on important themes at the international level, which will represent the core of the world debate in the occa-sion of the universal Exposition in Milan.
The Minister of the Agricultural Food and Forestry Policies Maurizio Martina
Economy and agriculturE
Land and population pag. 10
Gross domestic product pag. 12
Value added pag. 14
Employment pag. 16
Productivity pag. 19
rEcEnt trEnds in thE sEctor
Land market pag. 22
Investments pag. 24
Credit pag. 26
Intermediate consumption pag. 28
Climate and water availability pag. 30
Production levels pag. 34
Prices and costs pag. 39
Agricultural income pag. 41
agro-industrial systEm
Components of the system pag. 44
Food industry pag. 46
Distribution pag. 51
Food consumption pag. 55
Foreign trade pag. 58
Food and thE Eating habits oF italians
The eating habits of Italians pag. 66
Food waste pag. 72
Wine and Food tourism in Italy pag. 75
The agro-food vocations of the territories pag. 78
Traditional agro-food products pag. 81
Farm structurE
Family-run farms pag. 84
Family manpower pag. 87
7 Economic rEsults oF Farms
Output and income pag. 92
Trends in the vegetable production pag. 95
Trends in the livestock production pag. 99
The Italian professional agriculture
in the European context pag. 103
EnvironmEnt and natural rEsourcEs
Agriculture and the greenhouse gas emissions pag. 118
Soil consumption pag. 121
Protected areas pag. 123
Use of chemicals pag. 126
Forests pag. 129
divErsiFication
Renewable energies pag. 134
Farm stays pag. 136
Educational farms pag. 138
Lands confiscated to the organized crime pag. 141
Quality products
Products of designated origin pag. 146
Organic farming pag. 149
Agro-food certification pag. 155
National quality systems pag. 157
agricultural policy
CAP in Italy: 1st Pillar pag. 160
CAP in Italy: 2nd Pillar pag. 164
Regional spending pag. 167
LANd ANd POPULATION
The extension of the national territory amounts to 302,071 square kilometers, of which 35.2% is represented by moun-tain, 41.6% by hill, whereas the remaining 23.2% is represented by plains.
In the period between 2008 and 2012, the Italian surface covered by protected areas is increased from 20.6% to 21.2% of the total. In the EU Countries this percentage is on average equal to 17.2%.
The available figures, calculated on the basis of geographical distribution, show a higher share of protected areas in the South (25.1%), whereas the North-West ranks in the last position with a value of 17.6%; the North-East and the Centre have respectively 18.7% and 19.0% of protected areas.
At the same time Italy has the highest per-centage (7.8%) of artificial covering of the soil, if compared to the European countries (EU-15); followed, at a short distance, by Germany (7.7%).
At 31st December 2013 Italy counted 60.8 million people, of which 4.9 million (8.1%)
Use of agricultural land (000 ha), 2012-2013
Italy EU-28
Total surface 17,277 214,578
Utilised agricultural area 12,885 172,920
Arable crops 12,885.19 30,133.00
Cereals (%) 6,711 103,138
Dried legumes (%) 48.8 55.6
Potatoes, sugar beets, hoed fodder crops (%) 1.0 1.2
Industrial plants (%) 1.4 3.0
Fresh vegetables, melons and strawberries (%) 4.5 11.6
Flowers and ornamentals (%) 6.3 2.0
Rotating fodder crops (%) 0.2 0.1
Seeds (%) 29.6 19.2
Fallow land (%) 0.4 0.2
Permanent crops 7.8 7.1
Vineyards (%)
Olive tree (%) 2,418 10,703
Fruit crops and other crops (%) 31.1 28.6
Kitchen gardens 46.5 40.8
Total permanent grasslands and pastures 22.4 30.5
Forested land annexed to farms
Kitchen gardens 32 350
Total permanent grasslands and pastures 3,434 57,945
Forested land annexed to farms 3,003 30,379
Non-utilised agricultural area and other land 1,220 11,273
Energy crops 17 480
11 were foreigners (ISTAT).
During 2013, the real increase of the inhab-itants, triggered by the natural dynamic as well as by the immigration, has registered a very modest increase, equal to 30,000 units (+0.1%). The natural trend of the population has marked a negative balance of about 86,000 units and, for the first time, even the foreign births have decreased (-2,189 compared to 2012), although repre-senting 15% of the total births.
According to a geographical distribution of the inhabitants, in the North-West live 16.1 million people (26.5% of the total), in the North-East 11.6 million (19.2%), in the Centre 12.1 million (19.9%), in the South 14.2 million (23.3%) and on the Islands 6.7 million (11.1%). The migratory trend, both inside and from abroad, in a downward trend compared to 2012, involves mainly the northern and central regions.
Emigrations are increasing, both those of the Italians and of the foreigners coming back to their country, amounting to almost 126,000 (2.1x1,000), against the 106,000
registered in 2012 (1.8x1,000). The foreign destination preferred by Italians is the UK, with almost 13,000 transfers, followed by Germany with 11,600. Many are the foreigners who leave our country to reach mainly Romania, more than 10,000 transfers in 2013 (+21% over 2012) and Albania, more than 2,000 transfers (+23%).
Italy is among the most populated coun-tries in the EU, with an average of about 201 inhabitants per square Km (the EU average is of about 116 inhabitants per square Km). Only Malta, Netherlands, Bel-gium, UK, Germany and Luxembourg have higher density. The lowest density is, on the other hand, experienced by Sweden and
Finland, with values accounting for lesser than 25 inhabitants per square Km. The statistics provided by Eurostat, regard-ing the rural development, reveal that in Italy only 20.3% of the population live in the countryside, against a European aver-age of 22.6%; in the cities the gap is even higher with values reaching 36.5% in Italy and 42.3% in the EU. The highest share of the population live, therefore, in the intermediate areas, where the percentage reaches 43.1% compared to 35.1% of the European average.
The total agricultural area in Italy amounts to 17.1 million hectares, of which 12.9 mil-lion are ascribable to the UAA (utilized ag-ricultural area).
Density of population mainly in the rural areas (inhabitants/square Km), 2012
Italy France Average EU 28 Spain 88.7 57.5 49.8 23.4
In 2013, the Italian economy experienced a further decrease in volume of the GDP equal to 1.9%, after having reached -2.4 in 2012. The recession, which started in the summer 2011, has ceased only in the last quarter of 2013, with an increase of +0.1% over the previous period. The lasting difficulties in the labor market and the uncertainties about the economic future have slowed down consumption as well as investments, thus triggering, once again, a contraction of the domestic demand. The net foreign
demand has provided the main push to the growth of the GDP, with a slight positive in-crease in the exports, counterbalanced by a reduction in the imports.
Also the EU has highlighted a deadlock in the
economy (+0.1%), with a total contraction of 0.4% in the euro zone. Germany and France are in a slightly upward trend with respec-tively +0.4% and 0.3%, whereas the GDP in Spain continues to decrease (-1.2%). The
GROSS dOMESTIC PROdUCT
Trend in GDP per inhabitant (euro) GDP/inhabitant
Years Values at
current prices Chained values*
2008 26,326 24,659 2009 25,247 23,165 2010 25,658 23,451 2011 26,019 23,463 2012 25,727 22,839 2013 25,554 22,363
* The chained values express the real trend (in quantity) of the economic aggregate with reference to the year 2005
Source: ISTAT
GDP at current prices GDP at chained prices
0 320,000 640,000 960,000 1,280,000 1,600,000 2010 2009 2008 2011 2012 2013 1,560,024 1,365,227 Trend in GDP in Italy (million euro)
13 situation in Greece and Portugal is
improv-ing, although always with negative values of the GDP (-3.9% and -1.4%, respectively). In the rest of the world the trend of the economic activity of the main developed countries has been on the whole mediocre, although with signals of strengthening; in the emerging economies the growth has been contained compared to the five-year period prior to the world crisis.
In particular, the world product is increased by 3%, against 3.2% over the previous year, and the slowdown has affected both the advanced economies, whose growing rate has decreased from 1.4% to 1.3%, and the emerging economies, which experienced a decrease from 5% to 4.7%.
Compared to 2012, the growth of the GDP in Japan has been more contained (+1.6%), and it has been boosted by private consump-tion (+2%) as well as by a strong accelera-tion of public investments (+11.4%) and private residential investments (+8.9%). In the United States the growth has suffered a slow-down, reaching 1.9%, but it was
strengthened in the second part of 2013 thanks to private consumption and exports. In China the growth rate of the GDP has been the same of what registered in 2012, that is 7.7%, due both to cyclical factors and structural factors, mainly demograph-ic, which affect the long-term prospects.
In India the economic growth rate is de-creased to 4.4%, mainly due to the weak-ness in the investments. In Brazil, instead, GDP is increased by 2.3%, thanks to the recovery in the spending for investments, which increased by 6.3%, as well as to the good trend of domestic consumptions. Trend in GDP in some main areas and countries (% changes over the previous year in real terms)
Country Share of world GDP in 2012 2009 2010 2011 2012 2013 Industrialised countries United States 19.3 -2.8 2.5 1.8 2.8 1.9 Japon 5.4 -5.5 4.7 -0.5 1.4 1.6 Euro zone 13.7 -3.8 1.9 1.8 -0.6 -0.4 United Kingdom 2.7 -5.2 1.7 1.1 0.3 1.7 Canada 1.8 -2.7 3.4 2.5 1.7 2.0
Emerging and developing countries
Brazil 2.8 -0.3 7.5 2.7 1.0 2.3 Mexico 2.1 -4.7 5.1 4.0 3.9 1.1 China 15.4 9.2 10.5 9.3 7.7 7.7 South Corea 1.9 0.7 6.5 3.6 2.3 3.0 India 5.8 6.6 9.3 7.7 4.8 4.6 Russia 2.9 -7.8 4.5 4.3 3.4 1.3 Turkey 1.3 -4.8 9.2 8.8 2.1 4.0
In 2013, the total value added, in volume, has suffered a decrease of 1.6%, in slight rise compared to the decrease of 2.2% reg-istered in 2012; at current values, the de-crease has been more contained and equal to 0.2%. For the agricultural, forestry and fishing sector, the year 2013 has repre-sented a recovery year, after the bad per-formance registered in 2012. In particular, the value added of the sector is slightly increased by 0.3% in real terms, whereas the variation of the same at current prices has amounted to +5.6%. Therefore, the production prices have registered again an increase, although in attenuation during the second semester of the year.
Worthy of note is the diversified trend of the primary sector among the various geographical areas: in a strong worsening are the northern-western regions (-3.4%), then the Islands (-2%) and, in a less measure, the central regions (-1.2%); in a clear recovery is, instead, the North-East (+4.7% from -7.5% in 2012) after the deep
decrease of the added value in the previous year; the South has shown a slight positive increase (+0.6%).
Differently from agriculture, all of the other productive sectors have experienced a strong decrease of the production: build-ings (-5.9% in 2013, from -5.6% of the previous year) and industry, in its nar-row sense1, (-3.2% compared to -3.0% of 2012). Services, on the contrary, have reg-istered a less marked decrease (-0.9% com-pared to -1.6% of 2012); in a downward trend is the IT & communication sectors (-4.3%), as well as for the wholesale and retail (-2.2%), whereas the real estate ac-tivities and the professional acac-tivities have remained stable, thus showing a growth in the value added equal to +0.4% compared to 2012.
In 2013 also the food industry has expe-rienced a negative result, thus suspend-ing the positive trend highlighted as from 2010, by registering a negative variation of the value added, in volume, equal to -1.5% compared to 2012.
VALUE AddEd
18.3% 5.6% 74.0% 2.1%Agriculture, forestry and fishing Industry Buildings Services, including public sector TOTAL 30,045 255,964 78,451 1.034,831 1,399,291 % share of the value added at basic prices by sec-tor, 2013 - Values at current prices
Source: ISTAT
1 mining activities, manufacturing, energy, etc., exclud-ing constructions.
15 * Value added at basic prices - current values
Source: Eurostat The contribution of the Italian agriculture
to the national value added is slightly in-creased, reaching 2.1%; it slightly exceeds the average of both the EU, and of the whole of the countries in the euro zone (1.7%).
% share of the agricultural value added* on the total value added of the EU countries, 2013
Country % Country %
Romania 6.4 Portugal 2.4
Bulgaria 4.9 Czeck Republic 2.4
Latvia 4.9 Italy 2.1 Hungary 4.8 Ireland 1.9 Croatia 4.4 France 1.8 Estonia 3.9 Netherlands 1.6 Lithuania 3.8 Malta 1.6 Poland 3.8 Austria 1.5 Greece 3.7 Sweden 1.5 Slovakia 3.0 denmark 1.3 Slovenia 2.9 Belgium 0.8 Finland 2.8 Germany 0.8 Cyprus 2.7 UK 0.6 Spain 2.6 Luxembourg 0.3
Euro zone (18 countries) 1.7
In 2013, the employment in Italy has suf-fered the worst performance since 2008, year in which the crisis has begun. The people involved in agriculture are de-creased by 4.2%, with a much stronger decrease for the employees (-4.7%) than for the self-employed (-3.6%). The decrease has mainly affected the North-East (-9.9%) and the South (-4.1%), except for the North-West, where the employment has been stable and where there has been an increase of the young people (+5.6% in the category of people aged between 15-34), thus increasing by 1 percentage point its incidence on the total, and reaching 20.6%. Con-versely, in the whole situation of Italy, the youth employment has been affected by a strong downsizing (-8%), thus de-creasing its incidence down to 19.2% compared to the 20% registered in 2012. On the whole, the number of the employ-ees in agriculture reaches almost 814
thousand of units (of which 28.2% are women), and they are distributed as fol-lows: 15.9% in the North-West, 20.6% in the North-East, 14.2% in the Centre and the remaining share – almost the half – in
Source: ISTAT, continuous survey on the workforce
EMPLOYMENT
Workers in agriculture and in the total economy, by age group and geographical area (%), 2013 Age 15-34 Age 35-64 65 and over Total
workers (000)
Empolyed (%) North
Agriculture, forestry and fishing 17,5 71,3 11,2 297 32,5
Total economy 23,8 74,1 2,1 11.776 76,5
Centre
Agriculture, forestry and fishing 19,9 70,8 9,2 115 45,3
Total economy 23,1 74,8 2,1 4.746 74,7
South
Agriculture, forestry and fishing 20,2 76,8 2,9 401 64,5
Total economy 23,8 74,7 1,4 5.899 73,3
Italy
Agriculture, forestry and fishing 19,2 73,9 6,8 814 50,1
17 Agriculture, forestry and fishing
Mining and manufacturing activities Buildings Services TOTAL 1,165.7 4,235.1 1,627.4 16,267.2 23,295.4 18.0% 70.0% 5.0% 7.0%
Foreigners employed in agriculture by geographical area (000) Total working units (000), 2013
Source: ISTAT, national accounting
Source: Istat, Continuos survey on the workforce
2011 2012 2013 North Males 30 34 31 Females 7 7 9 Total 37 41 39 Centre Males 21 23 23 Females 3 5 5 Total 24 28 28 South Males 30 33 31 Females 12 12 12 Total 42 45 43
n. of Foreigners on total Employed in agriculture
Italy Males 13,4 14,9 14,5
Females 9,0 10,0 11,3
Total 12,1 13,5 13,6
the South. It is increased the share of the part-time employees, thus reaching 13.5% of the total employment in agriculture. The incidence of the foreign workers in agriculture, on the whole stable, seems
to be strongly increased in the North-East, where it reaches 16.7% (in 2012 it was 13.7%) and it persists in being very high in the Centre, where one employee on four is foreign.
The employed people in agriculture in the EU (%), 2013 Employed in agriculture/total employed
(15 years
and more) incidencewoman’s 1
Austria 4.2 44.6 Belgium 1.3 28.7 Bulgaria 6.5 31.5 Cyprus 2.5 23.9 Croatia 10.5 42.2 denmark 2.3 19.4 Estonia 4.3 25.9 Finland 3.8 27.8 France 3.0 28.7 Germany 1.3 32.8 Greece 13.3 39.9 Ireland 4.8 12.5 Italy 3.4 28.9 Latvia 7.8 29.6 Lithuania 8.4 37.0
Employed in agriculture/total employed (15 years
and more) incidencewoman’s 1
Luxembourg 1.4 26.5 Malta 1.2 : Netherlands 1.9 27.9 Poland 11.7 40.5 Portugal 6.5 37.7 UK 0.9 27.0 Czeck Republic 3.0 29.2 Romania 25.7 44.5 Slovakia 3.3 22.4 Spain 4.2 23.8 Sweden 1.8 23.6 Hungary 4.9 25.2 EU 28 4.5 35.6 EU 27 4.5 35.5 Eurozone (18 countries) 3.1 30.5
1 On the total employed in agriculture Source: Eurostat, Labour Force Survey
19 Work productivity - value added at basic prices per worked hour - indices 2005=100
PROdUCTIVITY
The worsening of the recent economic conditions has led to a decrease in the em-ployment and in the working-hours, thus affecting the dynamics of the value added and productivity. In 2013, the productivity for the whole of the economic activities is increased by 0.4% (-0.7% in 2012) if it is measured in terms of real value added per working hour, as a consequence of a de-crease in industry (-2.1%), in its narrow sense, but nonetheless offset by an increase in the constructions (+4%) and in the ag-ricultural sector (+1.9%). These dynamics are, nonetheless, the consequence of nega-tive variations which have affected both the value added, and, to a greater extent, the use of the work factor with a sharp reduction of the worked hours for quite all the sectors of the economy. As for the agricultural sector, in particular, the reduction of the worked hours has amounted to 1.6%, in recovery after the sharp decrease of 2012 (-5.8%). As for the trend in these latest years, it should be pointed out that the agricultural sector shows, since 2010, an increase in
productiv-Buildings Agriculture, forestry and fishing
Industry, in its narrow sense
80 85 90 95 100 105 110
Services Food, beverage and tobacco industries
2005 2006 2007 2008 2009 2010 2011 2012 2013
ity, which is ascribable to the substantial de-crease of farms and employment, family-run or not used. Once again, therefore, the pri-mary sector contrasts the trend detected in most of the productive sectors, thus show-ing its structural peculiarities. The food
industry, conversely, shows a productivity trend which is in line with the average of the industry, and the positive growing rate, registered since 2009, is ascribable to a re-covery of the productive activity against a lesser loss of work.
LANd MARKET
In 2013, for the second year in a row, the land market has shown a decrease in prices (-0.4%), which reach an aver-age value of about 20,000 euro per hec-tare. The most sizeable decreases have been registered in the northern-eastern regions (-1%), but this trend has none-theless affected 11 regions out of 20. Taking into account the annual inflation, the prices of lands, in real terms, have highlighted an even more considerable decrease (-1.6%): the average land value, in real terms, amounts to 92%, compared to the same level registered in 2000, thus confirming a progressive loss in the value of the land heritage. The land market has experienced a moderate buying and sell-ing activity, in the same way as experi-enced in the urban real estate market. The demand for lands has been negatively affected by the difficulties in accessing to credit, and by the unexciting economic ex-pectations. The turnaround in the policy for the renewable energy sources has
contributed furthermore to the reduction in the exchanges, being now the policy characterized by greater restraints for the photovoltaic systems on land, and by a reduction in the incentives. The demand for land is mainly boosted by the owners of the medium-large sized farms, who are interested in increasing the extension of their companies. They have also been pointed out cases of abandon of the activi-ties by workers from extra-agricultural
sectors, who sell their lands in order to obtain cash, or because of management difficulties. In terms of territory, it is con-firmed the gap in the land prices between the northern regions and the central-southern regions, as well as between the areas located in the plains and those in the mountains. The average land values hide an extreme variability, often linked to the quality productions which are lo-cated in delimited areas where the land Figures presented in this table cannot be compared to those published in the previous volume because the land values data bank is being updated
Source: INEA, Land values data bank
Average land values (thousand euro/ha), 2013
Altitude zone % change
2013/12 Inland
mountain mountainCoastal Inlandhill Coastalhill Lowland Total
North-West 6.1 16.3 24.4 84.3 34.1 26.5 0.2 North-East 30.2 - 42.0 30.9 46.0 41.6 -1.0 Centre 9.3 21.3 14.7 16.8 22.5 14.8 -0.1 South 6.5 10.0 12.2 17.1 17.6 12.9 -0.4 Islands 5.7 7.2 7.5 9.0 14.2 8.6 0.2 Total 11.8 9.0 15.5 14.8 32.3 20.1 -0.4
23 Average land values by agricultural region for 2013, (thousand euro/ha)
supply is very scarce compared to the high demand by the sector stakeholders. An example may concern the vineyards and the lands reserved to the specialized vegetable and fruit crops. On the other hand, it has been observed a greater use of the lease, as a mean to enlarge the farm area. This kind of ownership represents 38% of the national agricultural area (4.9 thousand hectares) and it seems mostly spread in the northern regions, where the demand is boosted by outside contrac-tors and by the livestock farms that are looking for lands to discharge the animal waste. In the southern regions it has been noticed a greater dynamism than in the coastal areas, where the demand is tied to more intensive forms of agriculture.
Source: INEA land market data bank
< 10 from 10 to 20 fron 20 to 40 fron 40 to 60 from 60 to 100 > 100
INVESTMENTS
The year 2013 continues to experience a decrease in the gross fixed investments in agriculture, in real terms, thus registering a decline of 4%, in addition to that one more considerable of the last year (-9.9%). Compared to 2012, the incidence of the agricultural investments on the national total is slightly increased, reaching 3.8%, whereas it is decreased the ratio with the agricultural value added (from 37% in 2012, to 33.8% in 2013). These results arise from the missed investments in the sector, but also from the negative dynamic of the investments for the entire economic system (-4.7% at chained prices), and from the substantial positive change (+5.6%) of the agricultural value added at current prices, compared to 2012. Since 2007 the total investments are decreased by about 27%, with a decline of nearly 15% during the last three years; the propensity to in-vest is decreased by 4 percentage points, dropping down to 17.4% of the GDP. The uncertainties about the perspectives of the economic activity, the difficulties in
access-ing to credit, and the increase in quantities of unused production, all have led to a re-duction in the accumulation of the differ-ent economic sectors. The investmdiffer-ents per working unit in agriculture have reached a value equal to 7,314 euro , down by 2.4% compared to 2012. It should be pointed out that these values have been deeply affected by the dynamic of the use of work in the
agricultural sector; the last five years have experienced a decrease of 7.1% in the work-ing units employed in agriculture, against a variation of the gross fixed investments in the sector equal to -6.9%.
The allocation by type of goods, referred to as the whole of the economic activities, has shown a negative variation for the in-vestments (in terms of volume), in crops Trend in gross fixed investments in agriculture
Years Current values Chained values * % in1
million euro million euro tot, Invest, agricultural VA
2007 11,897 11,193 3,6 41,4 2008 11,841 10,779 3,6 41,0 2009 10,353 9,159 3,5 39,3 2010 11,060 9,686 3,7 42,0 2011 11,476 9,865 3,8 40,8 2012 10,517 8,884 3,7 37,0 2013 10,163 8,526 3,8 33,8
* Chained values: express the real dynamic (in volume) of the economic aggregate with reference to 2005. 1 Incidence on the values expressed at current prices; agricultural VA at basic prices
25 and in livestock (-6.1%), compared to
2012, which unfortunately joins the nega-tive results registered in the previous two years. In the same way, also the other cat-egories have registered a downward trend with a decrease of 6.3% for plants and machineries, 7.8% for the non-residential buildings and works, 6.7% for buildings, 6.2% for housing; the only exception has been registered for the transport means with a positive variation of 12.9%.
Regard-ing the dynamic of the capital stock in agri-culture, expressed in volume and at net of amortizations, it should be highlighted a further decline of 2.0%, compared to 2012. Conversely, the variation in the net capital stock per worker in agriculture has been lower (-0.4%), as a consequence of the concomitant decrease in the number of em-ployees in the sector. Actually, the issue of investments in agriculture is very thorny, and from the relative figures arise
peculi-arities that represent also the critical is-sues of the sector. The main remark con-cerns the incidence of the amortizations on the agricultural value added, which in 2013 has amounted to 48%, which is much higher than the European average (about 38%). It seems that on the high incidence of the amortizations have influenced years of policies aimed at favoring the fulfilment of firm investments, besides the natural evolution of the sector.
Gross fixed investments: characteristic relationships by main sector, 2013 *
Agriculture Industry in the narrow sense Constructions Services1 Total
Investments per working unit
euro 7.314 12.260 5.048 10.046 9.963
% change 2013/12 -2,4 -4,2 6,8 -3,3 -2,9
Net capital stock per worker2
000 euro 165,1 157,8 73,5 245,6 213,6
% change 2013/12 -0,4 -0,6 8,7 1,5 1,7
* Chained values, reference year 2005 1 Including investments in housing 2 Net of depreciation
The bank loans to agriculture, forestry and fishing have reached, by the end of 2013, an amount of 44.1 billion euro, with an inci-dence of the agricultural loans on the total economy equal to 4.9%. It should be noticed that, on the whole, the uses for the agricul-tural sector have suffered in 2013 a slight decrease over 2012 (-0.3%), compared to a lasting negative variation of the same distributed for the whole of the industries (-5.5%).
The breakdown of the uses, by geographi-cal macro-area, shows that the northern re-gions own most of the loans, with a share of 61.7% on the total uses for the agricultural sector. In particular, the North-West has shown a very light upward trend compared to 2012, with a variation of +0.6%, where-as the North-Ewhere-ast hwhere-as registered a -0.1%. Similarly, the central and southern regions, along with the Islands, have registered negative variations of the loans for the ag-ricultural sector, amounting respectively to -0.3%, -1.2% and -2.5%.
CREdIT
1 Including forestry and fishing
2 Production, at basic prices, for agriculture, forestry and fishing, at current values Source: Bank of Italy and ISTAT
*Outstanding loans with maturity of over one year Source: Bank of Italy
Bank lending for agriculture, December 2013
Lending to agriculture beyond the short term, December 2013* Agriculture1
(million €) % of totallending % of agricultural production2
North-West 12,424 3.9 103.4 North-East 14,786 6.1 96.3 Centre 8,535 4.2 106.2 South 5,188 5.5 39.9 Islands 3,163 7.5 47.5 Total 44,096 4.9 80.1
Type (million €) 2013/2012 (%) Easy-term loans to tot (%)
Machinery and equipment 5,087 -5.9 4.5
Construction and rural buildings 6,261 -8.4 1.8
Other rural structures 2,722 -2.0 6.4
27 Ratio of non-performing loans to the agricultural sector and total economy (%)
The ratio between the bank uses and the ag-ricultural output amounts to 80.1%, down by about 3 percentage points compared to the value in 2012; the financial credit of the sector remains high, and the information released by the Bank of Italy show that, also in 2013, the trend in the short-term loans has suffered a smaller decrease than the medium-term loans, due to the need to cope with the current expenses.
In particular, the uses for the loans beyond the short-term have decreased by 6.3% over 2012. This result is the consequence of a general decrease in the loans, with a still strongly negative variation for the loans in buildings and rural constructions (-8.4%), followed by the loans for machineries and equipment (-5.9%), and those for other ru-ral assets (-2%).
Regarding the offer there is, as from the fourth quarter of 2013, a softening of the restraints for accessing to credit.
The increase in the credit risk (measured from the ratio between gross suffering /
uses) has been remarkable also for the agricultural sector, amounting to 11.3%, although less than what calculated for the whole of the economic activities (14.7%), thus leading to a growth of the share of secured loans equal to +22.8% over 2012. On the whole, they have been increased the real warranties and those provided by those who manage public resources, thus
ensuring to the intermediaries a greater chance in recovering credit in case of in-solvency.
At last, It should be highlighted that, in the 4th quarter 2013, the agricultural, forestry and fishing sectors have registered a real cost for the loans (Italian TAEG) equal to 4.90%, down compared to the same period of the previous year (5.10%).
4th quarter 2012 1st quarter 2013 2nd quarter 2013 3rd quarter 2013 4th quarter 2013 0.0 3.0 6.0 9.0 12.0 15.0 14.7 10.0 10.1 10.510.8 11.3 11.8 12.413.4 14.1
Agriculture, Forestry and Fishing Total
INTERMEdIATE CONSUMPTION
In 2013, the spending for intermediate con-sumption for the entire sector of agriculture, forestry and fishing has reached 25,029 thousand euro, thus showing an increase in value of 0.7% compared to 2012, as a result of an increase in prices (+2%) and a decrease in the quantities used (-1.3%). In relation exclusively to the agricultural sector, excluding therefore forestry and fish-ing, the main categories of intermediate con-sumptions have registered a decrease in the quantities used, as never happened in the previous years. In particular, down are the re-uses (-5.4%), fertilizers (-1.9%), motive energy (-1.8%), animal feed (-2.1%), seeds (-1.6%), credit and insurance (-1.5%), com-mercial mediation both financial and credit (SIFIM) (-2.3%). The only item in increase is that relating to the plant protection prod-ucts (+1.8%).
Conversely, the increase in prices has af-fected not only the plant protection products (+3.8%), but also other categories of inter-mediate consumptions: first of all the
ani-5.7% 29.0% 3.5% 6.5% 13.8% 10.3% 31.0% Seeds
Feedingstuffs and miscellaneous expenses for livestock Fertilizers Plant protection products Motive energy Redeployments Other goods and services
1.378 6.993 1.571 850 3.332 2.491 7.475
Percentage breakdown of intermediate consumption in agriculture (million euro), 2013
Source: ISTAT
mal feed (+4.8%) and the re-uses (+4.8%), as well as the prices of the SIFIM (+2.9%), seeds (+2.5%), and the expenditures for the stables of the animals (+1.7%).
The forestry intermediate consumptions have amounted to 90.5 thousand euro with a reduction in the quantities used of 1.3% and of the value of 1.4%; those for fishing and aquaculture have reached a value of 850 thousand euro with a decrease, in terms of
volume, equal to 2.3%, and a slight increase in prices (+1.1%).
The incidence of the intermediate consump-tions on the agricultural output, including forestry and fishing, is decreased, at cur-rent prices, from 46.6% in 2012, to 45.4% in 2013.
At a European level this index has regis-tered an average value of 60.1%, essential-ly stable compared to 2012. Itaessential-ly brings up
29 the rear, with a value substantially inferior
than the European average, and similar to that one of the Mediterranean countries, such as Spain and Greece. This reflects the
different kind of agriculture performed in the EU, as well as the different structure of costs. To better understand, it is inter-esting analyzing, separately, the incidence
of the intermediate consumptions used for the vegetable production, and those used for the animal production. In 2013, the av-erage European incidence for the vegetable production has amounted to 20.1%, against the 14.1% of Italy, whereas for the livestock production the incidence has amounted to 61.3%, on average for the EU-28, against the 56.7% of Italy. The trend, during the years, is characterized by a general in-crease in the incidence of the intermediate consumptions on the production, in all the countries, with an higher rhythm for the in-puts used in the animal production: in Italy there has been an increase from 51.7% of 2005, to 56.7% of 2013, as a consequence, essentially, of the increase in the costs for livestock feed.
The comparison between the trend in the use of the intermediate consumptions in It-aly and in the average of the EU-28, doesn’t show remarkable divergences up until 2010, year during which it is experienced a gap and a decrease in the used inputs and of the production.
Incidence of intermediate consumption on the agricultural production in the EU-28*
Latvia Slovakia Ireland Luxembourg Czeck Republic Germany Belgium Sweden Denmark Netherlands Slovenia Finland Estonia UK Hungary Portugal Bulgaria France Lithuania EU-28 Austria Croatia Poland Romania Cyprus Malta Grrece Spain Italy 79.7 76.5 74.4 73.2 72.8 72.5 72.5 72.0 67.0 66.8 66.7 66.5 65.0 64.5 64.4 64.1 62.7 62.5 61.5 60.9 60.3 46.547,3 49.5 49.652.5 56.959.8 60.3
1 Agricultural production of goods and services at basic prices and intermediate consumption evaluated at current prices Source: Eurostat
CLIMATE ANd WATER AVAILABILITY
1 The year 2013, from the point of view ofthe weather conditions, has been char-acterized by frequent anomalies, both in temperature and in rain, which have trig-gered on our country serious problems to the agricultural sector.
The beginning of the year has suffered a surplus in rainfalls, ranging between +120% and +180%, mainly in March and in the North. This has hampered and slowed down the spring plantings and the related procedures of weeding and top-dressing of the wheat. The snow, which has affected some of the central-northern regions (Liguria, Lombardy, Piedmont, Fri-uli, Emilia, Tuscany and Lazio), has ham-pered the distribution on the fresh prod-ucts (vegetables and milk). The increase in the costs for the heating of nurseries and stables has burdened the farm’s bal-ance sheet, triggering, furthermore, prob-lems related to asphyxiation conditions and unexpected drops in temperature on
the crops planted. Especially March has suffered, more than the other months, of the weather conditions, in terms of dam-age to the sector, thus highlighting a wide-spread scaremongering by the producers of the first fruits of spring (strawberries, asparagus, broad beans, artichokes) that have suffered the frost periods in the same way as the fruit trees.
The weather’s instability has continued also during the spring, mainly in May, with intense rainfalls and temperatures inferior to the average in the North of Italy, in addition to the hails that have engendered difficulties during the proce-dures of weeding and topdressing of the wheat, but also during the production of the typically spring-crops (peas, radish, potatoes, carrots), as well as for the crops cultivated in the nurseries. Those which have advantaged from this trend have been the aquifers and the main Italian water-sources. A first monitoring, carried
out at the end of May in the North of Italy, has pointed out a complex hydrogeological situation with widespread overflowings and inundations, with damages reaching -50% for hay, -40% for maize, -50% for the vineyards and -75% for vegetables. The last phase of the hail of the season has affected Pescara, Teramo and Ascoli Piceno, where vineyards, nurseries and fields of wheat, fruit and grapevine have been destroyed.
The heat waves, that on several occasions have hit the peninsula during the summer, have been nonetheless interrupted by in-stability phenomena, causing storms and damage to the crops in Piedmont, Lom-bardy, Liguria and some areas of Tuscany and Umbria. September, usually hot and rarely rainy, has jeopardized again the agricultural sector for the weather alerts relating to the risk of hail. Another nega-tive year for maize that has undergone a late seeding, thus registering unsatisfac-1 Information and figures are taken from the technical report “Quarterly national note on climate trends and the implications for agriculture”, issued by INEA as part of the project “Support and technical assistance to natural disaster fund planning”.
31 Minimum average regional temperatures – deviation of 2013 values from
av-erage 1971-2000 – in °C Maximum average regional temperatures – deviation of 2013 values from average 1971-2000 – in °C
Source: INEA processing of CRA-CMA figures Source: INEA processing of CRA-CMA figures
-1.0 - 0.0 0.0 - 0.8 0.9 - 1.4 1.5 - 1.8 1.9 - 2.3 -5.3 -5.2 - 0.6 -0.5 - 0.0 0.1 - 1.0 1.1 - 1.7
tory results in quality and quantity; even the barley has suffered damages with the onset of pathologies. Tomatoes have suf-fered the delay in the soil preparation, due to the strong rainfalls and to the devasta-tion of hundreds of hectares in the areas of Cremona, Mantua, Reggio Emilia, after the first half of July. The closing of the year, with the Autumn, has suffered many anomalies both in temperatures and in rains, responsible of “extreme” phenome-na, mainly concerning temperature above the climate average. October is appeared to be a continuation of the summer sea-son, whereas November has suffered tem-perature leaps, thus having a first period exceptionally hot, and the second period cold. December is appeared to be on the whole temperate, although with rainy pe-riods in many regions, and very snowy in the medium-high mountainous areas. Storms have been registered in Puglia and Basilicata, between Taranto and the provinces of Brindisi and Metaponto. In Average regional precipitation – deviation of 2013 figures from average 1971-2000 – in %
Source: INEA processing of CRA-CMA figures
-8.6 - 0.0 0.1 - 10.0 10.1 - 20.0 20.1 - 30.0 30.1 - 39.9
33 the North, the damages have concerned
the rice-fields in Lombardy, next to the harvesting; vineyards and apple-trees in the area of Valtellina, due to the snowfalls and to the unexpected temperature leaps; the grape harvesting of the red wines in Piedmont, between Biella and Vercelli, that suffered hails in the area of Gatti-nara; the lemons “Interdonato” in Sicily, near Messina, due to an hail that has af-fected also internal roads and retaining
walls. Floods have also affected delim-ited areas in Sardinia, Abruzzo, Veneto, Lombardy, Campania and Calabria. In the Marche region the damages to the crops, as well as to the buildings flooded by wa-ter, because of landslides and inundations on the fields, have represented the main item of the declaration of natural disaster. In Abruzzo there has been the overflow-ing of many rivers and streams, in the surroundings of Pescara and Teramo. In
Umbria the most damaged areas, affected by landslides, were Gubbio, Todi, the upper area of Tiber, Foligno, Spoleto, Valnerina, where there have been damages to the provisions and to the breeding animals. In the second half of November, the Sardinia region has suffered an event which has obliged to declare the state of emergency, due to inundations and isolations of the agricultural structures, in addition to the losses of flocks and livestock.
PROdUCTION LEVELS
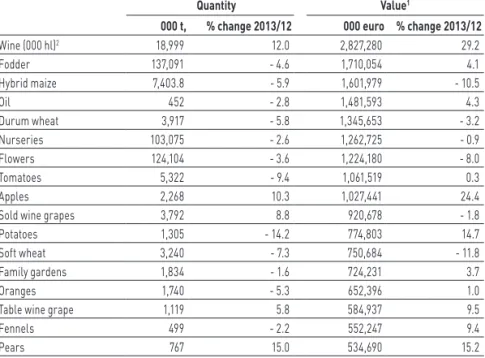
In 2013, the Italian primary sector has experienced a slight decrease in produc-tion (-0.4%), over the previous year, and an increase in prices by 3.7%. Therefore, the value of the output for agriculture,
forestry and fishing, measured at current prices, is increased by 3.3%, thus reach-ing 56.1 billion euro, includreach-ing secondary activities. The vegetable crops have influ-enced on the total output value by 49.5%,
livestock breeding by 31.3%, the activi-ties supporting agriculture by 12%, and the production of forestry and fishing for 5%. By analyzing the trend of each single sector, the value of the vegetable produc-tion is increased by 5.4%, thanks to the great performance of the woody crops (+12.9%). In a slight upward trend is the production value of the livestock sector (+1%), with a stable production value of meat (-0.5%), and an increase in that one of the dairy production (+2.5%). Still in increase is the value of the agriculture-related services (+3.5%), as well as sec-ondary activities, such as farm holidays and the processing sector (+2.8%), more seesawing during the last five years. Almost all of the main herbaceous vegeta-ble crops experience a decrease in quan-tities, whereas tree crops have pointed out a recovery by 3.9% compared to the negative results registered in the past years. In particular, it seem to be in a downward trend the production of: beet sugar (-18.4%), potatoes (-14.2%), to-1 Includes active and passive agricultural contract work, packaging of agricultural products, maintenance of parks and
gardens, services connected to livestock farming, artificial insemination, new productive facilities 2 Activities carried out in agriculture, such as farm stays, processing of milk, fruit, meat, etc. 3 Including secondary activities performed by other branches of the economy
Source: ISTAT.
Economic activities million Current vaues % change 2013/2012
euro % value quantity price
Herbaceous crops 14,193 25.3 0.1 -2.8 3.0
Fodder crops 1,710 3.0 4.1 -4.5 9.0
Tree crops 11,827 21.1 12.9 3.9 8.6
Livestock 17,557 31.3 1.0 -1.1 2.1
Support activities to agriculture1 6,665 11.9 3.5 1.2 2.2
Secondary activities2 1,583 2.8 2.8 1.2 1.6
Forestry 654 1.2 -0.1 -1.6 1.4
Fishing 1,880 3.4 -3.0 -4.3 1.3
Total3 56,068 100.0 3.3 -0.4 3.7
35 Output of goods and services in agriculture at basic prices - values at current prices (million euro), 2013
9.1% 14.7% 1.2% 2.4% 3.3% 8.4% 3.3% 11.1% 20.7% 10.1% 3.0%
12.8% Cereals and dried legumes1
Vegetables2
Industrial crops3
Flowers and ornamentals Fodder crops
Wine products Olives Fruit and citrus Meat Milk
Eggs and other4
Support activities to agriculture5
4,712 7,636 620 1,224 1,710 4,346 1,733 5,748 10,741 5,271 1,544 6,665
1 dried legumes (95 million euro)
2 of which potatoes (775 million euro) and fresh beans (310 million euro)
3 Sugar beets (100 million euro), tobacco (164 million euro) sunflowers (87 million euro), soybeans (236 million euro)
4 of which honey (37 million euro) Source: ISTAT
matoes (-9.4%), soft wheat (-7.3%), hy-brid corn (-5.9%), durum wheat (-5.8%), flowers (-3.6%); in an upward trend is, instead, the production of: minor cereals (+76.1%), soya (+49.3%) and the sun-flower (+40%). Concerning the wooded production, good performances have been registered by cherries (+22.5%), hazel-nuts (+17.7%), kiwi (+15.6%) and wine (+12.0%); in decrease is the production of walnuts (-2.6%), oil (-2.8%) and oranges (-5.3%).
In 2013, the livestock sector has shown a decrease in the overall quantity of meat produced (-1.5%), with increases only for pork and equine meat, respectively of +2.3% and +1.3%. Also the milk produc-tion is decreased, both in cow milk and in buffalo milk (-1.1%), as well as in sheep and goat milk (-0.8%). In a slight decrease is also the egg production (-0.9%), as a consequence of an increase in the quanti-ties produced (+1.8%) and a decrease in prices (-2.7%), unlike the honey produc-1 Output at basic prices at current prices
2 According to SEC95 methodology, the agricultural output includes wine and olive oil produced from the farm’s own grapes and olives, excluding those produced by coops and the food industry
Source: ISTAT
Quantity Value1
000 t, % change 2013/12 000 euro % change 2013/12
Wine (000 hl)2 18,999 12.0 2,827,280 29.2 Fodder 137,091 - 4.6 1,710,054 4.1 Hybrid maize 7,403.8 - 5.9 1,601,979 - 10.5 Oil 452 - 2.8 1,481,593 4.3 durum wheat 3,917 - 5.8 1,345,653 - 3.2 Nurseries 103,075 - 2.6 1,262,725 - 0.9 Flowers 124,104 - 3.6 1,224,180 - 8.0 Tomatoes 5,322 - 9.4 1,061,519 0.3 Apples 2,268 10.3 1,027,441 24.4
Sold wine grapes 3,792 8.8 920,678 - 1.8
Potatoes 1,305 - 14.2 774,803 14.7
Soft wheat 3,240 - 7.3 750,684 - 11.8
Family gardens 1,834 - 1.6 724,231 3.7
Oranges 1,740 - 5.3 652,396 1.0
Table wine grape 1,119 5.8 584,937 9.5
Fennels 499 - 2.2 552,247 9.4
Pears 767 15.0 534,690 15.2
37 tion which has instead registered a
fur-ther decrease in quantities (-5%), offset by the increase in price by 8.5%. Also the value of the forestry production is in slight decrease (-0.1%), whereas the
reduction has been more remarkable for fishing and aquaculture (-3%). In particu-lar, these results have been triggered by the negative variation in the quantities produced and by the average increase in
prices (+1.4% for forestry and +1.3% for fishing), which has managed only partially to weaken the negative performance. In particular, the fishing sector has shown , between 2012 and 2013, a downward trend for all of the best species. In 2013, the total fished volume of the Italian fleet has amounted to about 171,000 tons in seafood, with a value amounting to 1,048 thousand euro. The total value of the un-loading is decreased by 5% between 2012 and 2013. In the same period, the total vol-ume of the unloading is decreased by 25%. At European level, the agricultural year 2013 has been characterized by a positive variation in the value of production, at ba-sic prices (+1.1% compared to 2012), as a consequence of a slight decrease in prices (-0.9%) and an increase in the quantities produced (+2%). The increase in produc-tion, in terms of volume, has concerned most of the crops, and mainly the olive tree (+56.5%), vineyard (+14.8%), barley (+13.7%), cereals (+9.9%), wine (+7.3%) 1 Live weight
2 Output at basic prices at current prices Fonte: ISTAT.
Quantity1 Value2
000 t. % change 2013/12 000 euro % change 2013/12
Beef 1,333 - 4.5 3,373,095 - 5.8
Horsemeat 39 1.3 84,765 6.5
Pigmeat 2,064 2.3 3,077,592 3.6
Sheepmeat and goatmeat 59 - 3.4 187,678 - 4.0
Poultry 1,737 - 1.0 3,020,311 4.9
Rabbits and game 396 - 3.2 997,982 1.9
Cow milk and buffalo milk (000 hl) 111,281 - 1.1 4,813,890 2.2
Sheep and goat milk (000 hl) 5,369 - 0.8 457,477 6.4
Eggs (millions) 13,009 1.8 1,495,376 - 0.9
Honey 10 - 5.0 37,138 3.2
and dried fruit (+7.3%). Conversely, among the productions that suffered the most a decrease in the output, there is the rice (-5.5%) and the beet sugar (-4.6%). Compared to 2012, the value of production
for the livestock sector is increased, but such result is mainly ascribable to the in-crease in the average prices of production (+3.3%), considering the slight decrease in the quantities produced (-0.1%). The
de-crease, in volume, has concerned mainly the meat (-0.8%), whereas the produc-tion of milk and eggs have registered an increase equal to +1% and +2.6%, respec-tively.
Source: ISTAT.
2013 million € % share on total 2013 Current values % change 2013/12 Chained values % change 2013/12 Support activities
Outside contracts and rental of agricultural equipment 2,820.8 42.3 4.2 2.3
Harvesting, first processing 2,223.9 33.4 1.5 -0.7
Seed saving 275.6 4.1 16.4 3.4
Maintenance of the lands 892.4 13.4 4.8 2.0
New crops and plantations 247.1 3.7 -1.7 4.0
Support activity to the livestock breeding 204.8 3.1 0.2 -1.3
Total 6,664.6 100.0 3.5 1.2 Secondary activities Meat processing 323.8 20.5 2.7 -0.3 Fruit processing 52.9 3.3 14.5 5.4 Milk processing 303.7 19.2 2.9 -1.1 Farm stays 902.5 57.0 2.2 2.3 Total 1,582.9 100.0 2.8 1.2
39
PRICES ANd COSTS
By measuring the comparison between the variation of the index for the produc-tion costs and that one of the index for the prices of intermediate consumption, in 2013, the agricultural sector, in terms of trade, is improved (+1.6%) after six quar-ters, included between the half of 2011 and the beginning of 2013, during which there has been a worsening of the profit margins for the primary activity. Nonetheless, the annual figures hide a trend in prices that is constantly decreased during the second half of the year, with a more accentuated rhythm during the last quarter. On the whole, in 2013, the annual average varia-tion of the index for the prices of the prod-ucts purchased by the farmers (such as technical inputs, services and investment goods) is increased by 2.1%, against a vari-ation of 3.9% of the index for the prices of the products sold. Among the purchased products, the prices for goods and interme-diate services have registered an increase of 2.3%, compared to 2012, whereas the investment goods have registered a more
contained growth, equal to 1.2%. The high-est increases have been experienced by an-imal feed (+5%), pesticide (+3.8%), seeds (+2.9%) and veterinary expenses (+1.9%). The price index for the vegetable products
sold by farmers, despite the very nega-tive variations at the end of 2012, have improved in 2013, thus registering higher margins compared to those experienced by the livestock products; the first reached Annual change of price index and terms of trade on quartely basis
Price index for products sold by farmers
Price index for intermediate consumption purchased by farmers Terms of trade -3 0 3 6 9 12 15
I II III IV I II III IV I II III IV
2011 2012 2013
+5.3%, the other +1.9%. Compared to 2012, the most remarkable increases, concerning the vegetable crops, have been registered by potatoes (+31.9%) and wine (+13.8%); down the price for cereals (-3%). At last, it should be highlighted the trend in the index of the consumption prices for the food products and soft drinks which, compared to 2012, have registered an in-crease by 2.4%. Also in this case, the an-nual average hide a different trend between the first and the second half of the year, as well as among the different kinds of foods, which are subjected to the periodic-ity of crops. In the specific, both the food goods processed (+2.1%) and those unpro-cessed (+3%) have increased. Among the processed foods, it should be noticed the annual increase by +3.9% for chocolate, and +2.8% for jams and honey, whereas for the unprocessed foods there has been an increase in prices for potatoes (+12.1%), fresh or frozen fruit (+5.9%) and fresh or frozen vegetables (+3.8%).
Index of farm prices and consumer prices for the entire collective - index numbers (2010=100) Price index for intermediate consumption
Price index for investments
Producer price index of the vegetable products sold by farmers Consumer price index NIC for foodstuff and soft drinks Producer price index for animals and animal products
100 105 110 115 120 125
I II III IV I II III IV I II III IV
2011 2012 2013
41 To better understand the peculiarity of
the agricultural sector, it may be useful to divide the value of the production for agriculture, forestry and fishing into its main components. The incidence of inter-mediate consumption (seeds, fertilizers, animal feed, energy, services and other services) has amounted to 41.8%. The subsidies and grants allocated to the products and to the other activities, at a national and European level, have had an incidence of 8.4%, in increase com-pared to 8.1% of 2012. The incomes from dependent labour have had an incidence of 15.7%, whereas depreciation, equal to 24.3%, have experienced a slight decrease, compared to 25.6% of 2012. Taking into account the value added, at factor costs, without considering output, the incidence of the depreciation reaches about 43% for the whole sector, thus representing a very critical point for the sector which, also for this reason, has a remuneration for the self-employed
work-ers (such as farmwork-ers, family workwork-ers, business men and other professional ag-ricultural roles), for the capital and for the business, which is very low and equal
to 8.5% of the output for 2013. Compared to the previous year, the share of indirect taxes on production is decreased (from 2% to 1.3%), mainly as a consequence of
AGRICULTURAL INCOME
41.8% 1.3% 8.4% 24.3% 15.7% 8.5% Intermediate consumption Direct taxation on production Contributions to the production1 Depreciation Income from dependent labour Other incomes2 25,029 762 5,044 14,560 9,397 5,101 TOTAL 51,951.8 Breakdown of the value of the agricultural output (million euro), 2013** Including forestry and fishing
1 New CAP aid, interest subsidies (rural development, natural disasters, etc.), aid to extra-agricultural sectors (tobacco, wine, etc.)
the fiscal innovations relating to the pay-ment of the IMU tax, which is expected to be paid for the lands.
At European level, according to the Eu-rostat estimate, the real agricultural income per working unit is decreased
(-1.2%) over 2012. The highest increases have been observed in the Netherlands (+11.4%), Malta (+10.3%) and in Spain (+9.9%). The strongest decreases instead have affected Estonia (-17.6%), France (-15.7%) and Croatia (-12.6%). Italy,
com-pared to 2012, has registered a remarka-ble increase by 7.9%, thus bringing the in-dex almost at the same value as in 2005. This result is essentially a consequence of the decrease in the working units reg-istered in the last years.
The agro-food system consists of all the activities tied up by commercial relation-ships, and which contribute in creating the value of the food product, in the same way as it reaches the consumers: it plays an im-portant role in the economy of our country. The food-chain involves all of the three sec-tors of the economic activity: agriculture with the production of raw materials, in-dustry through the processing activity and the providing of machineries, the service sector mainly with distribution and mar-keting. This three sectors are directly or indirectly related through the presence of a great number of economic players, and the phases are supported by stakeholders external to the supply-chain, whose job is important in order to ensure the right logical operations, such as the providing of technical means for agriculture, transport, logistics, marketing, networking, survey, etc…
The whole of these activities, considering also the subsidies received, the indirect taxes paid and the investments made,
COMPONENTS OF THE SYSTEM
11.3% 9.4%
10.0% 5.1%
2.0% 6.0% VA from agriculture, forestry and fishing
Intermediate consumption in agriculture, forestry and fishing
Marketing and distribution1
VA from the food industry, drinks and tobacco VA from catering services1
Indirect taxation on the agri-indistrial sector Production subsidies2 Agro-industrial investments1 30,045 25,029 105,226 26,609 43,972 13,549 5,323 15,903 39.6% 16.6%
Main components of the agri-industrial system at basic prices (million euro), 2013
1 estimate
2 Single Farm Payment (SFP), aid for rural development, natural disaster relief, national and regional aid, premiums for tobacco, wine, warehousing, export rebates, etc.; production subsidies (new CAP aid) of 1,356 million euro are included in VA from agriculture at basic prices
Source: ISTAT
amounts to about 266 billion euro, with an incidence of 17% on the GDP.
The main items are represented by about 30 billion in agricultural value added, 25 billion in agricultural intermediate
con-sumption, 15.9 billion in agro-industrial investments, 26.6 billion of value added in the food-industry, 44 billion of value added in the food services, and about 105.2 billion of value in marketing and distribution.
45 Source: provisional estimates 2013 on ISTAT data
Trend in the main components of the agro-industrial system and incidence on the national GDP
Agro-industrial investments
Production subsidies
Indirect taxation on the agro-industrial sector
Marketing and distribution
VA catering services
VA food industry, drinks and tobacco
Intermediate consumption agriculture, forestry and fishing
VA agriculture, forestry and fishing
Components on the GDP % 16.40 17.10 6,90 16,90 17,00 0 10 20 30 40 50 60 70 80 90 100 2008 2009 2010 2011 2012 2013 16.90 16.90 17.00 17.03
The food and drink industries, along with the tobacco industry, have acquired during time an ever more important role in the national manufacturing sector: in 1971 the food industry had an incidence of 10.5%, in terms of companies, and of 8.8% , in the number of employees; in 2011 the share has increased respectively to 13.6% and 11.0%. Within the sector, only the food processing industry represents 95% of companies and 91.6% of employees. At the territorial level, the figures released by ISTAT on the firm’s structure (2011), have showed that Lombardy is the first region for the number of local units em-ployed in the food sector (12.7%, equal to 7,020 firms), followed by Sicily and Cam-pania (respectively with 6,840 and 6,701 local units, and an incidence of about 12% on the national total). In terms of em-ployees, the regional placement changes. Among the first four positions there are some northern regions of Italy: Lombardy (16.4%, 64,932); Emilia-Romagna (14.6%,
57,806), Veneto (9.1%, 36,086) and Pied-mont (8.1%, 32,084).
According to the national accounting data,
updated to 2013, the working units in the food and drink industries, and in the to-bacco industry, amount to 419 thousand
FOOd INdUSTRY
Food industry*: main macroeconomic aggregates, 2013
124,916 419.3 324.6 12.3 80 26,609 280 (mio. euro) Output1 Value added2 Production subsidies
VA from food industry as % of Total VA from manufacturing Total VA from industry AWU (000) Total working units of which employees
* Including drinks and tobacco
1 Value of production at basic prices, in current values, estimated from ISTAT figures 2 Value added at basic prices in current values