https://www.scirp.org/journal/am ISSN Online: 2152-7393
ISSN Print: 2152-7385
DOI: 10.4236/am.2020.1110067 Oct. 26, 2020 1013 Applied Mathematics
Decomposition of the Sum of Cubes,
the Sum Raised to the Power of Four
and Codeviance
Fabio Manca, Claudia Marin
Department of Education, Psychology, Communication, University of Bari “Aldo Moro”, Bari, Italy
Abstract
The purpose of this paper is to achieve decomposition formulas of sums re-garding deviation cubes, the sum of deviation raised to the power of four and codeviance, because they allow to evaluate the contribution of different com-ponents of the above three absolute measures regarding asymmetry, disnor-mality and concordance. We have obtained more significant formulas that are valid only for two groups, in addition to the formulas valid for r groups, and we have prepared an example to emphasize how useful those formulas were.
Keywords
Decomposition Formulas, Deviation Cubes, Codeviance Decomposition
1. Introduction
In case, a collective unit can be split in groups, decomposition of deviance in two parts is quite known in statistics (Girone, 2009) [1]: the sum of partial deviances and the one of standard deviations between partial and general averages rated by an high number of groups (Mickey et al., 2004) [2]. The purpose of this paper is to achieve similar decomposition formulas as to the sum of deviation cubes, the sum of deviation raised to the power of four and codeviance. In this regard, we indicate by k the group index and i the index of a statistical unit, by r the num-ber of groups, N is the high numnum-ber of a collective unit, Nk is the high number of
a k-group and by (xki, yki) the i-observation of two types in a k-group.
2. Decomposition of a Sum of Deviation Cubes
The averages, deviances and deviation cubed sums of X-type groups times 1, 2, ,
k= are r How to cite this paper: Manca, F. and
Marin, C. (2020) Decomposition of the Sum of Cubes, the Sum Raised to the Power of Four and Codeviance. Applied Mathe-matics, 11, 1013-1020.
https://doi.org/10.4236/am.2020.1110067
Received: September 1, 2020 Accepted: October 23, 2020 Published: October 26, 2020 Copyright © 2020 by author(s) and Scientific Research Publishing Inc. This work is licensed under the Creative Commons Attribution International License (CC BY 4.0).
http://creativecommons.org/licenses/by/4.0/
DOI: 10.4236/am.2020.1110067 1014 Applied Mathematics 1 k N ki i k k x x N = =
∑
(1)( )
(
)
2 1 k N k i ki k Dev X =∑
= x −x (2)( )
(
)
3 1 k N k i ki k Sc X =∑
= x −x (3)General average, general deviance and general sum of deviation cubes are
1 1 k r N ki k i x x N = = =
∑ ∑
(4)( )
1 1(
)
2 k r N ki k i x x Dev X N = = − =∑ ∑
(5)( )
1 1(
)
3 k r N ki k i x x Sc X N = = − =∑ ∑
(6) Similarly, to what is done for deviance decomposition, we start from the for-mula of a general sum of deviation cubes: by subtracting and adding the average of k-group within brackets( )
(
) (
)
3 1 1 k r N ki k k k i Sc X =∑ ∑
= = x −x + x − x (7)calculating the cube and simplifying it, the outcome is
( )
(
)
3(
)
( )
(
)
3 1 1 3 1 1 k r N r r ki k k k k k k i k k Sc X =∑ ∑
= = x −x +∑
= x −x Dev X +∑
= x −x N (8) that is,( )
( )
(
)
( )
(
)
3 1 3 1 1 r r r k k k k k k k k SC X =∑
= Sc X +∑
= x −x Dev X +∑
= x −x N (9)which shows that a general sum of deviation cubes is primarily equal to the sum of deviation cube partial sums plus the sum of deviations between partial aver-ages and general average, rated by partial deviances, and even more the sum of deviation cubes between partial averages and general average rated by an high number of groups. In other words, the sum of deviation cubes, apart from the inside, is completed by two components depending on differences between par-tial averages and general average, on deviances and an high number of groups.
It is hardly necessary to emphasize that if partial averages are all mutually equal, the last two parts cancel each other out. Therefore, the general sum of deviation cubes is equal to the sum of partial sums in deviation cubes.
Other special cases of similar partial deviances are equally interesting as well as high numbers of similar groups.
The above formula is simple only in the case of two groups:
( )
( )
(
)
(
)
(
) (
)
(
)
2 2 1 2 1 2 1 2 2 1 1 2 3 1 2 2 1 1 2 1 2 3 k k x x N N SC X SC X N N x x N N N N N N σ σ = − − = + + − − + +∑
(10) where 2 1 σ and 2 2pos-DOI: 10.4236/am.2020.1110067 1015 Applied Mathematics
itive (negative) if averages and variances are concordant (discordant). Instead, third addend is positive (negative) if averages and high numbers of the two groups are discordant (concordant).
3. Decompositon of the Sum of Deviation Raised to the
Power of Four
The sums of deviation raised to the power of four for X-type groups, that is, the partial sums of deviation fourth exponents as to k=1, 2, , are ,r
( )
(
)
4 1 k N k i ki k Sq X =∑
= x −x (11)The general sum of the deviation raised to the power of four is
( )
(
)
4 1 1 k r N k k i ki k Sq X =∑ ∑
= = x −x (12)Similarly, to what has been done in previous paragraph, by subtracting and adding the average of k-group within brackets, in the general sum of deviation raised to the power of four, the outcome is
( )
(
) (
)
4 1 1 k r N ki k k k i Sq X =∑ ∑
= = x −x + x −x (13)Calculating to the power of four and simplifying it, it comes out
( )
(
)
(
) ( )
(
)
( )
(
)
4 1 1 1 2 4 1 1 4 6 k r N r ki k k k k i k r r k k k k k Sq X x x x x Sc X x x Dev X x x N = = = = = = − + − + − + −∑ ∑
∑
∑
∑
(14) that is,( )
( )
(
) ( )
(
)
( )
(
)
1 1 4 1 1 4 6 r r k k k k k r r k k k k k k Sq X Sq X x x Sc X x x Dev X x x N = = = = = + − + − + −∑
∑
∑
∑
(15)which shows that general sum of deviation raised to the power of four is firstly equal to the sum of partial sums in deviation raised to the power of four plus the sum of deviation between partial averages and general average, rated by partial sums of deviation cubes, plus the sum of squares of deviations between partial averages and general average rated by deviances of groups, as well as even the sums of deviation raised to the power of four between partial averages and gen-eral average rated by high numbers of groups. In other words, the gengen-eral sum of deviation raised to the power of four, apart from the inside, is completed by three components depending on differences between partial averages and gener-al average, on partigener-al sums of deviation cubes, on partigener-al deviances and an high number of groups.
It is hardly necessary to emphasize that the last three parts cancel each other out if partial averages are all mutually similar. Therefore, the general sum of deviation raised to the power of four is equal to the sum of partial sums in devia-tion raised to the power of four.
There are other equally interesting special cases of mutually similar partial sums in deviation cubes, of mutually similar deviances as well as similar high numbers of groups.
DOI: 10.4236/am.2020.1110067 1016 Applied Mathematics
The above formula, also in this case, is simple only in the case of two groups:
( )
( ) (
)(
)
(
)
(
)
(
)
(
)
2 1 2 1 2 1 2 1 1 2 2 2 2 1 2 1 1 2 2 1 2 1 2 4 2 2 1 2 1 1 2 2 1 2 3 1 2 4 6 ( ) k k x x N N Sq X Sq X N N x x N N N N N N x x N N N N N N N N γ γ σ σ = − − = + + − + + + − − + + +∑
(16)where γ1 e γ2 are asymmetrical indexes of the two groups. The second addend is
positive (negative) if averages and asymmetrical indexes are concordant (dis-cordant). The third and fourth addends are always not negative.
4. Decompositon of Codeviance
Regarding partial averages and totals of Y-type, formulas in previous paragraph are to be taken into account by substituting all x with all y.
Codeviances between types X and Y of the groups, as to k=1, 2, , are ,r
(
,)
1(
)(
)
. k N k k i ki k ki k Codev X Y =∑
= x −x y −y (17) General codeviance is(
,)
1 1(
)(
)
. k r N ki k ki k i Codev X Y =∑ ∑
= = x −x y −y (18)Similarly, to what has been done in previous paragraphs, by subtracting and adding the average of k-group within brackets, the outcome is
(
,)
1 1(
) (
) (
) (
)
. k r N ki k k ki k k k i Codev X Y =∑ ∑
= = x −x + x −x y −y + y −y (19)By calculating the product and eliminating two zero-value terms, we have
(
,)
1 1(
)(
)
1(
)(
)
. k r N r ki k ki k k k k k i k Codev X Y =∑ ∑
= = x −x y −y +∑
= x −x y −y N (20) that is(
,)
kr 1(
k, k)
rk 1(
k)(
k)
k Codev X Y =∑
=Codev X Y +∑
= x −x y −y N (21)which shows that general codeviance is equal to the sum of partial codeviances increased by the sum of results from deviations of partial averages out of X-general average, as to corresponding Y-deviations rated by high numbers of groups. The latter sum can be also called codeviance of averages.
It is hardly necessary to emphasize that codeviance of averages is zero value in similar partial averages (regarding one or both types), so that general codeviance is equal to the sum of partial codeviances.
The above formula, also in this case, is simple only in the case of two groups:
( )
2(
) (
1 2)(
1 2)
1 2 1 1 2 , k k k x x y y N N Codev X Codev X Y N N = − − = + +∑
(22) Second addend is positive (negative) depending on whether averages of the above two types are concordant (discordant).DOI: 10.4236/am.2020.1110067 1017 Applied Mathematics
5. Application
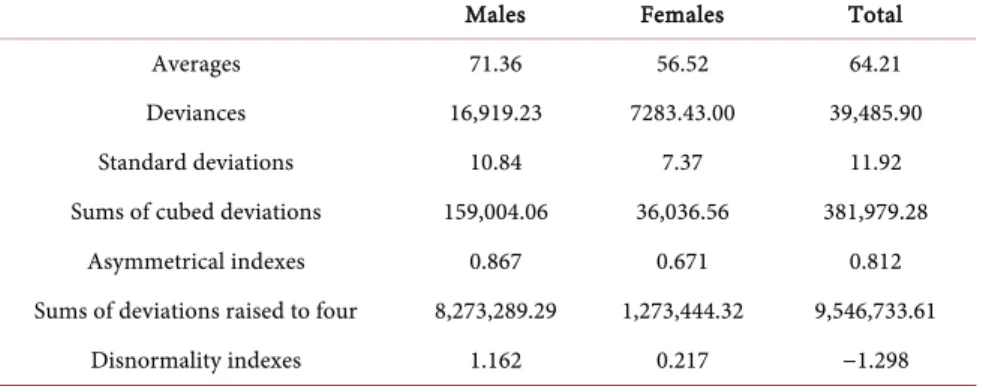
As an application, we refer to a group of 278 students (144 males and 134 fe-males) attending a first year course at the University of Bari whose height and body weight were detected. The averages, deviations, sums of deviation cubes and deviation raised to the power of four are as follows (Tables 1-4).
As to previous results, the following (Tables 5-8) decompositions are made. Previous results allow the following considerations to be made. Let’s start with the values:
- the two groups are quite similarly large (Males are slightly prevailing); - average values, as to both types, are bigger among Males;
- standard deviations, for both types, indicates a bigger variability among Males;
Table 1. Number of cases.
Males Females Total
Number of cases 144 134 278
Table 2. Height (cm).
Males Females Total
Averages 177.42 165.74 171.79
Deviances 5883.16 4317.86 19,677.90 Standard deviations 6.39 5.68 8.41 Sums of cubed deviations −2020.46 −81.22 14,918.91
Asymmetrical indexes −0.053 −0.003 0.090 Sums of deviations raised to four 657,677.65 67,978.08 3,475,668.57
Disnormality indexes −0.264 0.364 0.504
Table 3. Weights (kg).
Males Females Total
Averages 71.36 56.52 64.21
Deviances 16,919.23 7283.43.00 39,485.90 Standard deviations 10.84 7.37 11.92 Sums of cubed deviations 159,004.06 36,036.56 381,979.28
Asymmetrical indexes 0.867 0.671 0.812 Sums of deviations raised to four 8,273,289.29 1,273,444.32 9,546,733.61
Disnormality indexes 1.162 0.217 −1.298
Table 4. Heights × weights.
Males Females Total Codeviances 6329.97 2183.28 20,548.10 Correlation coefficients +0.634 +0.389 +0.737
DOI: 10.4236/am.2020.1110067 1018 Applied Mathematics Table 5. Decomposition of deviance.
Decomposition of deviance Heights Weights
Values % Values % Deviances (Males) 5883.16 29.9 16,919.23 42.9 Deviances (Females) 4317.86 21.9 7283.43 18.4 Internal Deviances 10,201.02 51.8 24,202.66 61.3 External Deviances (between) 9476.88 48.2 15,283.24 38.7 General Deviances 19,677.90 100.0 39,485.90 100.0
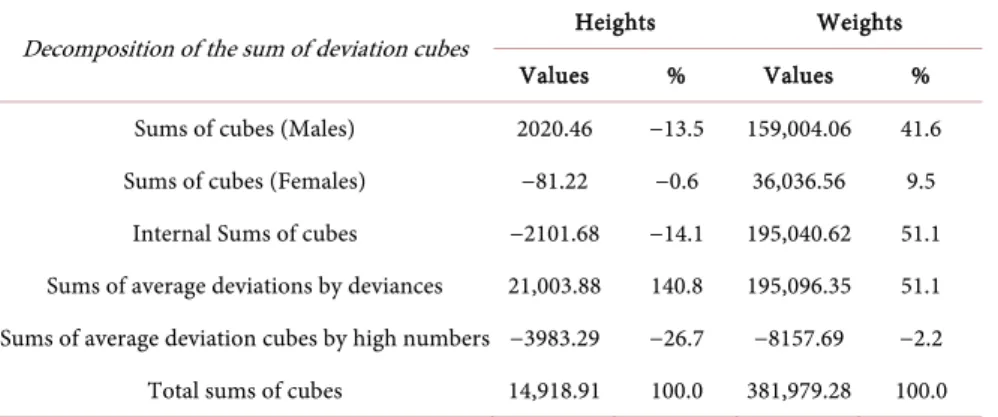
Table 6. Decomposition of the sum of deviation cubes.
Decomposition of the sum of deviation cubes Heights Weights
Values % Values % Sums of cubes (Males) 2020.46 −13.5 159,004.06 41.6 Sums of cubes (Females) −81.22 −0.6 36,036.56 9.5
Internal Sums of cubes −2101.68 −14.1 195,040.62 51.1 Sums of average deviations by deviances 21,003.88 140.8 195,096.35 51.1 Sums of average deviation cubes by high numbers −3983.29 −26.7 −8157.69 −2.2 Total sums of cubes 14,918.91 100.0 381,979.28 100.0
Table 7. Decomposition of the sum of deviation raised to the power of four. Decomposition of the sum of deviation raised to
the power of four
Heights powers Weights Values % Values % Sums of fourth powers (Males) 657,677.65 18.9 8,273,289.29 38.3 Sums of fourth powers (Females) 467,978.08 13.5 1,273,444.32 5.9
Sums of internal fourth powers 1,125,655.73 32.4 9,546,733.61 44.2 Sums of average deviations by cubed deviations −43,552.68 −1.3 3,441,148.82 15.9 Sums of squares average deviations bydeviations 2,068,829.12 59.5 7,775,075.23 36.0
Sums of fourth powers in average
deviations by an high number 324,736.40 9.4 844,561.34 3.9 Total sums of fourth powers 3,475,668.57 100.0 21,607,519.00 100.0
Table 8. Decomposition of codeviance.
Decomposition of codeviance Values %
Codeviance (Males) 6329.97 30.8 Codeviance (Females) 2183.28 10.6 Internal codeviance 8513.25 41.4 Codeviance of averages 12,034.85 58.6 General codeviance 20,548.10 100.0
DOI: 10.4236/am.2020.1110067 1019 Applied Mathematics
- height asymmetrical indexes in both sexes take on slight negative values, those for Weights, instead, are surely asymmetrical positive;
- height disnormality indexes take on mild and contrasting values (negative for Males and positive for Females), the Weight ones, for both sexes indeed, are similarly positive, even though only the Male one takes on an high value; - both correlation coefficients are positive, the Male one is the highest.
Let us now turn to decompositions.
The decomposition of deviance highlights a relevant incidence of deviance between the two sexes, due to a marked difference of averages.
It should be added that such incidence affects more distinctly the height, whose variability depends almost exclusively on genetic factors, than weight whose variability also depends on exogenous factors.
Regarding decomposition of the sum of deviation cubes, it is necessary to make a difference as to both types.
Regarding height (Table 6), the sum of deviation cubes shows a modest nega-tive value as to Males and quite trifling for Females: overall, the incidence is −14.1%. A still more significant negative contribution (−26.7%) is due to the sum of cubic deviations between the average heights of each sex and the general average height rated by relative high numbers. The most significant and actually positive contribution is due to deviations between average heights of each sex and the general average height rated by relative deviances (140.8%). This is the component that gives rise to a positive value of the general sum of deviation cubes, indicating the positive asymmetry of general distribution, while the par-tial ones are slightly asymmetrical negative.
As it can be seen in Table 6, the situation as to weight is very different: first of all, both sums of weight deviation cubes of both sexes are positive, so that inter-nal sum of cubes is more than half of the general one (51.1%). The incidence of this component due to deviations between average weights of both sexes and general average weight rated by deviations is identical (51.1%). On the other hand, the contribution due to the sum of deviation cubes between average weights of each sex and the average general weight rated by relative high num-bers is totally marginal (−2.2%). To sum up, the positive general sum of devia-tion cubes as to weight is due to the sum of deviadevia-tion cube sums in each sex for one half and for the other is due to deviations between average weights in each sex and general average weight rated by their relative deviances. In other words, this second part integrates the internal sum of deviation cubes, stressing the pos-itive asymmetrical general distribution compared to the pospos-itives ones in distri-butions of both sexes.
It is necessary to make a difference between height and weight regarding the sum of deviation fourth powers.
As to height (Table 7), almost a third (32.4%) of the general sum of deviation fourth powers is given by the sums of deviation fourth powers in each sex. However, the most relevant incidence (59.5%) is due to the sum of deviations between average heights of each sex and general average height rated by
de-DOI: 10.4236/am.2020.1110067 1020 Applied Mathematics
viances. It is modest, but still positive, the contribution (9.4%) of the fourth power sum of deviations between average heights of each sex and general aver-age height rated by corresponding high numbers. Finally, there is a negative contribution (−1.3%) from the sum of deviations between average heights of each sex and general average height, rated by corresponding sums of deviation cubes.
As to weight (Table 7), all four components are positive: the most relevant is the sum of deviation partial fourth powers (44.2%), then comes a component that involves squares of deviations as well as deviances (36.0%) and the one which involves deviations and the sums of deviation cubes (15.9%). Finally, there is the highest component of fourth powers, with a modest contribution (3.9%) of deviations between weights of each sex and general average weight rated by a corresponding high number. Moreover, the general sum of deviation fourth powers and, therefore, the hyper-normal general distribution is due to all four components together.
To end up, in Table 8 there is decomposition of codeviance: internal code-viance of both sexes (with a distinctly prevalence of the Males one, as can be seen both from the values of codeviances and correlation coefficients in both sexes) explains 41.4% of general codeviance, since the remaining 58.6% is due to code-viance between concordant averages in both sex types.
6. Conclusion
Similarly, to what is done for deviance decomposition (Scheffè, 1999) [3], de-composition formulas of sums regarding deviation cubes, the sum of deviation raised to the power of four and codeviance have been obtained. Such formulas allow to evaluate the contribution of different components of the above three absolute measures regarding asymmetry, disnormality and concordance. It should be noted that the three aforementioned measures are the result of an in-ternal part of partial distributions plus other parts in which averages, deviances, deviation cube partial sums and codeviance of averages are involved. In addition to formulas valid for r groups, there are even more significant ones that have been obtained and valid only for two groups. An example has allowed us to bet-ter highlight how useful those formulas were.
Conflicts of Interest
The authors declare no conflicts of interest regarding the publication of this paper.
References
[1] Girone, G. (2009) Statistica. Cacucci, Bari.
[2] Mickey, M.R., Dunn, J.O. and Clark, A.V. (2004) Analysis of Variance and Regres-sion. Wiley, New York.