-■m
r
—«
•-‘'«■the* ..-;;írpO«i Ilfelílí *ffc Si.x í i üm
li;-m li;-m p V*’.V. r,\ :;$&i Iì::
I I I
i?;!JÍ
fe-ro ^ .'o
EUROPEAN UNIVERSITY INSTITUTE
Department of Economics
**4 1
,:Kj:Y6im£lv
.nx^uUid. ;tsjfe618|!'i:?í?ínH5
fe'iìrfeM % ^ s f É.Ü l^
?i|SlU
JÈtir* J3 4(KW K5&8 5Ü ♦UVV. Ü*» q&hì .«:*?
ìì
?*
j
V- g*!
ÌjJhV-»' •* *.•■' |g$g I;-ej*j* «*;K*
éiaìM'W
,-JH n S im
&
hìh
?
3fc1*$
m
!li§
t:
An Analysis of Recent Trends in Corporate Sector Gearing
Ratios using Company Accounts Data
from the Bach Data Bank
Fabia G. Jones
Thesis submitted for assessment with a view to obtaining
the Degree of Doctor of the European University Institute
1
ie
&l
\r-;vD
OD©
y>
VÛ©©
©©©
*
EUROPEAN UNIVERSITY INSTITUTE
Department of Economics
An Analysis of Recent Trends in Corporate Sector Gearing
Ratios using Company Accounts Data
from the Bach Data Bank
Fabia G. Jones
í
Thesis submitted for assessment with a view to obtaining
the Degree of Doctor of the European University Institute
¿ Y r/s'/.
RECENT TRENDS IN CORPORATE SECTOR GEARING RATIOS USING RECENT TRENDS IN CORPORATE SECTOR GEARING RATIOS USING
COMPANY ACCOUNTS DATA FROM THE BACH DATA BANK
CONTENTS
Preface
Acknowledgements __
I INTRODUCTION ... 1
II RECENT TRENDS IN CORPORATE SECTOR FINANCIAL STRUCTURE: EMPIRICAL EVIDENCE... 14
A INTRODUCTORY REMARKS... 15
B GEARING RATIOS... 20
B.l Corporate Gearing Ratios... 23
b!2 Debt-Income Ratios...43 B.3 Suimnary... 54 C DEBT BURDEN... 55 C.l Income Gearing... 56 D INVESTMENT... 58 E SUMMARY OF STYLISED F A C T S ... 62
IV
CAL CONSIDERATIONS ... 64
A THE TRADITIONAL THEORY OF CORPORATE FINANCE ... 65
B THE MODIGLIANI-MILLER (MM) MODEL - NO TAX, NO BANK RUPTCY ...70
C MM - NO TAX, COSTLESS BANKRUPTCY... 75
D MM - NO TAX, COSTLY BANKRUPTCY... 77
E MM - TAX, COSTLY BANKRUPTCY... 84
F RELAXATION OF THE ASSUMPTION OF NO DIFFERENTIAL TAX TREATMENT... 87
G FURTHER DETERMINANTS OF THE CORPORATE GEARING RATIO H INFLATION AND PRICE UNCERTAINTY... 94
I THE RELATIONSHIP BETWEEN GEARING AND INVESTMENT ... 110
J FINANCIAL LIBERALISATION... 127
K SUMMARY... 136
THE DETERMINATION OF CORPORATE FINANCIAL__ jgTRVCTOgl EMPIRICAL EVIDENCE ... 138
A INTRODUCTION ... 139
B.l Nominal Rates of Interest... 145
B.l.i Long T e r m ...146
B. 1 .ii Short Term...150
B.2 Real Rates of Interest... 151
B.2.i Long T e r m ...151
B . 2. i i Short Term...154
B.3 Relative Real Rates of Interest...156
B.4 Cost of Equity... 161
B.5 Risk Premium: Debt versus Equity...167
B.6 Cost of Capital... 172
C INFLATION... 185
D FINANCIAL LIBERALISATION... 193
V EMPIRICAL ANAL YSIS... 196
A DETERMINATION OF CORPORATE SECTOR GEARING RATIOS . . 196
B CAUSALITY: GEARING AND INTEREST RATES... 214
C CAUSALITY: GEARING AND INVESTMENT... 220
>
VI CONCLUSIONS... 224BIBLIOGRAPHY... 230
II. 1 The Ratio of Total Debt to Total Liabilities... 25
11.2a Debt-Liability Ratio - Germany... 37
11.2b Debt-Liability Ratio - France... 37
II.2c Debt-Liability Ratio - U K ... 37
II.2d Debt-Liability Ratio - J a p a n ... 38
II.2e Debt-Liability Ratio - U S A ... 38
II.3a Short-Term Debt as a Proportion of Total D e b t .... 40
11.3b Long-Term Debt as a Proportion of Total D e b t ... 40
11.4a Short-Term Debt to Liability R a t i o ...42
II.4b Long-Term Debt to Liability R a t i o ... 42
II.5 Corporate Debt as a Proportion of G D P ... 46
II.6a Debt-GDP Ratio - Germany ... 48
II.6b Debt-GDP Ratio - France... 48
II.6c Debt-GDP Ratio - U K ... 48
II.6d Debt-GDP Ratio - Japa n... 49
II.6e Debt-GDP Ratio - U S A ... 49
II.7a Total Debt-Gross Income Ratio ... 53
11.7b Short Term Debt-Gross Income R a t i o ... 53
11.7c Long Term Debt-Gross Income R a t i o ... 53
11.8 Burden of D e b t ... 57
11.9 Investment as a Proportion of G D P ... 59
11.10 Ratio of Total Debt Net of Financial Assets as a Proportion of Total Liabilities ... 61
IV. la Nominal Long Term Interest Rates... 148
IV. lb Nominal Short Term Interest Rates... 148
IV.2a Real Long Term Interest Rates... 153
IV. 2b Real Short Term Interest Rates... 153
IV.3 Risk Premium: Cost of Safe versus Risky D e b t ... 159
IV.4 Dividend Yield... 162
IV. 5a Consumer Price Index... 164
IV. 5b Share Price Index... 164
IV.6 Rate of Return on Equity... 166
IV. 7 Real Private Bond Yield Less Return on Equity.... 170
IV. 8 Cost of Capital... 174
IV.9 Return on Invested Capital... 183
TABLES
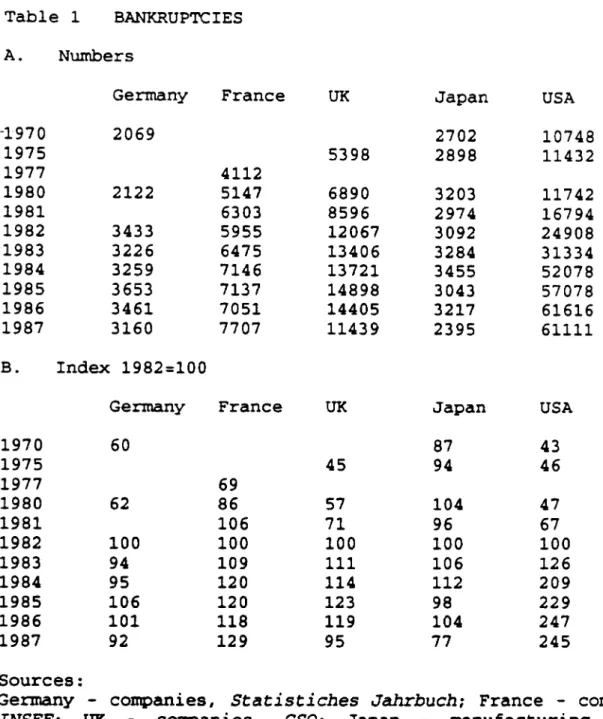
Table IV. 1 Bankruptcies... 178
Table V.l The Relationship between Gearing and Interest Rates 215 Table V.2 The Relationship between Gearing and Investment ... 221
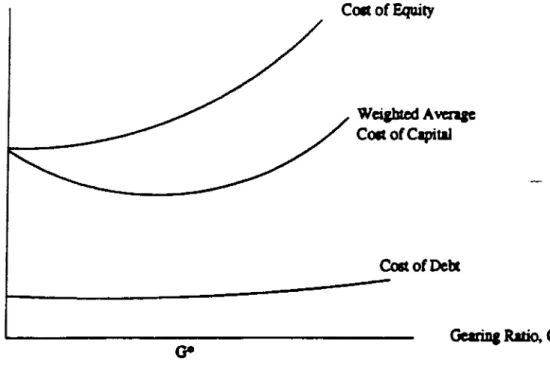
FIGURES Figure 1 The Optimal Gearing Ratio According to the Traditional Theory of Corporate Finance... ... 68
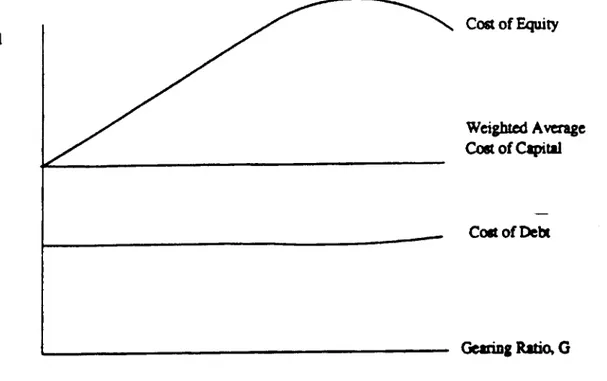
Figure 2 Cost of Capital in a Modigliani-Mi H e r (MM) No-Tax World... 73
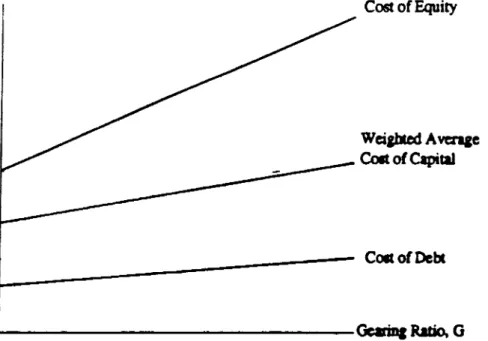
Figure 3 MM without Tax with Costly Bankruptcy... 82
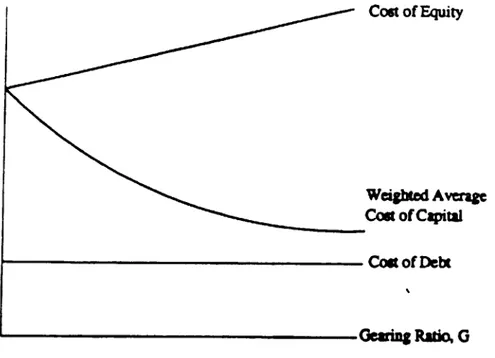
Figure 4 The MM model with T a x ... 86
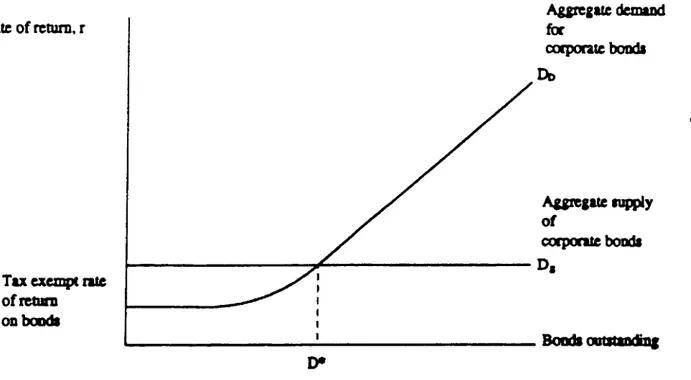
Figure 5 The Optimal Stock of Corporate B o n d s ...92
This thesis undertakes a comparative investigation of recent trends in corporate sector gearing ratios. Other studies in this area have tended to use national accounts data as their basis for empirical work. This can cause problems in cross-country comparative studies because of differences in national account ing procedures and modifications in these procedures over time. This thesis takes an alternative approach using the harmonized BACH data bank to analyze and characterise behaviour.
\
The BACH bank contains harmonised company accounts data for European Community countries, the US and Japan. It allows cross country comparisons to be made avoiding many of the problems encountered in studies based on national accounts data. Although the data bank was only set up in 1986, it has yielded useful and interesting. information concerning the comparative financial behaviour of the corporate sector in some of the major in dustrialised nations. Its usefulness should improve over time as more observations become available and a greater data set is generated.
The data bank is analyzed in some detail allowing the presentation of a number of important stylised facts. This allows us to consider the reasons behind trends observed. We then draw out a number of implications, including possible
The role of financial liberalisation and the link between the corporate and financial sector are found to be important determinants of corporate sector financial behaviour. As a consequence, it is possible that these factors influence investment and monetary policy.
The thesis is organised in six parts. An introduction is followed by a detailed presentation of recent trends in corporate sector financial structure. Chapters three and four are devoted to theoretical and empirical analysis of the determination of corporate sector financial structure. Empirical estimation is carried out in chapter five, with chapter six concluding the thesis.
I wish to thank Jean-Claude Chouraqui, Jean-Paul Fitoussi and Mario Nuti for their advice, support and encouragement throughout the preparation of this thesis. I am indebted to Phil Davis for a large number of useful and though-provoking comments. Helpful and interesting comments from Jenny Corbett and Robert Waldmann were also gratefully received.
The use of debt to finance activity has displayed a tendency to rise in a number of industrialised economies over the past few decades.
For much of the last fifteen years there has been^ a general trend towards greater issuance of debt than equity in many industrial nations ... Most analysts agree that leverage ratios are higher today than in 1970.
Bank for International Settlements, 1986: p 198
Concerns have however, been expressed that borrowing may be reaching excessive levels in certain sectors (e.g. Business Week 1988‘; Kaufman 1986). In this study we have investigated
I
potential causes of recent trends in corporate sector indebted ness and gone on to consider certain possible consequences of the trends observed.
Studies involving international comparisons of corporate sector financial behaviour run into problems concerning differences in sectoral definition, coverage and accounting procedures. Empirical studies based on national accounts data
1 'Special Report on Leverage,1 Business Week. 7th November 1988.
suffer from quite severe problems in this regard. In this study an alternative approach has been adopted. To this end informa tion from the BACH data bank has been presented and analyzed. The BACH bank contains harmonized company accounts data for the EC countries, the USA and Japan. As such, a number of the problems encountered when using national accounts data are avoided.
Information from the BACH data bank is used to identify recent trends in corporate sector financing. Explanations underlying these trends are then considered and possible consequences of the patterns observed.
There are many aspects of financial behaviour that could be considered. For example, increasing numbers of private sector agents would appear to be experiencing difficulty in servicing and redeeming ever-increasing outstanding debts, and concern has thus been growing that the risk of financial fragility may have risen as a consequence. A great deal of attention has hence been devoted to analyzing debt-income ratios, which appear to have displayed a general tendency to rise in many industrialised countries. See e.g. Davis (1987) for a thorough and wide- ranging presentation of possible causes and implications of rising sectoral debt-income ratios. Debt-cash flow is another ratio that has been monitored. Even firms that stand to receive very healthy profits in the future on projects currently being undertaken can get into difficulties if cash flow is not suffi cient to meet short-term needs. This is an important considera tion especially given that, with the exception of the US, and more recently Germany, the proportion of short-term debt in the
financial structures of the corporate sectors in the major economies far outweighs more long-term debt. The relationship between increasing use of debt and the risk of bankruptcy has also been considered, although mainly from a theoretical point of view - to date there has been relatively little empirical investigation of this topic. Other aspects have also been considered, each with their own implications. Again see Davis (1986) who looks at many different debt ratios in a study of recent portfolio behaviour in the non-financial corporate sector of the major industrialised countries.
In this study, however, we have investigated the implica tions for physical investment of an increase in the relative use of corporate debt. The firm can draw on essentially two broad classes of finance to carry out investment: debt and equity. The holders of these liabilities attempt to control the managers of firms in different ways, and give them different incentives to behave in certain ways. Changes in the proportion of financing deriving from debt could well change the incentives and controls facing managers and their behaviour. This could in turn affect their investment decisions. In this study we have chosen to investigate precisely how debt-liability ratios, commonly known as gearing ratios or leverage (US), have changed in recent years, and the consequences of this behaviour for corporate investment.
We have not only looked at the behaviour of corporate gearing over time but also across countries. A thorough study able to explain both these features appears to be lacking. There are a number of studies that analyze the behaviour of
gearing ratios in one country. The models are often country- specific, however, and cannot be used as general models for cross country comparison (see Marsh 1982 for the UK; and Taggart 1977 for the US for example). On the other hand there are a number of studies that explain cross country differences (Corbett 1987), but which do not provide models capable of satisfactorily explaining the behaviour of corporate gearing ratios over time within a country. Finally, there are those that combine these two features, but within a static framework (Mayer 1987b; 1989). The aim of this study has been to develop a general model combining all these features capable of explaining the determination of aggregate corporate gearing ratios and their evolution over time.
In chapter II, the recent behaviour of gearing ratios in the French, German, US, UK and Japanese corporate sectors is outlined. To date much of the empirical work on international comparisons of trends in corporate financial structure has been based on national accounts data. These studies suffer from problems of sectoral definition, and because of differences in definition and coverage of the relevant data. There are also differences In national accounting procedures. In this study many of these problems are avoided by using company accounts data contained in the BACH data bank provided by the Commission of the European Communities. The data in the bank is harmonised across the EC countries, Japan and the USA according to a common accounting framework. Even within the BACH data bank, however, the quality of aggregated corporate sector data varies across the countries studies and we have therefore concentrated on
manufacturing where cross-country discrepancies seemed the smallest. In the countries studied, gearing ratios displayed a general upward trend until the early 1980s, with the exception of Japan. The increase over this period was to be expected given the conditions favourable to the use of debt existing at the time: relatively low real interest rates and high levels of inflation. Since that time, however, inflation has tended to fall and real interest rates to rise in the countries studied. The continued rise of gearing ratios in the 1980s (with the exception of Japan and more recently France) is thus rather puzzling.
Over time, the corporate sector gearing ratio could be expected to move broadly counter-cyclically (Bernanke, 1981; L6vy-Garboua and Maarek, 1985). During a recession, the rate of growth of profits and internal equity slows or falls. When profit growth is low, managers are likely to be reluctant to make equity issues for risk of under-pricing. As firms turn to debt to meet financing needs, the gearing ratio rises. A general tendency for gearing ratios to rise in the major industrialised economies was thus witnessed following the oil- shocks and recessions of the 1970s.
Since the early 1980s, however, there has been a general upswing in economic activity. We would generally expect managers to prefer to issue equity when firms are enjoying healthy profits and when demand is strong. However, with the exception of Japan, and more recently France, there appears to have been no tendency in the countries Investigated in this study for the pace of increase of gearing ratios to slow down
or even decrease during the 1980s despite significantly improved economic performance in this period.
Whilst gearing ratios have been rising, the ratio of investment to GDP in the manufacturing sector of the countries under consideration has been displaying a general decline over the past twenty years, again with an exception being found in Japan. An increase in gearing would thus appear to be associ ated with a decline in proportion of investment in GDP. However, countries enjoying the highest gearing ratios - Japan, France and Germany - have also enjoyed greater investment as a proportion of GDP than the US and the UK, suggesting that increasing gearing ratios should be associated with increasing investment. The link between gearing and investment is thus far from clear.
To properly assess the implications of recent rises in corporate gearing ratios we must be able to explain precisely how the gearing ratio is determined. Accordingly, we turn in chapter III to a discussion of the theory explaining the deter mination of corporate gearing ratios. The analysis begins with basic relationships at the microeconomic level, and is progres sively developed through increasingly sophisticated models. Macroeconomic elements are also taken into account allowing an analysis that embraces both micro and macro considerations.
In the simplest models, an optimal gearing ratio is determined where the average cost of capital is minimised, subject to certain risk constraints. The least costly combina tion of the various forms of finance in the capital structure is sought, given prevailing exogenous influences such as
taxation, inflation and interest rates. In 1958, however, Modigliani and Miller (MM) published their theory proving that there was no optimal gearing ratio. Since then, successive of the very strict assumptions underlying the MM model have been relaxed, and these developments in corporate financial theory are traced through.
The effects of risk and return on financial structure are discussed in the various theories. It is necessary to consider both real and nominal rates of return. As a result, the effects of inflation and price uncertainty on financial behaviour are then considered in detail.
An increase in the rate of inflation is likely to encourage managers to issue more debt if the burden of outstanding corporate debt falls allowing them to increase debt issues, and because future reductions in the burden of current issues may be anticipated. At the same time, however, the holders of fixed rate debt suffer real losses, paying for any inflationary gains earned by the corporations. Thus to increase debt issue in inflationary periods, firms would have to offer a premium compensating holders for anticipated losses, the cost of which should cancel out any potential gains to be made, providing there are no asymmetries of information. Moreover, not all corporate debt used in the countries studied is fixed rate. On variable rate debt, higher rates of return will be required to compensate for reduced real yields in the face of inflation, and in anticipation of possible further reductions. Furthermore, if the real burden of outstanding debt does change in the presence of inflation, the value of equity is also likely to be
affected through changes in investor's preferences. In a discussion of the effects of inflation, it is important to specify whether debt and equity liabilities are measured at book or market values as the two can lead to quite different con clusions. There are thus many factors to be taken into account when considering the effects of inflation on the gearing ratio.
Another major determinant of corporate financial patterns, according to the literature at least, is taxation. The relative tax treatment of debt and equity should be significant in helping determine corporate gearing ratios, favouring debt over equity as interest payments are considered as fixed costs and therefore deductible against corporation tax. The bias implied by fiscal effects may be further enhanced when considered in conjunction with inflation as taxes are levied on nominal amounts. However, in this study we are interested in a comparative analysis of the behaviour of corporate gearing ratios over time, not in discrete changes in gearing ratios following modifications of national tax laws. Furthermore, the explanation of gearing in terms of fiscal considerations, although extremely important according to the literature, appears to behave rather poorly in empirical tests (see e.g. Coates and Woolley 1975; Mayer 1987b). Our efforts have not therefore been concentrated in this direction.
Instead, the traditional separation of finance and invest ment is then relaxed as more m o d e m theories are considered. The idea of non-neutrality of corporate financial structure and
policy lays behind the most recent theories of corporate finance which outline the role played by transactions, information and
agency costs in the determination of gearing ratios. Signalling theories are also considered in which the firm itself can affect the way it is viewed and priced, and the terms it is offered. Good profit performance, for example, could cause the firm to be more highly valued in the market, making profits another determinant of financial structure. At the aggregate level, we see that the position of the corporate sector as a whole may dictate the terms offered to individual firms.
Another factor that appears to help explain recent move ments in corporate gearing ratios is the trend towards liberalisation of capital markets. Since the late 1970s, financial markets in the major industrialised economies have been subject to Increasing competition, innovation and dereg ulation. Availability of existing instruments has increased, and many new instruments have been introduced, enhancing liquidity and generating both equity and credit. Increasing competitiveness and lower regulatory costs have allowed
I
reductions in required rates of return, and deregulation has broadened access. Mechanisms allowing the hedging of interest rate risk, and the transfer of price and credit risk have been introduced. At the same time, a general rise in the indebted ness of the corporate sector has been witnessed. Increased availability and lower required return on credit should allow higher investment. It might appear that measures to encourage increased corporate gearing ratios should therefore be encour aged. We see, however, that the benefits of financial liberalisation may be offset by a number of potentially damaging side effects.
Although deregulation, innovation and increased competition should help bring down the cost of financial capital, uncer tainty surrounding the liberalisation process may drive up required rates of return. In pricing new assets, for example, it is possible that markets fail to anticipate risk correctly and could demand too high (or low) a rate of return. Although it is unlikely that excessive yields would be earned for long in competitive financial markets, during the period in question, the high required rates of return on finance could deter firms from investing. On the other hand, yields could be driven down so far that risk is not properly accounted for: financial distress and bankruptcies might then ensue following, for example, an increase in interest rates due to demand pressures.
In this case, monetary policy itself may be affected. Governments in highly indebted economies might not be prepared to raise interest rates when necessary to curb inflation, for fear of provoking bankruptcies and potentially widespread financial instability. In this case, stability is maintained at the cost of rising inflation.
In chapter IV empirical evidence concerning the determi nants of corporate financial structure is presented and analyzed in an attempt to find an explanation for the recent deviation of movements in corporate gearing ratios away from counter cyclicality. Interest rate behaviour would not appear capable of explaining recent trends. We would expect the relationship between gearing ratios and real interest rates to be broadly negative. A fall in interest rates and the required rate of return on debt should, ceteris paribus, encourage corporations
to take out more debt. Low and often negative real interest rates in the 1970s were accompanied by rising gearing ratios. Since the early 1980s, however, real interest rates have been historically high. Very high required rates of return on debt should therefore discourage its use but, as mentioned above, there is no clear evidence of a slow down or reversal of the rate of growth of corporate gearing ratios.
The behaviour of inflation does not appear able to offer a satisfactory explanation for this phenomenon either. If inflation reduces the burden of fixed rate debt more than it increases rates of return required on variable rate and new fixed rate debt, we would expect Inflation and gearing to be roughly positively correlated at least in the short run. During the 1970s gearing ratios in the countries studied rose steadily in a decade of high inflation rates. Inflation has, however, slowed considerably since the late 1970s, but not the rate of increase in the gearing ratio. However, in the 1980s, increased
I
use has been made of variable rate debt suggesting that the advantages. deriving from the reduction in the burden of outstanding fixed rate debt in the face of inflation have been declining. The link between gearing and inflation could thus well have changed.
Empirical evidence of the effects of financial liberalisa tion on gearing ratios is then considered. We see that financial liberalisation has probably brought about an increase in the availability of credit and reduced credit rationing. It is also likely to have affected the cost of capital. Costs should have fallen in the face of deregulation, and as a result
of increased competition. However, it is difficult to assess risk on new instruments and existing instruments being traded in new conditions. Risk could be underestimated driving down yields further, or overestimated. These effects are only likely to be short term however, with 'correct' rates of return being demanded once risk position has been established. Nevertheless, in the short run at least, financial liberalisation could have a strong impact on risk premia. Risk premia could also be expected to move countercyclically, rising in recessions as creditworthiness deteriorates and vice-versa. So falling risk premia could have been expected in the 1980s as the industrialised nations moved out of recession. However, risk premia in the countries under consideration have risen in the 1980s. Moreover, they have been highest in the countries enjoying the greatest degree of financial innovation i.e the US and the UK.
In chapter V some very simple empirical tests are carried out. Attempts were made to estimate the determination of corporate gearing ratios over time, and the relationship between gearing and investment and gearing and monetary policy was investigated. We were unable to find any clear evidence to suggest that corporate sector financial behaviour has been influencing monetary policy in the way described above in the countries studied during the last two decades. There was, however, evidence suggesting that financial structure influences investment behaviour in a number of the countries. Finally, we saw that financial liberalisation appears to play an important role in the determination of corporate sector gearing ratios in
the countries where the liberalisation process has been most highly developed: the USA and the UK.
The thesis ends with a presentation of conclusions includ ing an assessment of implications for policy.
Over the past twenty years gearing ratios in Japan, France and Germany have been much higher than in the US and the UK. Investment as a proportion of GDP has also been higher in the former three countries than elsewhere. High gearing ratios would thus appear to be linked to higher investment. However, time series data shows that gearing ratios and investment have tended to move in opposite directions over the past two decades. Empirical evidence indicates that there has been a general rise in the outstanding stock of debt in the non-financial sectors, both public and private, of the major industrialised economies. Corporate sector gearing ratios have increased significantly over the last twenty years in the UK, the USA, France and Germany, while Japanese gearing ratios have fallen. At the same time
investment as a proportion of GDP has fallen in all of the countries studied, again with the exception of Japan. Trends in gearing ratios and investment would appear to be negatively related over time.
Detailed presentation of these results follows in the rest of this chapter.
A INTRODUCTORY REMARKS
Studies involving international comparisons of corporate sector behaviour run immediately into definitional problems: firstly, over what constitutes the corporate sector in each country1, and secondly, concerning the definition and coverage of the relevant data2. There are also differences in national accounting procedures (Nobes and Parker 1985) and modifications in these procedures over time. Much of the empirical work on international comparisons of trends in corporate financial structure has been based on national accounts data affected by these problems (Davis 1987; Borio 1990). The differences in definition can be fairly considerable. Any results derived must therefore be treated with a certain degree of caution. In this study information from the BACH3 data bank provided by the Commission of the European Communities has been used (Sananes 1989) . The BACH data bank contains harmonised data which avoids many of the problems involved in comparisons of national accounts
1 The SNA definition of the non-financial enterprise sector includes both public and private corporations, with unincorporated enterprises classified as belonging to the household sector. None of the countries considered here follow this definition however. Both Japan and France exclude large public corporations from the non-financial enterprise sector, arid the US and the UK exclude all public corporations. The US also includes unincorporated enterprises along with Germany.
2 See, for example, the Methodological Supplements of OECD Financial Statistics.
data.
The BACH data, which covers the EC, Japan and the USA, comes from a sample of company accounts intended to be representative of the enterprise sectors of these countries4. A study of this data source was considered an important contribution to the field. As such, information yielded by the BACH data bank is considered in some detail below.
The data in the BACH bank is assembled according to a standard accounting framework laid out in the Fourth Council Directive of 1978s. In this way
the bank will provide the best available estimates of a range of accounting variables, assembled on a comparative basis, because, as far as is known, no systematic attempt has been made, in the past, to place time series of company accounts for different countries on a basis that permits inter-country comparisons of balance sheets and profit and loss accounts.
Green and Sananes 1988: p 2
In this study we are interested in trends in corporate sector financial structure both over time and across countries. Balance sheet data covers the world wide activities of companies, including issues of securities on both domestic and foreign
* There are breaks in both the French and UK series in the early 1980s due to changes in accounting procedure.
markets. As such it contains comprehensive data on how companies fund themselves. This compares to flow of funds data which only records the domestic activities of companies and is more suitable for an analysis of domestic financial systems (Mayer 1989) . However, we are also interested in the consequences of observed funding patterns. One of the possible consequences investigated has been the link between observed corporate financial behaviour and investment. A thorough study of this area would ideally contain an analysis of financial flow data. However, while there are plans to extend the BACH data bank in the future to cover flow of funds data, at present only stock data is available. Investigation of the link between gearing and investment has therefore been somewhat limited.
The data on debt stocks has been aggregated across the companies sampled in each country in the data bank. As a result information 0n the nature of debt stocks is restricted: nothing may be indicated about the nature of debt i.e. whether it carries fixed or variable returns, whether it is transferrable, index- linked or carries roll over facilities, whether any simultaneous conditions have had to be fulfilled to obtain the debt, whether it is secured or unsecured, etc. For example, although secured loans are less risky than unsecured loans, they are far from risk free. Property lenders have had their fingers badly burnt in the current recession in the face of declines in property prices resulting in much reduced returns in the event of borrower
default. These characteristics should be explicitly considered wherever possible as they yield important information concerning
the implications of the debt in question.
The framework outlining the format of the BACH data set permits variations in accounting practices between countries, for example with regard to depreciation and the valuation of assets and stocks, limiting the degree of harmonisation to a certain extent. However, when using ratios, this problem is reduced to the extent to which the numerator and denominator are affected to similar degrees. As a result, we concentrate in this study on the behaviour of financial ratios.
Full details of definitions involved and data problems en countered are described as they occur throughout the text.
The corporate sectors of the US, the UK, Japan, France and Germany have been compared and contrasted. The members of this group have very diverse financial systems and characteristics, although there are sub-groups with a number of striking similari ties. The degree of diversity among the countries in the sanple can only enhance the validity of any conclusions reached. For
m
these countries, the BACH data bank contains valid and comparable data on the corporate sector financing patterns over a reasonable length of time. It should be noted however, that the framework outlined by the Fourth Directive has had to be applied retrospec tively and the extent to which conversion could be achieved has been limited.
Selection of the time period to be investigated is of major importance. In the introduction we outlined theoretical reasons why the corporate gearing ratio should move counter-cyclically.
Ideally, a fairly long time period should be covered if this hypothesis is to be assessed empirically. However, in order to enhance the validity of empirical results in a study involving international comparisons, where feasible all quantitative analysis has been based on the harmonised data found in the BACH data bank. Unfortunately the BACH data bank contains observa tions starting only in 1971 or even later (1975 for Japan and 1983 for the USA) . Various other sources have been used to extend the very short BACH series for the US, none of which are strictly comparable with the BACH data. Care must thus be used in interpreting the relative magnitudes of trends observed in the US as opposed to the other countries in the sample.
Thus although the trend increases in gearing ratios that would be expected following downturns in economic activity are clearly in evidence between 1971 and the early 1980s in France, Germany and the UK, this is not the case in the US and Japan. However, other studies (e.g. Taggart 1985; Davis 1987) indicate that US gearing ratios during the 1970s had increased sig nificantly from those prevailing in the 1960s. The same evidence cannot be found for Japan. We will shortly see that this is due both to circumstances specific to Japan, and to differences with the rest of the group concerning classification, measurement and
characteristics of instruments used (see White 1984) which have not been completely eradicated despite the use of a harmonised data set such as the BACH data bank. With the exception of Japan, then, if a long enough time period is considered, corporate gearing ratios would indeed appear to have moved counter-cyclically in the countries studied until the early 1980s.
We will shortly see that since this time, however, the pattern would appear to have broken down.
B GEARING RATIOS
The BACH data bank contains balance sheet data at historical costs*. Although the BACH data yields many advantages over other sources in terms of coverage and comparability of sources, the use of book value data at historical costs can be problematic. While historical cost book values are considered by accountants
‘ Harmonized data on the US is only available from 1983. In order to provide longer series on the financing of US industry, data has been taken from OECD Financial Statistics. The data is measured at current values and is not thus strictly comparable with the BACH data. Furthermore, the OECD data covers the non-financial corporate sector. The stock of debt with respect to equity would appear to be lower in the more broadly defined OECD sector and thus ratios derived from OECD data with equity in the denominator will be consistently lower than the BACH ratios. However, on the whole both measures indicate similar behaviour with regard to the trends of the various ratios considered in this chapter.
to be objective and verifiable by an independent third party (i.e. an auditor) , and anecdotal evidence suggests they are often used by banks and corporate managers when making- financial decisions, they can get seriously out of line with current market values (Parker 1983). This is especially true in times of inflation when problems in the interpretation of equity values are particularly acute. Ideally, we should correct for this by using data at market values. However, we have not been able to obtain a (consistent) set of data at market prices of anything like the quality and extent of the BACH data. Moreover, market
\
values include the discounted value of expected future dividends which can give a misleading picture of cash flow and solvency positions.
Although we are interested in aggregate corporate sector behaviour, there are gaps in the coverage of certain industries in the BACH data bank. Data on the manufacturing sector is the most extensive and of superior quality to the data on other sectors in the bank. We have thus limited ourselves to using data on the manufacturing sector7. The trade-off of using the superior data is that the results produced may not represent aggregate corporate sector behaviour entirely accurately, and in
7 The OECD data for the US covers the non-financial corporate sector. The stock of debt with respect to equity would appear to be lower in the more broadly defined OECD sector and thus ratios derived from OECD data with equity in the denominator are consistently lower than the BACH ratios. However, on the whole both measures indicate similar behaviour with regard to the.
particular do not take account of the behaviour of the services sector which has displayed substantial growth and development during the 1980s. Nevertheless, many of the financial choices and decisions facing companies in the manufacturing sector are common to all industries. It should be noted, however, that certain subsectors have specific problems. Small businesses, for example, are generally not able to obtain finance on the same basis as larger companies. Larger companies enjoy economies of scale when raising finance, paying lower proportionate fixed costs such as fees, accountancy costs etc. Small and medium sized companies can often face particular problems when trying to obtain credit. They may not have the track record of larger firms, or the negotiating power. As a result, credit can be both relatively expensive and difficult to obtain. Although the BACH data bank does contain some information on financing by company size, the data are very limited and it has not therefore been possible to carry out an analysis of financing behaviour by size.
Given that the BACH data is at historical book value, and that it comes from only a subset of firms, any attempt at inter temporal or inter-country analysis using t”he absolute values contained in the bank would not be recommended. However, comparisons of the behaviour of ratios can be usefully made. The usefulness of the BACH data bank is further enhanced in a study such as this where trends are compared not only across time, but also across countries since the data have been harmonised as much
as possible. Using this source, we outline below the behaviour of gearing ratios over time in the various countries considered.
B.l Corporate Gearing Ratios
Corporations may choose between three sources when deciding how to fund industrial investment: retained earnings, equity issue or debt issue. The retained earnings of the firm are owned by the shareholders and therefore represent internal equity. The basic choice to be made is thus between the use of debt or equity. In figure II.1 measures of total debt as a proportion of total liabilities (total debt plus equity) in the five countries studied are presented.
In this study, total debt liabilities are measured by short term debts including bank loans and overdrafts, and trade and other creditors of less than one year, and long-term debts including bank loans and other creditors of more than one year, provisions for liabilities and charges, accruals and deferred income. The definition of debt instruments is not always straightforward. It should be mentioned, for example, that there is some debate as to the appropriate classification of provi sions. White (1984) measures provisions as equities. He suggests this is appropriate in studies involving international comparisons since provisions are viewed in significantly different ways in different countries. In Japan for example many
provisions may be offset against taxable income8, and there is therefore an incentive for Japanese corporations to declare higher sums for these provisions than is the case elsewhere, and thus to understate equity. When provisions are classed as debts, the gearing ratio thus appears much higher in Japan as compared to other countries than it would if they were not classed as debts. For this reason, White chooses to class all provisions as equity. However, the majority of provisions for e.g. pensions, deferred taxation, etc. are liable to be incurred and should thus be considered debts. Hence, although the problem of classifying provisions is recognised, we choose not to follow White.
* For example, inventory price fluctuations, doubtful receivables, development costs, etc.
II.1 The Ratio of Total Debt to Liabilities
Source: BACH, Commission of the European Communities and OECD Financial Statistics (USA*)
Another problem lies with the category 'trade creditors', which is defined in different ways in different countries (for example, in Japan, the UK and the US consumer credit extended by retail businesses is included, but not in the other countries) . These differences are compounded by differences in sectoral definitions - for example, the more wide-ranging the definition of the corporate sector is, the greater is the likelihood that the various credits extended will cancel each other out. Thus there is usually great variation in this measure. Some scholars choose to leave this measure aside in the search for greater accuracy at the cost, however, of a less representative measure.
In our case, although the problem has not been completely eradicated in the BACH data bank, the high degree of harmoniza tion achieved allows us to include this data as well.
~ In figure II. 1 two features in financing trends over the past twenty years become immediately obvious: first, there has been a general rise in debt ratios over the period, with the exception of Japan, and more recently, France; and second, there have been significant differences in gearing levels, with the rates in the USA* and the UK being much lower than elsewhere.
The decline in the Japanese ratio may be explained by the relative strength of the Japanese economy. After the second world war, the Japanese economy grew very quickly as attempts were made to catch up with the West. A high saving rate provided substantial funds for industry and Japanese managers were able to engage in high levels of capital spending thanks to various incentives, such as very high rates of depreciation. Along with the rest of the industrialised world, Japanese industry also benefitted from the very low real rates of interest prevailing in the 1970s. As a result, Japan alone of the countries studied did not enter recession in the early 1980s. Relatively high levels of corporate profits were thus earned, boosting equity
9 Although there is a significant difference between the two measures of US gearing, both measures are much lower than
ratios found in the other members of the group, and both measures display the same trend during periods of co-existence. From now on, separate consideration of the two measures is not carried out explicitly unless necessary to the issues being discussed.
capital and reserves10, and encouraging new equity issue.
Although in the BACH data bank both debt contracts and shares are measured at nominal historical values, the book value of new issues is of course the market price at the time of issue (less any discount offered on issue). In inflationary periods a firm enjoying high nominal profits and earnings could expect to enjoy an increase in the market value of its securities and find new issues highly valued. Unless the value of new issues of debt exceeds the value of new internal and external equity, gearing ratios decrease. In this situation, signals given by the data are clearly biased, since outstanding stocks are not measured at the same price as the new issues. The extent of the bias increases with the proportion of stocks that are not revalued. Thus the greater the proportion of short-term debt in total debt, and the more short-term the contracts are, the less serious the bias becomes, as unanticipated inflation can then be accounted for when old contracts are renewed, or new contracts are drawn up.
A more serious problem with regard to measurement of longer term debt is that no indication is given in the BACH data bank of the proportions of fixed and floating rate debt. If monetary policy is tightened in the face of high inflation, the real
10 In this study, reserves include: share premia, legal, statutory and other reserves, minority interests, and profit for the financial year. Given that the data are at historical costs, reserves arising from the revaluation of assets are not included.
burden of fixed rate liabilities falls, while required rates of return on floating debts are increased in line with higher interest rates. Although the use of floating rate debt has tended to increase in recent years, the lack of information in the BACH data bank makes it rather difficult to interpret the impact of inflation on long term debt.
In figures II.3a and II.3b below we see that in the period under consideration 60-70% of Japanese corporate debt was classified as short-term (less than one year), and the potential bias outlined above with regard to debt was thus likely to have been relatively small. The same is true of the French and particularly the British corporate sectors, where high propor tions of short-term debt have also been used. The problem may be slightly more serious in Germany, and particularly the USA, where proportions of short-term debt used are rather low. It is
thus possible that gearing ratios in Germany and the USA are somewhat understated with respect to the other countries in the sample, the true value of debt being relatively more understated than elsewhere.
In the 1980s, the trend decrease in Japanese corporate gearing ratios would not appear to have been reversed. There are a number of reasons for this. Firstly, real interest rates in Japan Tas elsewhere) have been historically very high (see chapter IV, section B.2), making the use of debt relatively unattractive. Financial developments and reforms have helped
increase the supply of finance, including equity. At the same time, real equity yields have been falling (see chapter IV, section B.4). Thus both the absolute and relative real return required on debt has been rising in Japan over the period studied, encouraging companies to increase the relative use of equity in financing activity11.
In France, on the other hand, rather unusual behaviour may be observed in the 1980s. A significant rise in the corporate gearing ratio occurred in the early 1980s followed by a much greater fall after 1984. A number of factors specific to the French economy may help explain this behaviour.
Between 1981 and 1984 the French economy was subjected to 'stop-go' policies which ended up giving France the highest rates of inflation in the group during this period (see chapter IV, figure IV.10). At this time, the corporate gearing ratio was already following an upward trend due to the low real interest rates enjoyed during the 1970s. Moreover, inflationary expect ations are likely to have encouraged the use of debt, signifi cantly reinforcing this trend. Since the early 1980s, however, there has been a substantial increase in real interest rates in France, as elsewhere. Real long-term rates of interest have been second only to those in the US since 1984 and the highest since 1986. These high required rates of return would appear to have
11 Evidence on the relative cost of finance may be found in chapter IV, section B.5.
begun to outweigh the inflationary benefits of debt at a certain point, causing the use of corporate debt relative to equity to fall. Huge increases in the issue of equity have occurred since 1984. Very tight monetary policy was introduced in 1984 successfully reducing inflation, and the relative supply of corporate debt thus decreased as real returns increased and inflation was expected to continue to fall. Improving corporate sector performance and business confidence consequent upon the subsequent world boom helped boost equity values, allowing the market in equity to become buoyant. A sharp increase in the
\
index of share quotations in France has even exceeded Japanese increases since 1984. Since that time, firms have continued to boost equity holdings and reduce debts as disinflation reduces the extent to which the real burden of debt declines (OECD, 1988/89).
In the UK, the USA and Germany, however, a steady increase in the corporate gearing ratio was witnessed during the 1970s during a period of high inflation and low real interest rates. These factors would appear to have been two of the main deter- minants of corporate financial behaviour in the past, but their influence during the past decade would appear to have weakened significantly. In the 1980s, gearing ratios have continued to increase despite falling inflation and very high real interest rates. A further major determinant of corporate financial behaviour would thus appear to have come into play during the
1980s: a common explanatory factor would appear to be financial liberalisation. In the UK and US where liberalisation has been particularly strong steady increases in gearing have been ex perienced, whereas in Germany where the liberalisation process has been more hesitant increases in the corporate gearing ratio have been more erratic.
We could expect gearing ratios to rise in line with greater financial liberalisation for a number of reasons. Innovation arising from the liberalisation process should bring about increased availability of credit through the introduction of new
\
instruments, and through increased use of existing instruments. Financial deregulation should reinforce this trend. These factors are likely to reduce the incidence of credit rationing, with a shift in allocation from quantity to price rationing. At the same time increased competition is likely to reduce non profit maximising behaviour, and the shaving of margins should bring about a decrease in required rates of return. Increased uncertainty surrounding the liberalisation process might cause risk premia and debt yields to rise in the short term, but competitive forces are unlikely to allow excessive yields to be earned on new instruments for long. On the other hand, margins could be shaved too finely, not taking adequate account of risk. Again,, this is only likely to be a short term phenomenon with required rates of return subsequently rising as evidence arises that risk has not been sufficiently taken into account.
To sum up, in the face of financial liberalisation, increased availability and reduced rates of return required on credit is likely to encourage firms to increase gearing ratios, all other things remaining unchanged. In the short term, there may, however, be a degree of over- or under-shooting in pricing new instruments until risk position is established.
The rising trend in the US has been reinforced by substan tial debt issue used to retire equity (illegal except in very rare circumstances in the UK12), and by the substitution of debt for equity in leveraged buy-outs, the scale and prevalence of which may themselves be largely due to the liberalisation process. Greater financial competition encouraging extended use of existing or creation of new financial resources has allowed the build up of powerful, profitable corporate empires through various means e.g. mergers, takeovers and buy-outs. This puts increasing pressure on companies to behave in a predatory way. Failure to do this may be interpreted by the markets as a sign that they are not able to. To avoid becoming prey to acquisi tive corporate behaviour, firms have thus had to behave increas ingly aggressively simply to survive and not be taken over. Furthermore, during the 1980s members of the financial sector would appear to have been encouraging this trend in order to compete for the heavy sums to be made through various fees and
13 Redeemable preference shares made be bought back by UK corporations.
commissions. A great deal of this activity was financed by debt. This suggests that the demand for the finance necessary to carry out this activity has increased, but it also implies that finance obtained is going less to physical than to financial investment. This would certainly appear to hold in the manufac turing sector. In figure II.9 below we see that despite rising gearing ratios gross fixed capital formation as a proportion of GDP has been in steady decline over the past twenty years in the countries under consideration, with the exception of Japan. However, in the countries studied manufacturing investment has also been in relative decline over the past twenty years, so a falling share of manufacturing investment in GDP is not surpris ing.
With regard to the large differences in the levels of gearing ratios pointed out above, there are a number of possible explanations.' Firstly, there are some problems with the data. As mentioned above, figures in the BACH data bank are at historical costs, and therefore the value of company assets and equity etc. are generally undervalued in real terms, especially in periods of high inflation. This problem affects all coun tries, but there are certain accounting differences between the countries that remain despite attempts to harmonize the data. For example, French and British companies periodically revalue their assets whereas the companies in the other countries in the sample do not. Furthermore, a large number of provisions, which
are generally classed as liabilities, may be used to offset corporation tax in Japan, much more so than elsewhere. There is therefore an incentive for Japanese companies to use these widely. Japanese equity is thus probably understated. Another significant difference may be found in the fact that French, German and Japanese company accounts are not consolidated. Debt in these countries will thus appear much higher than in the US and the UK where accounts are consolidated and inter-company debt is netted out13. Obviously, the greater the proportion of inter company debt, the more serious the problem. However, although gross trade credit appears substantial in a number of the countries studied, when inter-company debt is netted off, net trade credit is negligible (Mayer 1989).
There are also a number of theoretical explanations. It would not appear that the traditional determinants of corporate gearing e.g. taxation, inflation and cost of capital are sufficiently similar between the US and the UK and different from the rest to explain the results observed. Coates and Woolley (1975) thus conclude that these differences^ in behaviour are due to institutional or attitudinal reasons. On the other hand, Hu (1975) (see chapter III.A.8 below) provides an historical explanation of the gap between the low-geared US and UK corporate
u Even US and UK accounts are not perfectly compatible on this point since the UK accounts are consolidated on a world wide basis, whereas in the US most domestic parents and sub sidiaries are consolidated, but foreign operations are treated on an investment basis.
sectors as compared to the rest. When we analyze the nature of these gearing ratios more closely, the picture becomes a little more comprehensible.
Corbett (1987) states, for example, "the structure of corporate finance in Japan creates a type of contract between banks and clients which is neither conventional debt nor equity holding but a blend of the two'14. High debt levels in Japan do not thus have the same implications as elsewhere. Whereas in the UK and the US banks will look carefully at the value of firms in terms of the security they provide against loans advanced, in Japan the banks tend to be more interested in the value of the firm as a going concern rather than simply its ability to satisfy short term obligations. They are thus prepared to take a longer term view, being prepared even to sustain short-term losses if necessary, and to actively step in and help the firm in the event of financial difficulties. Similar links are also to be found between German banks and corporations. High gearing ratios in these countries do not thus have the same implications in terms of risk that ratios of similar size in the US or the UK would.
In an attempt to look more closely at the debt-liability ratio, a breakdown between long- and short-term debt was subse quently made.
Looking at the results produced (figs. II.2a to II.2e), we see that the proportion of short-term debt in the gearing ratio
tends to be much higher than the proportion of long-term debt with respect to total liabilities. An exception is to be found in Germany, where the ratios were more or less evenly matched ~until the early 1980s after which time the proportion of long
term debt actually began to exceed the proportion of short-term debt, and the USA, where long-term debt exceeded short-term debt throughout the period. An analysis of the breakdown is important in this study as it has significant implications for corporate investment.
Longer term debt may give greater freedom to invest than
\
short term debt as returns do not need to be earned so quickly. With access to long-term debt, short-term losses can even be made in the anticipation of long-term gains: a likely occurrence with projects that require heavy initial outlays and that generate returns only after a considerable delay. Predominate use of short-term debt may mean that some potentially profitable projects are not undertaken. A tendency to undertake smaller projects that do not require large capital borrowing or that can be financed from retained earnings, or projects that yield short term profits may arise. It is also possible that investment in areas that do not yield tangible returns, such as advertising and research and development may be curtailed.
Debt - Liability Ratios
II. 2a Germany
Tart
II.2d Japan II.2e USA
Source: BACH, Connnission of the European Communities and OECD Financial Statistics (USA total* short* long*)
However, short-term debt can often be rolled over and it is generally relatively cheaper than long-term debt. Where firms feel secure of roll-over facilities, short-term debt can have similar characteristics to long term debt, but with a lower required rate of return. Thus in figs. II.3a and II.3b we see that although the UK has the lowest proportion of long-term debt with respect to total debt, as well as the lowest level of investment in the group (see section D below), and that -Germany at the other end of the scale enjoys the second highest propor tion of long-term debt in total debt and the second highest level
of investment, the relationship between these variables is far from straightforward. Japan has the second lowest proportion of long-term debt but the highest level of investment in the group, whereas the US has the highest proportion of long-term debt but the lowest level of investment.