UNIVERSITÀ DEGLI STUDI DI SASSARI CORSO DI DOTTORATO DI RICERCA
Scienze Agrarie
Curriculum Scienze e Tecnologie Zootecniche Ciclo XXXI
Utilization of information and communication
technologies to monitor grazing behaviour in sheep
dr. Rossella Cossu
Coordinatore del Corso Prof. Ignazio Floris Referente di Curriculum Prof. Corrado Dimauro
ACKNOWLEDGEMENTS
I would like to thank all members of the Section of Animal Science (Department of Agricultural Science, University of Sassari, Italy): professors, researchers and technicians for their scientific support, teaching, assistance, friendship and collaboration.
I would like to express my special thanks to my supervisor Professor Salvatore Pier Giacomo Rassu for his constant human support, teaching, scientific advice, and help. Special thanks to Doctor Valeria Giovanetti and Doctor Mauro Decandia for their writing support, for their careful revisions and comments which were of great help for improving the manuscript and for their friendship.
Particular thanks to Doctor Corrado Dimauro for his precious help in statistical analysis of data, for his time and for the courtesy showed during these years.
Thanks to all members of the Servizio per la Ricerca Zootecnica (Agris, Olmedo, Italy) for their availability and for human and animal resources provided to develop the experiment, in particular Doctor Carla Manca, Doctor Gabriella Serra, Doctor Giovanni Molle, Doctor Marco Acciaro, Doctor Andrea Cabiddu and Doctor Gianpaolo Epifani, for their scientific help and collaboration.
Particular thanks to the technicians Stefano Picconi and Salvatore Pintus for their indispensable assistance and support during the experimental trials.
Special thanks to my colleagues for their help, friendship and collaboration and for
having shared with me emotions, difficulties and moments of leisure during these years. My sincere thanks to my family for always having supported and encouraged me along the way.
TABLES OF CONTENTS
CHAPTER 1: Review of the literature 1
1. INTRODUCTION 2
1.1 Grazing behaviour and feed intake 3
1.2 Behavioural parameters and measuring techniques 5
1.2.1 Global Positioning System (GPS) 7
1.2.2 Pedometers 10
1.2.3 Acoustic telemetry 12
1.2.4 Accelerometers 15
1.3 Practical implications of literature 24
2. REFERENCES 26
CHAPTER 2: Automatic classification system for grazing, ruminating 42
and resting behaviour of dairy sheep using a tri-axial accelerometer ABSTRACT 43
1. INTRODUCTION 44
2. MATERIALS AND METHODS 47
2.1 Experimental site and animal management 47
2.2 Accelerometer device and feeding behaviour recording 48
2.3 Preliminary data processing 50
2.4 Statistical analysis 51
3. RESULTS 53
3.1. Discrimination of behaviour activities 54
3.2. Prediction of rate of biting 57
4. DISCUSSION 57
4.1 Discrimination of behaviour activities 57
4.2 Prediction of rate of biting 62
5. CONCLUSIONS 62
6. ACKNOWLEDGEMENTS 63
CHAPTER 3: The effect of different time epoch settings on the 70
classification of sheep behaviour using tri-axial accelerometry ABSTRACT 71
1. INTRODUCTION 72
2. MATERIALS AND METHODS 75
2.1 Experimental site and animal management 75
2.2 Description of the BHEARUM device and feeding behaviour 76
recording 2.3 Preliminary data processing 78
2.4 Data processing 79
3. RESULTS 81
3.1. Discrimination of behaviour activities 86
3.2. Performance of the discriminant analysis model 92
4. DISCUSSION 94
4.1 Discrimination between behaviour activities 94
4.2 Performance of the discriminant analysis model 97
5. CONCLUSIONS 100
6. ACKNOWLEDGEMENTS 101
CHAPTER 4: Relationship between accelerometer features and behavioural 107
traits in Sarda dairy sheep submitted to short term grazing test 1. INTRODUCTION 108
2. MATERIALS AND METHODS 111
2.1 Forage species 111
2.2 Micro-swards establishment and management 111
2.3 Experimental design 112
2.4 Animals and training 112
2.5 Measurements 113
2.6 Preliminary data processing 115
2.7 Statistical analyses 115 3. RESULTS 117 4. DISCUSSION 122 5. CONCLUSIONS 126 6. REFERENCES 127 GENERAL CONCLUSIONS 132
LIST OF TABLES
Chapter 2
Table 1. The effect of the behavioural activity classes recorded in grazing sheep on the mean (M), variance (V) and inverse coefficient of variation (ICV) of acceleration values per minute along the X, Y and Z-axis and the resultant
54
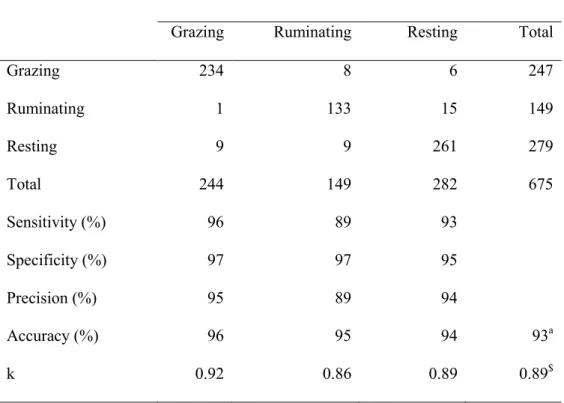
Table 2. Standardized canonical coefficients 55 Table 3. Distribution of the total error and performance in the assignment
of behaviour activities, predicted on the basis of accelerometer data
56
Chapter 3
Table 1. The effect of the behavioural activities recorded in grazing sheep on the mean (M), variance (V) and inverse coefficient of variation (ICV) of acceleration values per minute along the X, Y, Z-axis, force (F) and the resultant
82-85
Table 2. Allocation (expressed as percentage of the total) of the prevailing behavioural activity in the three classes of percentage considered for each epoch setting
86
Table 3. Variance explained (λ1, λ2) and standardized canonical coefficients at different time epoch settings
87-88
Table 4. Mahalanobis distance from main behavioural activities at different time epoch settings
Table 5. Performance of the model in the assignment of the behaviours at different time epoch settings
93-94
Chapter 4
Table 1. Chemical composition (on DM basis) of forage species offered as
micro-swards during the behavioural test
118
Table 2. Behavioural parameters of dairy sheep fed with different forage treatments (Lsmeans ± SE)
119
LIST OF FIGURES
Chapter 1
Figure 1. Caw wearing GPS collar 9
Figure 2. Pedometer fastened on a cow’s leg 11 Figure 3. Microphone attached to the forehead of a cow and to the horn of
a sheep
13
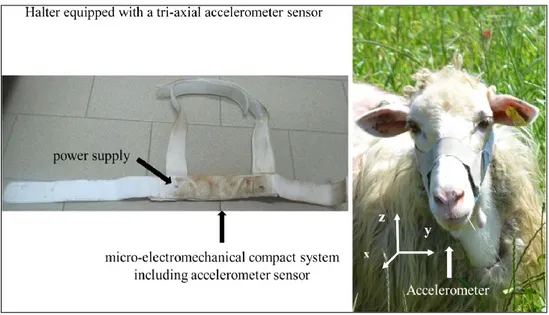
Figure 4. Tri-axial accelerometer attached to an halter 15 Figure 5. Description of RumiWatch noseband sensor 18
Chapter 2
Figure 1. Halter equipped with a tri-axial accelerometer sensor 48 Figure 2. Plot of canonical variables (CAN 1, CAN 2) generated from
discriminant analysis
55
Chapter 3
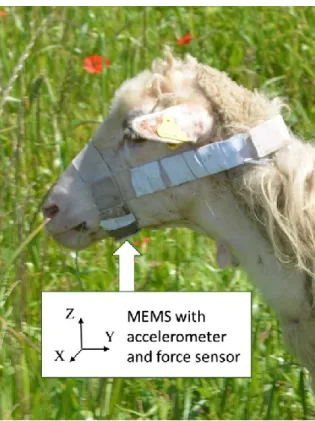
Figure 1. BEHARUM halter with accelerometer and force sensor inserted in a micro-electromechanical compact system (MEMS) positioned under the jaw
77
Figure 2. Distribution of errors in assignment of DA after bootstrap procedure among epoch settings
89
Figure 3. Plot of canonical variables (CAN 1, CAN 2) generated from discriminant analysis for different time epoch settings
Chapter 4
Figure 1. Sheep during the test 114
Figure 2. Plots of predicted versus observed values of behavioural variables
Review of the literature
1. INTRODUCTION
In all production systems, especially in extensive ones, it is economically convenient to maximize the proportion of forage in the diet to minimize feeding costs (Baumont et al., 2000). The study of the feeding behaviour of grazing ruminants is of fundamental importance for the improvement of pastures management and animal productivity, respecting environment and animal welfare (Blomberg, 2011; Swain and Friend, 2013). The information about feeding behaviour of herbivores allows indeed to evaluate the degree of use of the pasture by the animals and to avoid localized overgrazing (Bailey, 2004; Wark et al., 2007) or undergrazed areas, both of which may favour shrub encroachment and woody phytomass, increasing fire hazard (Jáuregui et al., 2009). Overgrazing indeed, by excessively reducing the biomass, can cause the collapse of grass cover, favouring the development of shrubs as dominant vegetation (D'odorico et al., 2012), as well as the undergrazing. Moreover, overgrazed areas can reduce biodiversity and plant cover and are often associated on one side with risks of soil erosion and on the other with nutritional imbalances of the flock or herd (Braghieri et al., 2005). If grazing does not allow the animals to satisfy their nutritional requirements, it may be necessary to supplement their diet to avoid decreases of growth and of productive and reproductive performances (Gordon, 1995).
The productivity of grazing animals depends indeed on feed intake, which is a difficult parameter to measure, especially for long periods of time (Milone et al., 2012).
This review aims to investigate the principal parameters that allow a better understanding of grazing behaviour of sheep and the methods used for their detection, highlighting their strengths and weaknesses.
1.1 Grazing behaviour and feed intake
At pasture, the composition of the diet, the intake, and the impact of grazing on vegetation are the result of a complex interaction between social grouping tendencies of the animals and their foraging decisions (Baumont et al., 2000; Dumont and Boissy, 2000). Herbivores, and in particular small ruminants, exploit environmental heterogeneity through selective grazing, which allows them to consume a diet with a higher nutrient quality than that offered, and to distribute their impact on vegetation (Baumont et al., 2000). Predicting intake and animal impact on vegetation requires an understanding of their grazing behaviour; when ruminants start eating, they select a feeding site and then a patch within it, the choice of which is influenced by various factors such as vegetation characteristics, distance from the water, need for shelter and social factors (Baumont et al., 2000).
Dumont and Boissy (2000) for example found that sheep, being typically gregarious animals, chose feeding sites located close to their social group and not those located further away, unless they are followed by other peers.
Bailey and Provenza (2008) found that initially animals graze on areas rich of nutrients, then, when these areas become depleted, they move to other areas characterized by lower quality and quantity of forage. The forage depletion in the area and the expectation of feeding opportunities in other sites, are the motivations that induce the animal to move to another patch (Baumont et al., 2000).
The rate of feed intake and the nutritional content of the diet are influenced by a series of short-term animal decisions that regulate grazing process (Gordon, 1995).
The way animals use the forage resources is affected by many factors, such as pasture composition, plant morphology, forage quality and quantity (Bailey et al., 1996; Harris et al., 2002).
Ruminants, and ewes in particular, generally prefer feeds that are more digestible, richer in energy and which quickly provide a high level of satiety (Provenza, 1995; Baumont et al., 2000; Pulina et al., 2005). The selective grazing of sheep allows them to minimize metabolic discomfort, to reach their nutritional requirements and to avoid toxic matter (Pulina et al., 2005). They use their senses, in particular smell and sight, to select or avoid aliments, according to the post-ingestive effects that they experiment (Bailey and Provenza, 2008). Thanks to the previous learning indeed, herbivores are able to recognize the feeds and to anticipate the nutritional and physiological consequences of their intake, that is essential to determine the motivation to eat and the feed preferences (Baumont et al., 2000). Post-ingestive stimuli are also involved in the control of the satiation process: during a main meal, intake rate is higher at the beginning and then decreases as animal moves towards satiety. The chemoreceptors present in the rumen wall stimulate the rumination behaviour in order to accelerate the digesta outflow and to avoid excesses and nutritional disorders (Baumont et al., 2000).
According to Hodgson (1985), feed intake is regulated by three different factors: bite mass, bite rate and total grazing time:
where bite mass can be calculated by dividing daily herbage intake by total daily bites (intake/bites), bite rate can be expressed as the number of bites per unit of time (bites/unit time) and grazing time is the effective time spent grazing.
Bite mass is the variable with the greatest influence on intake and is affected by sward structure, while bite rate and grazing time are compensatory variables (Forbes, 1988). For example, when food availability is low, such as on pastures with short grass heights, the animal can compensate for the reduced bite mass by increasing daily grazing time, increasing the rate of biting or trying to select higher quality food, in order to compensate for the reduced quantity of forage and to meet its nutritional requirements (Iason et al., 1999).
1.2 Behavioural parameters and measuring techniques
Measuring herbage intake is important to understand the relationship between sward structure and animal nutrition, to asses forage attractiveness and to improve management practices and performances of animals in grazing systems (Gordon, 1995; Undi et al., 2008; Tani et al., 2013).
However, the accurate measurement of feed intake in free-ranging animals is still a challenge, mostly in extensive systems (Undi et al., 2008).
In the past, one of the most used methods for the study of feeding behaviour was the direct and continuous observation (Bourbouze, 1980), that consists in following and recording the activity of a focal animal, chosen randomly, for a time period of at least 8-10 minutes. This method is very labour intensive, can alter animal behaviour and can be difficult to apply in mountain environments, during night grazing or in the presence of adverse weather conditions (Langbein et al., 1996; Sheibe et al., 1998).
To overcome the aforementioned problems, in recent years it has been possible to see a considerable development of automatic systems based on small, light and minimally invasive sensors, able to measure physical or behavioural parameters of individual animals and to convert them into signals for the observer (Scheibe and Gromann, 2006; Rutten et al., 2013; Abbasi et al., 2014).
Automatic recorders like radio tracking devices, pedometers, sound recorders and three-axial accelerometers have been widely used in several works and by farmers for different purposes: to track animals spatial distribution in relation to feeding resources (Bailey and Provenza, 2008), to monitor health status (Ito et al., 2010), to improve fertility (Nebel et al., 2000), to measure metabolic parameters (Edwards and Tozer, 2004) and to study grazing behaviour (Navon et al., 2013; Oudshoorn et al., 2013; Alvarenga et al., 2016).
Over the years various devices have been tested to monitor ruminants behaviour: IGER Behaviour Recorder (Rutter et al., 1997), Tinytag® data loggers (O’Driscoll et al., 2008), IceTag® activity monitors (Trénel et al., 2009; Mattachini et al., 2013) and HOBO® Pendant G Data Logger (Moreau et al., 2009; Nielsen, 2013) showed a high correlation between direct behavioural observations and devices data. However, their use has been limited because many of these systems are expensive, difficult to apply to animals and require experience for interpreting the obtained data (Watanabe et al., 2008; Yoshitoshi et al., 2013).
Nevertheless, there is an increasing trend towards the automation of various farming processes and a greater need to acquire data on animals, in order to improve work conditions, reduce health problems, increase production and improve farm management
by reducing costs (De Koning and Rodenburg, 2004; Rutten et al., 2013). Moreover the development of increasingly powerful electronic tools, with greater sensitivity and data storage capacity, can open new perspectives for the study of animal behavioural activities (Moreau et al., 2009).
The most promising devices in the near future are based on accelerometric sensors, that also in combination with other methods, allow to measure a lot of important parameters such as grazing behaviour (Watanabe et al., 2008; Robert et al., 2009), energy expenditures (Halsey et al., 2011; Miwa et al., 2015) and the rate of dislocation of the animals (Bidder et al., 2014). Indeed the acceleration devices are very small, relatively easy to attach to the animals and offer the opportunity to record a large amount of data. Their use is possible in almost all fields of life and it would be worth implementing it, both on a scientific and business level (Scheibe and Gromann, 2006; Swain and Friend, 2013; Abbasi et al., 2014).
Radio tracking devices and sensors like pedometers, sound recorders and three-axial accelerometers, indeed, have been widely used to determine animals spatial distribution in relation to feeding resources and to study their grazing behaviour (Swain and Friend, 2013).
1.2.1 Global Positioning System (GPS)
Monitoring foraging behaviour of herbivores is important to limit the impact of animals on pastures (Hulbert et al., 1998; Giroux et al., 2012).
Remote control systems can provide researchers to obtain information about grazing behaviour and about interactions with the environment, by evaluating the density of use of the different grazing areas (Turner et al., 2000; Handcock et al., 2009).
Over the years, various technological solutions have been adopted to monitor animal behaviour in different environments. From the early 50s, radio telemetry began to be used for animal monitoring research (Barbari et al., 2007).
Very High Frequency (VHF) technology is based on a radio signal emitted by a transmitter attached to the animal and picked up by a directional antenna connected to a radio receiver. This technique allowed the researchers to follow the animals and to record their activities without altering their natural behaviour, but it has shown several drawbacks due to loss of signal and to errors in estimating the distance travelled by animals (Turner et al., 2000; Barbari et al., 2007).
In addition, the VHF radio technology allows to record only small amounts of data and can receive the signal at a distance of a few kilometres, so it is only applicable to animals that are within limited areas (Barbari et al., 2007).
From the 90s, GPS technology based on satellite telemetry systems have been developed and allowed to overcome many of the limits of the VHF radio telemetry, recording a high number of data on geographical location of animals for the whole day (Rodgers, 2001). Initially the GPS collars, for studies on animal localization, were used to obtain information on wildlife; recently, they were used for works on the determination of best management practices for domesticated grazing animals (Hulbert et al., 1998; Ungar et al., 2005; Schlecht et al., 2009).
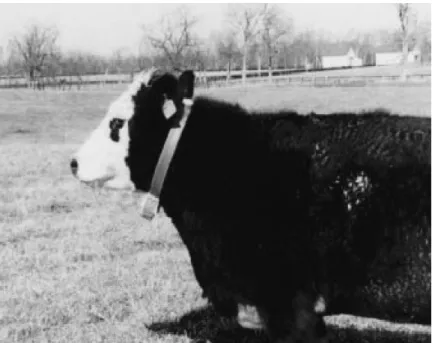
Recent advances in GPS technology allowed to update programs in order to obtain collar receivers (Figure 1) suitable for monitoring animal position even at short time intervals (Turner et al., 2000).
Figure 1. Caw wearing GPS collar. Adapted from Turner et al. (2000)
Data can also be imported into a Geographical Information Software (GIS) package, which allows to summarize and analyze many positioning data and to evaluate animal behaviour and pasture utilization with greater precision (Bailey, 2000; Barbari et al., 2007). The main disadvantages of GPS-based monitoring systems are the high energy consumption, resulting in poor battery life and frequent connection losses, mostly in the presence of obstacles or in poor weather conditions (Nadimi et al., 2012; Mason and Sneddon, 2013). For example, Agouridis et al. (2004) found that the GPS collars produced errors on the order of 2.5 times greater under tree cover than in an open field, and on the order of 1.5 times greater near fences than in an open field.
Nevertheless, GPS technology is useful in determining where an animal has grazed, but also monitoring other activities, such as walking, grazing and resting, could provide important information on animal behaviour and could represent a relevant factor in the ecosystem management and conservation (Gervasi et al., 2006).
Since GPS collars provide information on the speed of location changes over time and on distance travelled from animals, Schlecht et al. (2009) assumed that data from GPS recordings could be used as discrimination criteria for the daily activities of grazing animals. However, the same authors pointed out that while walking could be correctly classified for about the 80% of the time, for grazing and standing the previsions are more problematic.
Other researchers conversely, believe that position data alone are not able to correctly discriminate grazing and resting activities and conclude that the integration of GPS systems with motion sensors could provide more accurate data for the determinations of animal activities and the use of environment resources (Ungar et al. 2005; Ganskopp and Johnson, 2007; Ungar et al., 2010).
Gonzales et al. (2015), for example, were able to classify behavioural activities of cows grazing in a paddock by collecting electronic data at high frequency from collar-mounted accelerometers and GPS sensors.
Likewise, Brosh et al. (2006) were able to simultaneously measure the specific energy costs per unit of activity in grazing cows, as well as the daily energy cost of grazing activity, thanks to the combination of the GPS method with heart rate monitors.
1.2.2 Pedometers
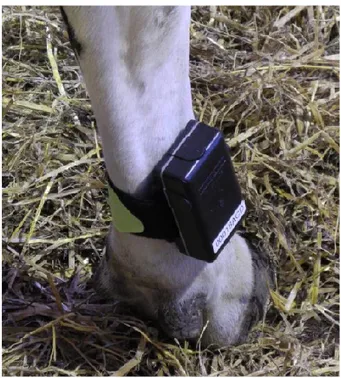
Another system for studying animal behaviour is featured by pedometers (Figure 2), which represent a precise and inexpensive method, mainly used in cattle farms, to monitor travel, health and oestrus of animals (Anderson and Kothmann, 1977; Brehme et al., 2008). Indeed animal performances and economic efficiency, especially in dairy
farms, are strongly influenced by good herd health, high reproductive results and also by energy spent travelling (Walker et al., 1985; Brehme et al., 2008).
Animal travel can be divided into at least three categories: foraging, walking and running, characterized by different step lengths, therefore the accuracy of the pedometer readings depends on the category to which the pedometer was adjusted or on the correction factor used to control the readings (Anderson and Kothmann, 1977).
Walker et al. (1985) concluded that pedometers can estimate travel distance with a good accuracy when correctly calibrated.
Figure 2. Pedometer fastened on a cow’s leg. Adapted from Kajava et al. (2014)
Regarding health and fertility problems, the late detection of animal diseases and oestrus has a negative impact on milk quantity and quality and on the productive life of the herd, causing substantial financial losses (Brehme et al., 2008).
Pedometers ─ thanks to the combination of two important physiological parameters, activity and resting time ─ allow the early and exact prediction of oestrus and health problems, like lameness or metabolic diseases, increasing the sanitary treatments efficacy, and preventing the disease from becoming chronic (Mosaferi et al., 2012; Alsaaod et al., 2015). It is indeed well known that during oestrus or illness, animals change their behaviour as an adaptive response to cope the stress, for example increasing or decreasing physical activity, reducing feeding and social behaviour, etc. (Nebel et al., 2000; Owen-Ashley et al., 2006).
Topan et al. (2013), assume that pedometers are useful tools to help farmers decision-making skills and profitability of farms, improving animal welfare through the continuous acquisition of data on their physiological state.
Pedometers are generally attached on the leg of the animals and data can be stored in a micro SD memory card, transmitted to a computer by an antenna, or sent to receiving units installed in the barn or milking support (Brehme et al., 2008; Topan et al., 2013; Alsaaod et al., 2015).
According to Walker et al. (1985), the main problem of this technique is the mechanical malfunctioning of the pedometers and the loss of instruments during the experiments; the same authors believe therefore that the use of two pedometers per animal might be useful to avoid losing data due to lost or broken pedometers.
1.2.3 Acoustic telemetry
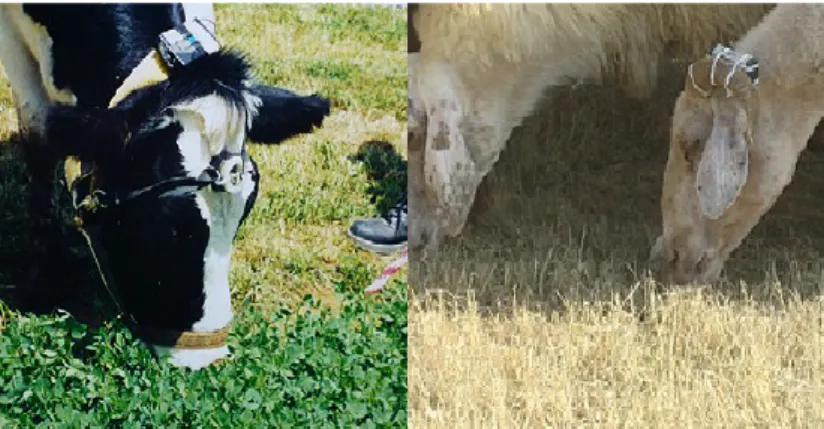
Another method with great potential is the acoustic telemetry, based on the recording, through a small microphone placed on the nape, on the horns or on the forehead of the
animal (Figure 3), of the acoustic signals produced by the movement of the mouth (Laca and Wallis De Vries, 2000; Clapham et al., 2011; Galli et al., 2011; Navon et al., 2013).
Figure 3. Microphone attached to the forehead of a cow and to the horn of a sheep. Adapted
from Navon et al. (2013)
During grazing process, animals continuously move the jaw to select, grab, chew and swallow the forage; however, it is possible to identify two different functions: biting, when the grass is caught and cut, and chewing, when the grass is crumbled inside the mouth (Galli et al., 2011). An additional function can be identified, consisting in chewing and biting with the same jaw movement: chew-bite, that has very important implications for the correct explanation of intake rate and ingestive behaviour (Galli et al., 2011; Milone et al., 2012).
The results of several studies indicate that it is possible to accurately estimate intake by acoustic analysis, indeed biting and chewing sounds differ in spectral composition because the first ones are louder and shorter than the latter (Galli et al., 2011).
The acoustic method is deemed much more reliable to count bites than direct observation, both because it is able to distinguish more clearly the sounds of bites and chews (Navon et al., 2013), and because chew-bites are not visually distinguishable
from bites, inasmuch the grass already in the mouth is chewed at the same time as the fresh grass is cut off (Milone et al., 2012).
However, acoustic monitoring requires further developments and solutions to solve some technical and practical problems (Laca and Wallis De Vries, 2000). The acoustic recordings can indeed be contaminated by background noises, especially in free grazing conditions; some of these noises sound like a bite: drinking, licking a salt block and the direct rubbing of the grass against the microphone (Delagarde et al., 1999; Clapham et al., 2011). Furthermore, to make practical the use of this method, recorded sounds must be automatically decoded by signal-processing algorithms, but this represents a challenge because it implies the isolation of background noises unrelated to the ingestive sounds (Navon et al., 2013).
However, without the automatic processing of sound, the use of this method for periods longer than a few minutes would not be practical, as the decoding of the recorded sounds by an operator takes a long time (Milone et al., 2012).
In a recent study Navon et al. (2013) succeeded to interpret the sound recordings through the use of a sound analysis software that, thanks to interpretive algorithms, allowed to correctly estimate from 84% (sheep) to 96% (goats and cattle) of the jaw movements. Milone et al. (2012) managed to reduce wind impact and other environmental noises by protecting the microphone with a foam cover, and automatically segmenting and classifying the grazing livestock sounds using a Hidden Markov models-based recognition system.
Although the complete automation of sound recordings has yet to be adapted to allow daily measurements of ingestion in free pasture conditions, the acoustic system has
shown good basis for the study of animal behaviour and for a wider application, also through the integration with global positioning systems, to provide more information about ruminants feeding behaviour (Galli et al., 2006; Milone et al., 2012).
1.2.4 Accelerometers
The most promising recording systems to monitor animal feeding behaviour are based on acceleration sensors (Watanabe et al., 2008; Robert et al., 2009).
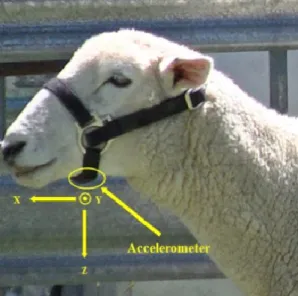
An accelerometer (Figure 4) is an electronic sensor able to transform the physical acceleration from motion or gravity into waveform voltage signal output, and can measure both the static acceleration due to gravity and the dynamic acceleration due to animal movements (Brown et al., 2013).
Figure 4. Tri-axial accelerometer attached to an halter; the arrows indicate the direction of the
x, y and z axes on the recorder. Adapted from Alvarenga et al. (2016)
These tools usually incorporate wireless communication technologies like ZigBee, Bluetooth, Wibree and WiFi, that allow to download the data acquired from the
accelerometer from a good distance and are commonly used in sensor network based researches to transmit sensor data (Abbasi et al., 2014).
The first devices for the detection of animals grazing activity were based on pressure sensors that measured a jaw movement as a change of electrical resistance (Penning et al., 1984; Rutter et al., 1997; Rutter, 2000).
The IGER Behaviour Recorder (Rutter et al., 1997) for example, have been validated in grazing sheep for the digital recording of three behavioural activities: eating, ruminating and other. A high overall index of concordance (91.0%) was found between the IBR data and the observer manual recordings (Rutter et al., 1997; Ungar and Rutter, 2006), but the software program for data analysis (Rutter, 2000) may sometimes misinterpret the activity (Konoff et al., 2002), maybe due to differences in pressure values generated by variations in the adherence of the halter to the animal (Andriamandroso et al., 2016). Moreover, in the first studies on the feeding behaviour of ruminants by automatic sensors, the activities of the animals were estimated on the basis of the visual analysis of the acceleration waveform (Rutter et al., 1997), so the accuracy of the estimates was largely dependent on the reader. To solve this problem, some researchers developed new statistical classification methods, able to automatically discriminate animal activities by setting threshold values on accelerometric signals (Moreau et al., 2009) or by using quadratic discriminant functions (Watanabe et al., 2008).
The advantages of using automatic sensors depend on their simplicity and robustness, the specificity and accuracy of activity detection, the degree of automation for data processing, financial costs and commercial availability (Delagarde and Lamberton, 2015).
Developments in accelerometer technology opened new perspectives for automatic monitoring of animal behaviour (De Passille et al., 2010), and thanks to following advances in microelectromechanical systems (MEMS) technologies it has been possible to reduce the size, weight and energy consumption of the accelerometric sensors, and to guarantee easier assembly on the animals without influencing their behaviour (Watanabe et al., 2008; Büchel and Sundrum, 2014).
Miniaturized accelerometric sensors have therefore started to represent promising tools for measuring free ranging ruminants behaviour and for classifying grazing, ruminating and resting activities (Scheibe and Gromann, 2006; Watanabe et al., 2008; Tani et al., 2013). A large number of studies on the use of accelerometers to monitor cattle behaviour can be found in the literature.
Scheibe and Gromann (2006) found the existence of some differences in acceleration waveform of the main activities (standing, grazing, walking, ruminating, drinking and hay uptake) of cows.
Wark et al. (2007) classified eating, ruminating and sleeping activities in a grazing cow by combining acceleration data with GPS data.
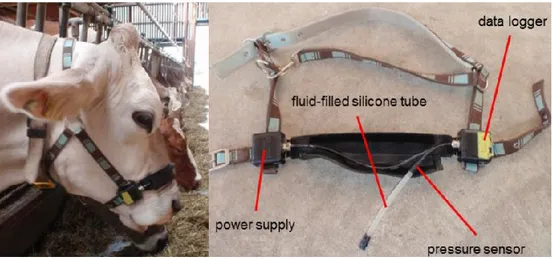
More recently the RumiWatch device (Zehner et al., 2012; Alsaaod et al., 2015), which represents an evolution of the IBR, has been developed; it is based on sensors that allow the automatic measurement of feeding, ruminating, drinking and locomotion activities in dairy cattle. The device consists of a muzzle (Figure 5), equipped with a pressure sensor to detect masticatory movements, and of a three-dimensional accelerometric pedometer that detects the movement or resting status of the animals. Data are stored on
an SD card and can be downloaded directly to a PC or sent wirelessly and processed in real time by the evaluation software (Zehner et al., 2012).
Figure 5. Description of RumiWatch noseband sensor. Adapted from Zehner et al. (2012)
Automatic behavioural classification recorders have been successfully used also in sheep studies, although to a lesser extent.
Alvarenga et al. (2016) used a tri-axial accelerometer to identify the main behaviours (grazing, lying, running, standing and walking) of sheep at pasture.
Kuźnicka and Gburzyński (2017) used an accelerometer attached to the lambs neck for the automatic detection of suckling episodes, monitoring lambs welfare during the rearing period and minimizing the need for farmer attention.
Radesky and Ilieski (2017) and Barwich et al. (2018) have recently used a tri-axial accelerometer to classify different gaits and postures in sheep, in order to discriminate lameness from normal walking and to monitor health status of animals.
While in recent years, the amount of studies related to the use of accelerometers in the classification of behavioural activities of grazing ruminants is increasing, only few
references can be found in literature on the use of these sensors to identify and classify masticatory movements of the mouth (Andriamandroso et al., 2016).
However, some authors managed to get a good estimate of the number of bites: Umemura et al. (2009) modified a pedometer in a pendulum under the lower jaw of cattle to monitor jaw movements, being able to count them with a precision of 90% compared to manual counts.
Tani et al. (2013) used a single-axis accelerometer coupled with a microphone, managing to classify with a good accuracy the chewing activities of stabled cows, when the sensor was attached to the cow horn.
Oudshoorn et al. (2013) used a 3-axis accelerometer to record grazing cow bites; a series of thresholds were tested to classify the chewing activities, in order to determine the peak with the best correlation with the observation, but the results indicated the difficulty of counting the bites using an accelerometer in this way.
Therefore, the use of accelerometers for monitoring jaw movements of grazing animals still requires significant hardware and software developments, in particular regarding the automation process and acquisition of data in real time. Moreover, there may be interference in the recordings due to the sensitivity of accelerometric sensors, which could generate unwanted signals during recording sessions due to sudden head movements, for example to drive insects away (Andriamandroso et al., 2016).
Accelerometers, in combination with other devices, have been used to measure also other important parameters such as energy expenditure (Halsey et al., 2011; Miwa et al., 2015) and the rate of dislocation of the animal (Bidder et al., 2014).
Energy costs represent an important parameter to be evaluated in free ranging animals, because daily activities of grazing animals may require more energy expenditures compared to those of confined animals (Brosh et al., 2006; Aharoni et al., 2009).
Such measurements require the registration of the activity for 24 hours period, because ruminants are active even at night (Brosh et al., 2006).
The energy expenditure of animals has been usually estimated by two main methods: the doubly labeled water method and the heart rate method (Butler et al., 2004). Although many researchers have tested these methods for estimating the energy costs of farm animals, they present some limitations: the doubly labeled water method has high financial costs and cannot make measurements for short periods of time, so it is not able to calculate the energy costs required for specific activities (Butler et al., 2004; Miwa et al., 2015). Also the heart rate method is quite expensive and the estimates can be easily influenced by stressful states of animals, which can cause an increase in energy expenditure; in addition heart rate recorders are difficult to use on free-ranging animals because the electrodes that compose them must be firmly attached to the animal or surgically implanted, to prevent them from falling or breaking (Butler et al., 2004; Miwa et al., 2015). However, surgical implantation in the field is complicated and can also cause infections, therefore alternative techniques are needed (Signer et al., 2010). Recently Miwa et al. (2015) have tested the potential of an accelerometric technique for estimating the energy expenditure of grazing ruminants, by evaluating the relationship between an acceleration index, the Overall Dynamic Body Acceleration (ODBA), and the heart rate. They concluded that ODBA is a good indicator of the estimated energy costs of grazing animals.
The combination of data obtained from accelerometer devices with those obtained from GPS may instead allow the analysis of temporal space behaviours, in order to allocate the different activities (locomotion, rest and grazing) on specific areas in which they occur, identifying this way grazed areas by those only treaded but not used by the animals, as deemed by researchers like Guo et al. (2009), Spink et al. (2013), Gonzales et al. (2015).
Various factors such as sensor position, sampling frequency and window sizes, can affect classification performances of accelerometers, but these characteristics are rarely described in literature. An accurate selection of above parameters can lead to significant improvements in signal transmission, storage capacity and energy saving (Walton et al., 2018). The sampling frequency of the accelerometer based devices generally range from 1 to 60 Hz (Müller and Schrader, 2003; Martiskainen et al., 2009; Brown et al., 2013; Nielsen, 2013), and its choice depends on the frequency of the activity to be classified, as well as the choice of window size (Walton et al., 2018).
Thanks to technological development, modern accelerometers are now able to record at high frequencies, that generate huge amounts of data, entailing a high cost in terms of energy consumption and making manual processing of recorded data and interpretation of signals based on changes in body movements impractical and difficult. For these reasons many researchers have tested the use of various machine learning approaches to automatically classify accelerometer data (Bidder et al., 2014).
Discriminant function analysis (DA) for example, is a multivariate statistical technique used to determine which continuous variables are able to discriminate between groups and to predict group membership. Once the DA has established which variables are the
best predictors, classification is possible thanks to the canonical functions, which allow to classify subjects in groups in which they had the highest classification scores (Poulsen and French, 2008).
Watanabe et al. (2008) demonstrated that quadratic discriminant analysis is effective for processing accelerometer data and statistically discriminating eating, ruminating and resting activities of cows, obtaining 90% correct discrimination rates when the discriminant functions used the x-axis variables (front-to-back axis).
Yoshitoshi et al. (2013) obtained a discrimination accuracy ranging between 90.6% to 94.6% using a linear discriminant analysis to classify cattle foraging activities based on acceleration data.
Giovanetti et al. (2017) were able to discriminate activities of sheep with a precision of 95% for grazing, 94% for resting and 89% for ruminating by analyzing accelerometer data with DA.
Another good classification method is the support vector machine (SVM), that constructs a hyperplane that best separates and maximizes the distance of observations from this separating hyperplane (Nathan et al., 2012).
Martiskainen et al. (2009) used a three-dimensional accelerometer to classify several behaviours of dairy cows, setting a sampling frequency of 10 Hz and a window size of 10 s for all behaviour classifications and processing accelerometer data using a multiclass SVM classifier, with accuracies ranging from 29% to 86%.
Classification and regression trees (CART) method can be used either for predicting continuous variables or choosing among categories. The cases are grouped through the subsequent division of data into increasingly homogeneous groups. The decision rules
of CART can be applied very quickly and are quite easy to interpret, but sometimes the method can cause over-fitting, which can be mitigated by reducing the number of decision rules incorporated in the tree (Nathan et al., 2012).
Robert et al. (2009) used an accelerometer set to record with epoch length of 3, 5, or 10 s, and generated a classification tree for each epoch to classify cattle activities into standing, walking, or lying. Lying and standing showed excellent agreement with video (99.2% and 98.0% respectively) while walking was significantly lower, with 67.8% agreement. Regarding epochs, classification accuracy was higher in 3 and 5 s compared to 10 s epoch.
Random forest classifiers (RFs) are constructed using a procedure similar to CART, but instead of using all the variables to determine the best division on each group, only a randomly selected subset of variables is used. However, given the stochastic nature of the algorithm, each of its invocations translates into different decision rules and slightly different results (Nathan et al., 2012).
Walton et al. (2018) found that walking, standing and lying activities in sheep can be accurately classified (89–95%) using a RFs. The highest performance of the classifier was obtained when using a sampling frequency of 32 Hz and a window size of 7 s, that allowed also the respect of energy performance.
Artificial neural networks (ANNs) are inspired by the processes of natural networks of biological neurons in the brain and consist in simple computational units called neurons, which are highly interconnected to each other. By adjusting the neurons interconnections weights according to a learning algorithm, neural networks can identify and learn correlated patterns between input data sets and corresponding target
values. After training, ANNs can be used to predict the outcome of new independent input data (He and Xu, 2010).
Nadimi et al. (2012) developed a wireless sensor network to classify sheep behaviours and used an artificial neural network to process data, being able to successfully discriminate 83.8% of grazing and 83.2% of lying.
K-nearest neighbour (KNN) algorithm classifies new data according to the classifications of the k nearest data points from a training set that can be derived from real data obtained with visual observation. The method aims to minimize the variability within clusters and maximize the variability between clusters and has the advantage to requires minimal data preparation (Bidder et al., 2014).
Bidder et al. (2014) used a KNN algorithm for identifying animal behavioural activities based on raw tri-axial acceleration data with a mean accuracy of 78%, establishing results comparable to those gained using more complex automated classification methods.
1.3 Practical implications of literature
In conclusion, the literature showed that monitoring the feeding behaviour of grazing ruminants is of fundamental importance to better manage pasture resources and to better meet animals nutritional requirements.
Feed intake at pasture is difficult to measure, especially through direct observation, for this reason, automated systems for monitoring the activities of free-ranging animals have became increasingly important and common.
Some sensors, such as tri-axial accelerometers, showed a good precision and accuracy in the classification of behavioural activities of herbivores, but they do not yet seem
able to discriminate jaw movements, which are of great importance for evaluating animal grazing strategies in different pastures and for estimating the daily herbage intake. Furthermore, although these devices are already used on farms, they still need significant developments, in particular regarding the easiness of installation and use, the real time data acquisition, the sampling frequency of the acceleration signal and the automation process of data classification.
In comparison to the large number of studies on the automatic classification of behaviour in cattle, very few studies have been done in sheep using sensor-based technologies (Walton et al., 2018).
For this reason, during a project (Beharum - Projects CRP-17287 PO Sardegna, FSE 2007–2013 LR 7/2007) financed by the Government of Sardinia, an automatic system (BEHARUM) for the study of the feeding behaviour of sheep was developed.
2. REFERENCES
Abbasi, A.Z., N. Islam, and Z.A. Shaikh. 2014. A review of wireless sensors and networks’ applications in agriculture. Comput. Stand. Inter. 36:263–270.
Agouridis, C.T., T.S. Stombaugh, S.R. Workman, B.K. Koostra, D.R. Edwards, and E.S. Vanzant. 2004. Suitability of a GPS collar for grazing studies. T. Am. Soc. Agric. Eng. 47:1321–1329.
Aharoni, Y., Z. Henkin, A. Ezra, A. Dolev, A. Shabtay, A. Orlov, Y. Yehuda, and A. Brosh. 2009. Grazing behavior and energy costs of activity: A comparison between two types of cattle. J. Anim. Sci. 87:2719–2731.
Alsaaod, M., J.J. Niederhauser, G. Beer, N. Zehner, G. Schuepbach-Regula, and A. Steiner. 2015. Development and validation of a novel pedometer algorithm to quantify extended characteristics of the locomotor behaviour of dairy cows. J. Dairy Sci. 98:6236–6242.
Alvarenga, F. A. P., I. Borges, L. Palkovič, J. Rodina, V. H. Oddy, and R. C. Dobos. 2016. Using a three-axis accelerometer to identify and classify sheep behaviour at pasture. Appl. Anim. Behav. Sci. 181:91–99.
Anderson, D.M., and M.M. Kothmann. 1977. Monitoring animal travel with digital pedometers. Rangeland Ecol. Manag. 30:316–317.
Andriamandroso, A.L.H., J. Bindelle, B. Mercatoris, and F. Lebeau. 2016. A review on the use of sensors to monitor cattle jaw movements and behaviour when grazing.
Biotechnol. Agron. Soc. Environ. 20.
Bailey, D. W., J. E. Gross, E. A. Laca, L. R. Rittenhouse, M. B. Coughenour, D. M. Swift, and P. L. Sims. 1996. Mechanisms that result in large herbivore grazing distribution patterns. J. Range Manage. 49:386–400.
Bailey, D.W. 2000. Evaluating new approaches to improve livestock grazing distribution using GPS and GIS technology. Pages 91–99 in Proc. 1st National Conference on Grazing Lands Congress held, Las Vegas, Nevada.
Bailey, D.W. 2004. Management strategies for optimal grazing distribution and use of arid rangelands 1 2. J. Anim. Sci. 82:E147–E153.
Bailey, D.W., and F.D. Provenza. 2008. Mechanisms determining large-herbivore distribution. Pages 7–28 in: Prins, H.T.T., van Langevelde, F. Eds., Resource Ecology, Spatial and Temporal Dynamics of Foraging. Springer, Dordrecht, Netherlands.
Barbari, M., L. Conti, and S. Simonini. 2007. Stato dell’arte e ambiti applicativi potenziali delle tecniche di monitoraggio animale: simulazioni in ambienti reali. In Proc. of L'e- nell'ingegneria agraria, forestale e dell'industria agro-alimentare, Firenze, Italy.
Barwick, J., D. Lamb, R. Dobos, D. Schneider, M. Welch, and M. Trotter. 2018. Predicting Lameness in Sheep Activity Using Tri-Axial Acceleration Signals. Animals 8:2.
Baumont, R., S. Prache, M. Meuret, and P. Morand-Fehr. 2000. How forage characteristics influence behaviour and intake in small ruminants: a review. Livest. Prod. Sci. 64:15–28.
Bidder, O.R., H.A. Campbell, A. Gómez-Laich, P. Urgé, J. Walker, Y. Cai, L. Gao, F. Quintana, and R.P. Wilson. 2014. Love thy neighbour: automatic animal behavioural classification of acceleration data using the k-nearest neighbour algorithm. PLoS one 9:e88609.
Blomberg, K. 2011. Automatic registration of dairy cows grazing behaviour on pasture. PhD Thesis. Swedish University of Agricultural Sciences, Uppsala, Sweden.
Bourbouze, A. 1980. Goats grazing on woody rangeland. Fourrages 82:121–144.
Braghieri, A., E. Sabia, C. Pacelli, N. Piazzolla, A. Girolami, and F. Napolitano. Comportamento alimentare di vitelloni podoloci al pascolo.
Brehme, U., U. Stollberg, R. Holz, and T. Schleusener. 2008. ALT pedometer–New sensor–aided measurement system for improvement in oestrus detection. Comput. Electron. Agric. 62:73–80.
Brosh, A., Z. Henkin, E.D. Ungar, A. Dolev, A. Orlov, Y. Yehuda, and Y. Aharoni. 2006. Energy cost of cows’ grazing activity: Use of the heart rate method and the Global Positioning System for direct field estimation1. J. Anim. Sci. 84:1951–1967.
unwatchable through acceleration logging of animal behavior. Anim. Biotelem. 1:20.
Büchel, S., and A. Sundrum. 2014. Evaluation of a new system for measuring feeding behavior of dairy cows. Comput. Electron. Agric. 108:12–16.
Butler, P.J., J.A. Green, I.L. Boyd, and J.R. Speakman. 2004. Measuring metabolic rate in the field: the pros and cons of the doubly labelled water and heart rate methods. Func. Ecol. 18:168–183.
Clapham, W.M., J.M. Fedders, K. Beeman, and J.P. Neel. 2011. Acoustic monitoring system to quantify ingestive behavior of free-grazing cattle. Comput. Electron. Agric. 76:96–104.
De Koning, K., and J. Rodenburg. 2004. Automatic milking: State of the art in Europe and North America. Pages 27–40 in Proc. of Automatic milking, a better understanding. Wageningen, The Netherlands.
De Passille, A. M., M. B. Jensen, N. Chapinal, and J. Rushen. 2010. Use of accelerometers to describe gait patterns in dairy calves. J. Dairy Sci. 93:3287– 3293.
Delagarde, R., J. P. Caudal, and J. L. Peyraud. 1999. Development of an automatic bitemeter for grazing cattle. In Ann. de Zootech. 48:329–339.
Delagarde, R., and P. Lamberton. 2015. Daily grazing time of dairy cows is recorded accurately using the Lifecorder Plus device. Appl. Anim. Behav. Sci. 165:25–
32.
D'odorico, P., G. S. Okin, and B. T. Bestelmeyer. 2012. A synthetic review of feedbacks and drivers of shrub encroachment in arid grasslands. Ecohydrology 5:520–530.
Dumont, B., and A. Boissy. 2000. Grazing behaviour of sheep in a situation of conflict between feeding and social motivations. Behav. Process. 49:131–138.
Edwards, J. L., and P. R. Tozer. 2004. Using activity and milk yield as predictors of fresh cow disorders. J. Dairy Sci. 87:524–531.
Forbes, T.D.A. 1988. Researching the Plant-Animal Interface: The investigation of Ingestive Behaviour in Grazing Animals 1, 2. J. Anim. Sci. 66:2369–2379.
Galli, J.R., C.A. Cangiano, M.W. Demment, and E.A. Laca. 2006. Acoustic monitoring of chewing and intake of fresh and dry forages in steers. Anim. Feed Sci. Technol. 128:14–30.
Galli, J.R., C.A. Cangiano, D.H. Milone, and E.A. Laca. 2011. Acoustic monitoring of short-term ingestive behaviour and intake in grazing sheep. Livest. Sci. 140:32– 41.
Ganskopp, D.C., and D.D. Johnson. 2007. GPS error in studies addressing animal movements and activities. Rangeland Ecol. Manag. 60:350–358.
Gervasi, V., S. Brunberg, and J.E. Swenson. 2006. An individual-based method to measure animal activity levels: a test on brown bears. Wildl. Soc. Bull. 34:1314–1319.
Giovanetti, V., M. Decandia, G. Molle, M. Acciaro, M. Mameli, A. Cabiddu, R. Cossu, M.G. Serra, C. Manca, and S.P.G. Rassu. 2017. Automatic classification system for grazing, ruminating and resting behaviour of dairy sheep using a tri-axial accelerometer. Livest. Sci. 196:42–48.
Giroux, M.-A., C. Dussault, N. Lecomte, J.-P. Tremblay, and S.D. Côté. 2012. A new way of assessing foraging behaviour at the individual level using faeces marking and satellite telemetry. PLoS one 7:e49719.
González, L.A., G.J. Bishop-Hurley, R.N. Handcock, and C. Crossman. 2015. Behavioral classification of data from collars containing motion sensors in grazing cattle. Comput. Electron. Agric. 110:91–102.
Gordon, I.J. 1995. Animal-based techniques for grazing ecology research. Small Rumin. Res. 16:203–214.
Guo, Y., G. Poulton, P. Corke, G.J. Bishop-Hurley, T. Wark, and D.L. Swain. 2009. Using accelerometer, high sample rate GPS and magnetometer data to develop a cattle movement and behaviour model. Ecol. Modell. 220:2068–2075.
Halsey, L.G., E.L. Shepard, and R.P. Wilson. 2011. Assessing the development and application of the accelerometry technique for estimating energy expenditure. Comp. Biochem. Physiol. A Mol. Integr. Physiol. 158:305–314.
Handcock, R.N., D.L. Swain, G.J. Bishop-Hurley, K.P. Patison, T. Wark, P. Valencia, P. Corke, and C.J. O’Neill. 2009. Monitoring animal behaviour and environmental interactions using wireless sensor networks, GPS collars and
satellite remote sensing. Sensors 9:3586–3603.
Harris, N. R., D. E. Johnson, M. R. George, and N. K. McDougald. 2002. The effect of topography, vegetation, and weather on cattle distribution at the San Joaquin Experimental Range, California. Pages 53–63 in USDA Forest Service General Technical Reports PSW GTR–184.
He, X., and S. Xu. 2010. Artificial neural networks. Process Neural Networks: Theory and Applications 20-42.
Hodgson, J. 1985. The control of herbage intake in the grazing ruminant. Proc. of the Nutrition Society 44:339–346.
Hulbert, I.A., J.T. Wyllie, A. Waterhouse, J. French, and D. McNulty. 1998. A note on the circadian rhythm and feeding behaviour of sheep fitted with a lightweight GPS collar. Appl. Anim. Behav. Sci. 60:359–364.
Iason, G.R., A.R. Mantecon, D.A. Sim, J. Gonzalez, E. Foreman, F.F. Bermudez, and D.A. Elston. 1999. Can grazing sheep compensate for a daily foraging time constraint?. J. Anim. Ecol. 68:87–93.
Ito, K., M. A. G. Von Keyserlingk, S. J. LeBlanc, and D. M. Weary. 2010. Lying behaviour as an indicator of lameness in dairy cows. J. Dairy Sci. 93:3553– 3560.
Jáuregui, B. M., U. García, K. Osoro, and R. Celaya. 2009. Sheep and goat grazing effects on three Atlantic heathland types. Rangeland Ecol. Manag. 62:119–126.
Kajava, S., M. Mughal, L. Frondelius, S. Ruuska, N. Zehner, and J. Mononen. 2014. Validation of rumiwatch pedometers measuring lying, standing and walking of cattle. Page Ref:C0683 in Proc. of International Conference of Agricultural Engineering, Zürich, Switzerland.
Kononoff, P. J., H. A. Lehman, and A. J. Heinrichs. 2002. A comparison of methods used to measure eating and ruminating activity in confined dairy cattle. J. Dairy Sci. 85:1801–1803.
Kuźnicka, E., and P. Gburzyński. 2017. Automatic detection of suckling events in lamb through accelerometer data classification. Comput. Electron. Agric. 138:137– 147.
Laca, E.A., and M.F. WallisDeVries. 2000. Acoustic measurement of intake and grazing behaviour of cattle. Grass Forage Sci. 55:97–104.
Langbein, J., K.M. Scheibe, K. Eichhorn, U. Lindner, and W.J. Streich. 1996. An activity-data-logger for monitoring free-ranging animals. Appl. Anim. Behav. Sci. 48:115–124.
Martiskainen, P., M. Järvinen, J.-P. Skön, J. Tiirikainen, M. Kolehmainen, and J. Mononen. 2009. Cow behaviour pattern recognition using a three-dimensional accelerometer and support vector machines. Appl. Anim. Behav. Sci. 119:32– 38.
Mason, A., and J. Sneddon. 2013. Automated monitoring of foraging behaviour in free ranging sheep grazing a biodiverse pasture. In Proc. 7th International
Conference on Sensing Technology, Wellington, New Zealand.
Mattachini, G., E. Riva, C. Bisaglia, J. C. A. M. Pompe, and G. Provolo. 2013. Methodology for quantifying the behavioural activity of dairy cows in freestall barns. J. Anim. Sci. 91:4899–907.
Milone, D.H., J.R. Galli, C.A. Cangiano, H.L. Rufiner, and E.A. Laca. 2012. Automatic recognition of ingestive sounds of cattle based on hidden Markov models. Comput. Electron. Agric. 87:51–55.
Miwa, M., K. Oishi, Y. Nakagawa, H. Maeno, H. Anzai, H. Kumagai, K. Okano, H. Tobioka, and H. Hirooka. 2015. Application of overall dynamic body acceleration as a proxy for estimating the energy expenditure of grazing farm animals: relationship with heart rate. PLoS one 10:e0128042.
Moreau, M., S. Siebert, A. Buerkert, and E. Schlecht. 2009. Use of a tri-axial accelerometer for automated recording and classification of goats’ grazing behaviour. Appl. Anim. Behav. Sci. 119:158–170.
Mosaferi, S., Z.A. Moghadam, Z. Ostadi, and V. Khodabandeloo. 2012. Evaluating accuracy rate of oestrus detection in dairy cow by pedometer. Res. J. Biol. Sci. 7:170–174.
Müller, R., and L. Schrader. 2003. A new method to measure behavioural activity levels in dairy cows. Appl. Anim. Behav. Sci. 83:247–258.
and classifying animal behaviour using ZigBee-based mobile ad hoc wireless sensor networks and artificial neural networks. Comput. Electron. Agric. 82:44– 54.
Nathan, R., O. Spiegel, S. Fortmann-Roe, R. Harel, M. Wikelski, and W. M. Getz. 2012. Using tri-axial acceleration data to identify behavioral modes of free-ranging animals: general concepts and tools illustrated for griffon vultures. J. Exp. Biol. 215:986–996.
Navon, S., A. Mizrach, A. Hetzroni, and E.D. Ungar. 2013. Automatic recognition of jaw movements in free-ranging cattle, goats and sheep, using acoustic monitoring. Biosyst. Eng. 114:474–483.
Nebel, R.L., M.G. Dransfield, S.M. Jobst, and J.H. Bame. 2000. Automated electronic systems for the detection of oestrus and timing of AI in cattle. Anim. Reprod. Sci. 60:713–723.
Nielsen, P.P. 2013. Automatic registration of grazing behaviour in dairy cows using 3D activity loggers. Appl. Anim. Behav. Sci. 148:179–184.
O’Driscoll, K., L. Boyle, and A. Hanlon. 2008. A brief note on the validation of a system for recording lying behaviour in dairy cows. Appl. Anim. Behav. Sci. 111:195–200.
Oudshoorn, F.W., C. Cornou, A.L.F. Hellwing, H.H. Hansen, L. Munksgaard, P. Lund, and T. Kristensen. 2013. Estimation of grass intake on pasture for dairy cows using tightly and loosely mounted di-and tri-axial accelerometers combined with
bite count. Comput. Electron. Agric. 99:227–235.
Owen-Ashley, N.T., M. Turner, T.P. Hahn, and J.C. Wingfield. 2006. Hormonal, behavioral, and thermoregulatory responses to bacterial lipopolysaccharide in captive and free-living white-crowned sparrows (Zonotrichia leucophrys gambelii). Horm. Behav. 49:15–29.
Penning, P.D., G.L. Steel, and R.H. Johnson. 1984. Further development and use of an automatic recording system in sheep grazing studies. Grass Forage Sci. 39:345– 351.
Poulsen, J., and A. French. 2008. Discriminant function analysis. San Francisco State University: San Francisco, CA. http://userwww. sfsu. edu/~ efc/classes/biol710/discrim/discrim. pdf.
Provenza, F.D. 1995. Postingestive feedback as an elementary determinant of food preference and intake in ruminants. Rangeland Ecology and Management Journal of Range Management Archives 48:2–17.
Pulina, G., A. Nudda, N.P.P. Macciotta, G. Battacone, S. Fancellu and C. Patta. 2005. Non-nutritional strategies to improve lactation persistency in dairy ewes. Pages 36–66 in Proc. 11th Symposium on Great Lakes Dairy Sheep, Burlington, NewYork, USA.
Radeski, M., and V. Ilieski. 2017. Gait and posture discrimination in sheep using a tri-axial accelerometer. Animals 11:1249–1257.
Robert, B., B.J. White, D.G. Renter, and R.L. Larson. 2009. Evaluation of three-dimensional accelerometers to monitor and classify behaviour patterns in cattle. Comput. Electron. Agric. 67:80–84.
Rodgers, A. R. 2001. Tracking animals with GPS: the first 10 years. Pages 1–10 in Proc. of the Conference on Tracking animals with GPS, Aberdeen, Scotland.
Rutten, C.J., A.G.J. Velthuis, W. Steeneveld, and H. Hogeveen. 2013. Invited review: Sensors to support health management on dairy farms. J. Dairy Sci. 96:1928– 1952.
Rutter, S.M., R.A. Champion, and P.D. Penning. 1997. An automatic system to record foraging behaviour in free-ranging ruminants. Appl. Anim. Behav. Sci. 54:185– 195.
Rutter, S. M. 2000. Graze: a program to analyze recordings of the jaw movements of ruminants. Behav. Res. Methods Instrum. Comput. 32:86–92.
Scheibe, K.M., T. Schleusner, A. Berger, K. Eichhorn, J. Langbein, L. Dal Zotto, and W.J. Streich. 1998. ETHOSYS (R)—new system for recording and analysis of behaviour of free-ranging domestic animals and wildlife. Appl. Anim. Behav. Sci. 55:195–211.
Scheibe, K.M., and C. Gromann. 2006. Application testing of a new three-dimensional acceleration measuring system with wireless data transfer (WAS) for behaviour analysis. Behav. Res. Methods 38:427–433.
Schlecht, E., U. Dickhoefer, E. Gumpertsberger, and A. Buerkert. 2009. Grazing itineraries and forage selection of goats in the Al Jabal al Akhdar mountain range of northern Oman. J. Arid Environ. 73:355–363.
Signer, C., T. Ruf, F. Schober, G. Fluch, T. Paumann, and W. Arnold. 2010. A versatile telemetry system for continuous measurement of heart rate, body temperature and locomotor activity in free-ranging ruminants. Methods Ecol. Evol. 1:75–85.
Spink, A., B.Cresswell, A. Kölzsch, F.van Langevelde, M.Neefjes, N. P. J. J. Noldus, H. van Oeveren, H.Prins, T.van der Wal, N. de Weerd, and W. Frederik de Boer. 2013. Animal behaviour analysis with GPS and 3D accelerometers. European Conference on Precision Livestock Farming, Leuven, Belgium.
Swain, D.L., and M.A. Friend. 2013. Opportunities for telemetry techniques in studies on the nutritional ecology of free-ranging domesticated ruminants. Animal 7:123–131.
Tani, Y., Y. Yokota, M. Yayota, and S. Ohtani. 2013. Automatic recognition and classification of cattle chewing activity by an acoustic monitoring method with a single-axis acceleration sensor. Comput. Electron. Agric. 92:54–65.
Topan, C., S. Irimescu, L. Naghiu, and A. David. 2013. Study regarding the use of pedometers in dairy farms. Agricultura–Ştiinţă şi practică 1–2:85–86.
Trénel, P., M. B. Jensen, E. L. Decker, and F. Skjøth. 2009. Quantifying and characterizing behaviour in dairy calves using the IceTag automatic recording device. J. Dairy Sci. 92:3397–3401.
Turner, L.W., M.C. Udal, B.T. Larson, and S.A. Shearer. 2000. Monitoring cattle behaviour and pasture use with GPS and GIS. Can. J. Anim. Sci. 80:405–413.
Umemura, K., T. Wanaka, and T. Ueno. 2009. Estimation of feed intake while grazing using a wireless system requiring no halter. J. Dairy Sci. 92:996–1000.
Undi, M., C. Wilson, K.H. Ominski, and K.M. Wittenberg. 2008. Comparison of techniques for estimation of forage dry matter intake by grazing beef cattle. Can. J. Anim. Sci. 88:693–701.
Ungar, E.D., Z. Henkin, M. Gutman, A. Dolev, A. Genizi, and D. Ganskopp. 2005. Inference of animal activity from GPS collar data on free-ranging cattle. Rangeland Ecol. Manag. 58:256–266.
Ungar, E. D., and S. M. Rutter. 2006. Classifying cattle jaw movements: comparing IGER behaviour recorder and acoustic techniques. Appl. Anim. Behav. Sci. 98:11–27.
Ungar, E.D., I. Schoenbaum, Z. Henkin, A. Dolev, Y. Yehuda, and A. Brosh. 2010. Inference of the activity timeline of cattle foraging on a Mediterranean woodland using GPS and pedometry. Sensors 11:362–383.
Walker, J.W., R.K. Heitschmidt, and S.L. Dowhower. 1985. Evaluation of pedometers for measuring distance traveled by cattle on two grazing systems. J. Range Manag. 90–93.
Keith, A. Winterlich, and and J. Kaler. 2018. Evaluation of sampling frequency, window size and sensor position for classification of sheep behaviour. Royal Soc. Open Sci. 5:171442.
Wark, T., P. Corke, P. Sikka, L. Klingbeil, Y. Guo, C. Crossman, P. Valencia, D. Swain, and G. Bishop-Hurley. 2007. Transforming agriculture through pervasive wireless sensor networks. Pervasive Comput. 6:50–57.
Watanabe, N., S. Sakanoue, K. Kawamura, and T. Kozakai. 2008. Development of an automatic classification system for eating, ruminating and resting behaviour of cattle using an accelerometer. Jpn. Grassl. Sci. 54:231–237.
Yoshitoshi, R., N. Watanabe, K. Kawamura, S. Sakanoue, R. Mizoguchi, H.-J. Lee, and Y. Kurokawa. 2013. Distinguishing cattle foraging activities using an accelerometry-based activity monitor. Rangeland Ecol. Manag. 66:382–386.
Zehner, N., J. Niederhauser, F. Nydegger, A. Grothmann, M. Keller, M. Hoch, A. Haeussermann, and M. Schick. 2012. Validation of a new health monitoring system (RumiWatch) for combined automatic measurement of rumination, feed intake, water intake and locomotion in dairy cows. Pages C-0438 in Proc. of International Conference of Agricultural Engineering-CIGR-Ageng, Valencia, Spain.
OBJECTIVES
The aim of the present thesis was to study grazing behaviour of sheep and to automatically identify and classify their activities through a tri-axial accelerometer based device.
The main objectives of the study were:
a) to develop a tri-axial accelerometer based sensor for recording and statistically discriminating sheep feeding behaviour into three different classes (grazing, ruminating and resting);
b) to estimate the rate of biting (number of bites per min of grazing) on the basis of acceleration variables;
c) to develop a data management software and a remote transfer system of electronically recorded information to a remote control location using wireless networks;
d) to test different epoch settings in order to optimize device performances and to evaluate their effect on the statistical model applied to the classification of behavioural activities.
Automatic classification system for grazing, ruminating and resting behaviour of dairy sheep using a tri-axial accelerometer
V. Giovanetti, M. Decandia, G. Molle, M. Acciaro, M. Mameli, A. Cabiddu, R. Cossu, M.G. Serra, C. Manca, S.P.G. Rassu, C. Dimauro
Published in Livestock Science, 196, 42-48, (2017)
ABSTRACT
A device based on a tri-axial accelerometer was used to measure behavioural parameters of dairy sheep at pasture. Short tests were performed in grazing conditions to collect accelerometer data simultaneously with video recordings of sheep behavioural activities (grazing, ruminating and resting). The raw acceleration data was processed to create 12 variables: mean, variance and inverse coefficient of variation (ICV; mean/standard deviation) for the X-, Y- and Z-axis and the resultant at 1-min intervals. A database inclusive of the 12 acceleration variables and the three behavioural activities detected for each minute was then created. Three multivariate statistical techniques were used to discriminate the behavioural activities using the acceleration data: stepwise discriminant analysis (SDA), canonical discriminant analysis (CDA), and discriminant analysis (DA). Based on the acceleration variables selected by SDA, the subsequent CDA significantly discriminated the three behaviours by extracting two canonical functions. The first canonical function (CAN1) discriminated the grazing activity from the resting and ruminating, whereas the second (CAN2) differentiated the grazing from the ruminating behaviour. After bootstrap resampling, the DA correctly assigned 93.0% of minutes to behavioural activities. Stepwise regression analysis was used to estimate the