APPRAISING THE EFFICACY OF THE
NATIONAL ECONOMIC EMPOWERMENT AND
DEVELOPMENT STRATEGY (NEEDS) AS
POLICY INTERVENTION IN NIGERIA (2003-2007)
Sunday Abayomi Adebisi
University of University of Lagos, Nigeria
Abiodun Adebowale Oyedele
University of University of Lagos, Nigeria
Christo Gbenga Adelakun
University of University of Lagos, Nigeria
Received: July 23, 2019 Accepted: October 21, 2019 Online Published: November 16, 2019
Abstract
This study appraised the efficacy of the National Economic Empowerment and Development Strategies (NEEDS) as policy intervention in Nigeria. The study adopted mixed methods. Using convenience sampling method, 240 citizens were randomly selected public and private institution in Ogun State. Comparatively, mean analysis was adopted in analyzing the percentage mean of the secondary data collected while self-designed questionnaires were used to elicit responses as primary data for the study. The instrument used for data collection was a self-designed questionnaire with a test-retest correlation coefficient of 0.86 for the reliability test. The study generated four research questions and four hypotheses were tested at 0.05 level of significance. The result of the hypotheses indicated that: (i) NEEDS policy was not effective objectively on the targeted growth and development indicators (GDI). (ii) The study also revealed that there were no significant differences after the intervention of NEEDS. (iii) Based on the findings of the study, it was inferred that NEEDS produces no significant differences on GDI. It was therefore recommended that thorough appraisal of the previous and existing policies should be undertaken before the formulation of new one in order to ascertain the reason for its ineffectiveness, failure, need for replacement and sustainability methods for subsequent policy after implementation.
1. Introduction
In Nigeria, the term public policy (PP) is not alien. Every successive government either military or civilian at one time or the other formulates and implements various policies during their administration. Because it is perceived as an instrument for responding to the public issues or problems. One of the unique features of PP is that it is an action-oriented governmental instrument targeted at addressing general problems of the people. This conforms to Egonmwan (1991) who noted PP as government programmes of action. Therefore, PP could also be used interchangeably with public programmes. Statistics revealed quite a number of government programmes have been introduced of which NEEDS was inclusive. Examples of such programmes are National Programme on Immunization (NPI), Structural Adjustment Programmes (SAP), National Poverty Eradication Programme (NAPEP), and National Transformation Agenda which was introduced after NEEDS. Nigeria as a nation has never been in short supply of public policy or reforms either during military or civilian government but the lingering problem has always be inefficiency and poor management of the implementation (Ugoani, 2017).
In terms of both human and natural resources, the rich endowment of Nigeria as a nation is not debatable. But the reason why over 70% of her citizenry live below poverty level of less than $1 a day had resulted in avalanche of government intervention policies. Before 1999, the level of decay in all sectors of the economy was underestimated by the successive administrations and this led to loss of economic fortunes for decades. The economic decadence engendered loss of value, abject poverty, poor economy and astronomical increase in unemployment rate. After four years of critical evaluation and diligent study of the economic situation of Nigeria, the Olusegun Obasanjo led administration (2003-2007) designed and introduced an home grown intervention policy called National Economic Empowerment and Development Strategy (NEEDS) to improve the economy which was centered on four cardinal objectives of poverty reduction, generation of employment, creation of wealth and value-orientation.
NEEDS as a policy was fashioned not only as a plan but a strategic systematic process of reforming the economy from decades of economic decadence. The policy was welcomed with a widespread commitment from all the stakeholders because of its unique feature of being the first national developmental plan that integrates the efforts of the three-tiers of government. It focused on the big picture of addressing the specific challenges in all sectors of the nation as noted by Okonjo-Iweala (2014) who lamented that all sectors of the economy are ripped for urgent reformation.
Before the advent of NEEDS, there have been several reformation measures launched and implemented by the government which indicated that Nigeria has never at any time either under the military or civilian run short of policies. There was Operation Feed the Nation during the military rule of Olusegun Obasanjo and followed by Green Revolution of Civilian Shehu Shagari in the 70s, while Structural Adjustment Programme (SAP) was set up by Ibrahim Babangida military administration (Akpobasah, 2004) and General Sanni Abacha famous Vision 2010 which died as soon as its progenitor died. But none of these was able to rescue Nigeria out of the economic perdition she was subjected into and consequently, the quality of lives of Nigerians continues to wane unabated. NEEDS was posed differently from previous policies because it relied on its holistic approach to social and economic challenges facing Nigeria growth and development. NEEDS policy was saddled with the goal of rediscovering a new Nigeria free from economic woes such as poverty, unemployment, corruption, poor economy and so on and so forth.
As highlighted by various publications on the concept of NEEDS, the challenges that limited the impact of the policy involves resistance to change, lack of continuity culture, inability to translate the policy benefits of reforms to citizens, dwindling standard of living, non improvement of the domestic investment climate, integration and extension of the reform program to the state and local government levels, macroeconomic volatility and illiteracy.
The impact that NEEDS intervention made on the nation in relation to its designed objectives are two sides of a coin. That is, NEEDS policy came with both merits and demerits. This correlates with Okonjo-Iweala and Osafo-Kwaako (2007) assertion that NEEDS significantly impacted the Nigeria economy positively but not without the demerits and they noted that the demerits were more than the merits. Okonjo-Iweala and Osafo-Kwaako (2007) admitted both the good and bad side of NEEDS after its implementation but concluded that the usefulness of NEEDS rests on the way it is being viewed, and advised that NEEDS should not be viewed as the panacea but as initial steps toward future recovery and growth.
Before NEEDS, there were reforms such as commercialization, privatization, the Petroleum Trust Fund (PTF), the Directorate of Food, Road and Rural Infrastructure (DFRRI), and all these were meant to achieve the very objectives that engendered the introduction of NEEDS in 2004, because the reforms have ended with the tenure of the progenitor but the economic challenges they were meant to address subsist.
The focus of this study is to appraise the efficacy of NEEDS policy as intervention in addressing the national challenges from its inception to extinction (2004-2007). And also to examine how effective NEEDS was able to deliver on its cardinal objectives of reforming all the sectors of the economy.
1.1. Purpose of the Study
The main purpose of the study is to examine the efficacy of NEEDS as policy intervention in Nigeria. Specifically the study intends to:
i. Examine the significant difference in poverty reduction rate before and after the intervention of NEEDS as policy in Nigeria.
ii. Unveil the significant difference in employment creation before and after the intervention of NEEDS.
iii. Determine the significant difference in the level of wealth creation before and after the intervention of NEEDS.
iv. Ascertain the significant difference in value re-orientation in Nigeria before and after the intervention of NEEDS.
1.2. Significance of the Study
Findings of this study will be useful to policy administrators in public sectors and managers in private organizations, because it will serves as a guide before making a policy and also as an evaluation tool after making the policy.
1.3. Research Questions
In order to guide this study, four research questions were raised. These are:
Research Question 1: What is the significant difference in poverty reduction before and after the intervention of NEEDS?
Research Question 2: What is the significant difference in employment creation before and after the intervention of NEEDS?
Research Question 3: Is there any significant difference in wealth creation before and after intervention of NEEDS?
Research Question 4: What is the significant difference in value re-orientation before and after the intervention of NEEDS?
1.4. Hypotheses Formulation
The following research hypotheses were formulated to guide the study.
Ho1: There is no significant difference in poverty reduction before and after the intervention of NEEDS.
Ho2: There is no significant difference in employment creation before and after the intervention of NEEDS
Ho3: There is no significant difference in wealth creation before and after the intervention of NEEDS
Ho4: There is no significant difference in value-re-orientation before and after the intervention of NEEDS.
2. Literature Review
2.1. What is NEEDS?
Since the programme was set up in 2003 by the Olusegun Obasanjo led administration, several scholarly publications have greeted the concept of NEEDS.
Okonkwo (2014) defines NEEDS as a “panacea policy of the Obasanjo’s led civil administration to positively change the economic fortune of Nigeria. While IMF and IDA (2015) define NEEDS as the response to the developmental challenges confronting the nation Nigeria. IMF and IDA (2015) described NEEDS as national plan for prosperity. NEEDS was also denoted as people-oriented plan and solutions to most economic questions. It was a programme through wide consultation designed by the people and for the people. NEEDS is all about the Nigeria people which is centered on peoples’ welfare, education, political power, health, physical security and empowerment which are of paramount factor in attaining the futuristic vision.
Otoghagua (2007) in the same vein described NEEDS as a global policy that was integrated into International Development Targets (IDT) which was set up in 1996. The intent of NEEDS according to Otoghagua (2007) was to address issues that bother on how to improve social welfare, human capital development, and sustainability of a nation’s economic environment. Bamiduro and Babatunde (2006) describe NEEDS as a dissimilar economic plan with distinct objectives to making Nigeria achieve poverty reduction and be financially viable. The duo asserted the explicit focus of NEEDS on the projected real GDP growth of 5 per cent in 2004, 6 per cent in 2005 and 2006, and 7 per cent in 2007. These were expected to be achieved with a stable 5 per cent yearly decrease in the rate of poverty for over five years period of 2003-2007 with the aim of providing at least two million jobs yearly from 2005 to 2007.
Objectively, NEEDS as an intervention programme set up on rescuing mission was introduced to serves as a bridge to the existing gap in all other developmental framework based on its feasibility (Soludo, 2004).
2.2. Nigeria economic situation before the advent of NEEDS
All national economic plans, policies, programmes and visions are enshrined to ensuring stable development and growth by altering the models that failed in engendering expected change due to their weakness and challenges (Effoduh, 2015). The major factor necessitating the introduction of a new policy in any nation is to replace a failed or dead policy. If the old is functional, then there will be no need to introduce the new.
According to Okonjo-Iweala (2013) who described the economic situation of Nigeria as faltering as at 2003 when the former President Obasanjo won a second term ticket as President, the situation forced the administration to focus on total reformation of every sector of the economy, hence, the introduction of NEEDS. She asserted that all the spheres of the economy need reformation, ranging from stabilizing the volatile macroeconomic environment, checkmating the endemic corruption to removal of various structural features militating against the development of private enterprises.
Okonkwo (2014) also painted a gory picture of two decades of mal-administration of Nigerian economy filled with poor economic performance due to fluctuating prices of oil coupled with military dictatorship and mismanagement of economic resources, the economy was flooded with myriad of challenges such as scarcity of essential products, decay of infrastructural, monumental national debts, high unemployment rate and poor industrial production before the Olusegun Obasanjo’s civilian government introduced NEEDS as cited by Okonkwo (2014).
The official study undertaken by the International Development Association (IDA) and the International Monetary Fund (IMF) identified poor growth and high level of poverty as the prevailing dual factors that Nigerian economy was confronted with (IDA and IMF, 2005). The joint research x-rayed the economic situation of Nigeria and the major daunting challenges hindering the nation’s development were uncovered and highlighted below:
a) Stagnated and truncated GDP b) Slow and low growth
c) Risk and high cost of business d) High rate of urbanization e) The millennium development a) Stagnated and truncated GDP
Before the advent of NEEDS programme in 2003, Nigeria GDP was plummeted with a truncated history (Umeh, 2015). Between 1960-70, the GDP recorded 3.1 per cent increase per annum. While during the oil boom, that is 1970-78, GDP recorded positive and remarkable growth of 6.2 per cent annual increase. But in the early 80s, the GDP nosedive into negative status. Until around 1988-1997 when a positive growth rate of 4.0 was recorded as a result of the introduction of the Structural Adjustment Programme (SAP). In 1960, before independence, agricultural sector alone contributed 63 per cent. In 1988 due to neglect of the sector by working population who were lured away by oil boom (Umeh, 2015) which was not only responsible for rural-urban migration but also resulted into urbanization crisis such as slums, insecurity, high cost of living and unemployment. It was not a surprise by 1975, Nigeria has become major importer of agricultural products.
b) Slow and Low Growth
Slow growth is another element that shaped the economic situation of Nigeria from 70s- 80s. The go-slow syndrome experienced in developing the nation was encouraged by low saving which is one of the critical requirement and basis for investment and capital needed for industrialization. The joint report from the study of IMF and IDA (2005) concludes that Nigeria ranked the least industrialized in Africa with 5%-7% GDP.
The above factor coupled with hostile business environment such as infrastructural deficiency, insecurity of lives and property, corruption, low access and high cost of finance were responsible for low growth rate recorded in the 1970s to 80s.
c) Risk and high cost of business operations
The real sector in the economy before the advent of NEEDS in the 70s and 80s was dominated by the primary production due to high risk and cost of doing business by the manufacturing sector. This led to the depletion of natural resources while other sectors were hampered functionally.
d) High rate of urbanization
The oil boom of 80s caused migration of the labour from rural to cities. The reigning agricultural sector was not attractive enough to the younger populations which were hired into the urban in search for white collar jobs. This development created another negative situation for the economy. Firstly, the agricultural sector lost in gross the needed labour to facilitate its activities. While the recipient cities find it difficult to accommodate the influx of the unplanned labour force. It resulted into high cost of living, rent, crime, insecurity, and ultimately poor standard of living.
e) Attainment of Millennium Development Goals (MDGs)
The eight international development goals for the year 2015 also known as the Millennium Development Goals (MDGs) were the economic targets of every responsible developing nations before the year 2015 lapses. The eight goals which were: eradication of extreme poverty and hunger, universal primary education, gender equality and women empowerment, child mortality reduction, improved maternal health, HIV/AIDs, malaria reduction, environmental sustainability and global partnership for development became standard at which budget were prepared, development and growth were measured.
It became obvious up till 1999, that Nigeria does not stand any chance of attaining the MDGs because of the economic crisis that pervaded almost all the sectors of the economy (Okonjo-Iweala, 2013). There was no sign of possibility of achieving the MDGs due to the retrogressive status of the Nigeria economy.
As previously noted in this study, Nigeria has never for once experience drought in developmental and intervention policies, but the eventual outcome has rarely be in tandem with the pselected objective and goals. Among the policies introduced before NEEDS to re-invigorate the economy, notable and deserved further elaboration is the SAP introduced during the military administration of Ibrahim Badamosi Babangida in 1986.
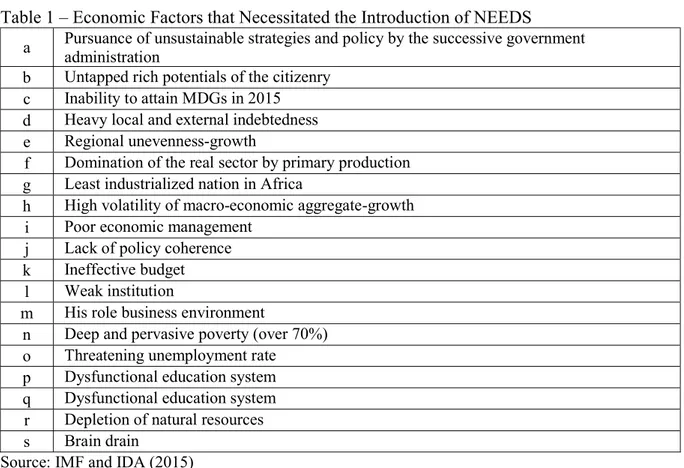
The economic situation of Nigeria before the advent of NEEDS programme was at critical stage in which none of the productive sectors was spared from the economic woes. They were all plagued with various developmental crises. The economic factors that betides the nations development and growth which eventually necessitated the introduction of NEEDS can be summarized in Table 1, as highlighted by IMF and IDA(2015).
Table 1 – Economic Factors that Necessitated the Introduction of NEEDS
a Pursuance of unsustainable strategies and policy by the successive government administration b Untapped rich potentials of the citizenry
c Inability to attain MDGs in 2015 d Heavy local and external indebtedness e Regional unevenness-growth
f Domination of the real sector by primary production g Least industrialized nation in Africa
h High volatility of macro-economic aggregate-growth i Poor economic management
j Lack of policy coherence k Ineffective budget
l Weak institution
m His role business environment
n Deep and pervasive poverty (over 70%) o Threatening unemployment rate
p Dysfunctional education system q Dysfunctional education system r Depletion of natural resources s Brain drain
Source: IMF and IDA (2015)
2.3. Advent of NEEDS
In 1999-2003, the administration of Olusegun Obasanjo was able to ensure policy stabilization and also checkmate all the economic problems that permeated all sectors of Nigeria. In order to prevent this achievement from being eroded (IMF and IDA, 2005), a consolidating measure was set up to ensure that the achievement recorded were not lost. Hence, NEEDS was introduced in 2004, and saddled with the major responsibility of consolidating on the gains and also lay sustainable foundation on how other economic problems such as poverty reduction, employment generation, wealth creation and value orientation can be attained.
According to the former President Olusegun Obasanjo, NEEDS was primarily introduced to engage the national resources in breaking away from the old to pave way for a new united and prosperous Nigeria from this generation to generation to come. NEEDS provided a framework for a national coordinated program of action by the three tiers of government.
According to the joint work of IMF and IDA (2003), the process of NEEDS was began in 2003, stakeholders from all spheres of the economy was given opportunity to air their needs and future ambitions. The information gathered from the national and wide consultation with the people helped in the drafting of the first phase of NEEDS policy. NEEDS was centered on reducing poverty, generating employment, creating wealth, and value re-orientation. Meanwhile, the attainments of these goals were tied to a hospitable and conducive environment that will enable business to thrive.
NEEDS was a four years medium term plan for the period of 2003 to 2007. Though being a federal plan, it integrates both state and local government together to ensure their parts are being played to ensure the success of the whole intervention. State Economic Empowerment and Strategies (SEEDS) and Local Government Empowerment and Development Strategies
(LEEDS) for state and local government respectively. Besides the involvement all the three-tier of government, all and sundry were mobilized support for the program.
3. Research Method
The study adopted mixed methods were adopted and the analysis is divided into two stages. The first stage involves collection of secondary data from National Bureau of Statistics (NBS) and other verifiable sources to comparatively analyze the significant difference recorded on poverty reduction, unemployment reduction, wealth creation and value re-orientation before, during and after the intervention of NEEDS as policy. Percentage bench mark was set and mean were compared to determine the level of significance. While the second stage involved the use of descriptive survey for data collection. Two hundred and forty (240) respondents were randomly selected from state and private institutions in Ogun State to examine their opinions on the aftermath effect of NEEDS policy in comparison to its aftermath effect since the policy was objectively designed to affect every citizen.
Convenience sampling technique was adopted in distributing the questionnaires to respondents in both state ministries and private institutions. Two hundred (200) copies of the questionnaires that were filled and returned by the respondents represent 83.3% return rate. Instrument reliability was established with a test-retest gave ‘r’ = 0.86. The retrieved questionnaires were analyzed using t-test statistics for testing of hypotheses at 0.05 level of significance while mean was used in answering the research question. A score of 1.5 was taken as cut-off point for accepting an item as significant while score less than 1.5 was taken to be insignificant.
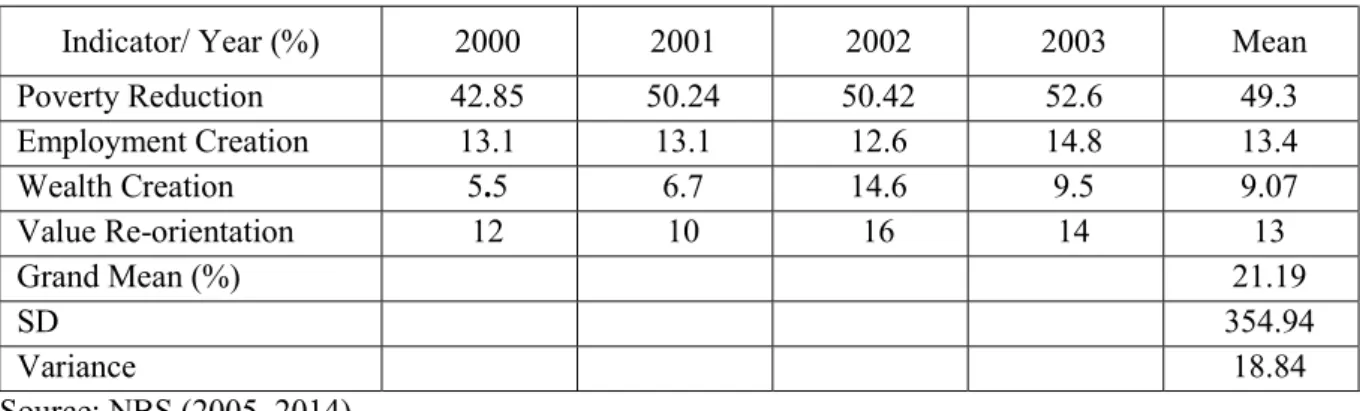
Table 2 shows that before the introduction of NEEDS as policy intervention, the percentage score for poverty reduction indicator was over 50% in 2001 to 2003 and also worthy of note is the percentage score for wealth creation in 2002 which recorded the highest percentage of 14.6% compare to year 2000, 2001 and 2003 with 5.5%, 6.7% and
9.5 respectively. The overall grand mean of the GDI was 21.19% which is less than 50% bench mark.
Table 2 – Pre-NEEDS era
Indicator/ Year (%) 2000 2001 2002 2003 Mean Poverty Reduction 42.85 50.24 50.42 52.6 49.3 Employment Creation 13.1 13.1 12.6 14.8 13.4 Wealth Creation 5.5 6.7 14.6 9.5 9.07 Value Re-orientation 12 10 16 14 13 Grand Mean (%) 21.19 SD 354.94 Variance 18.84 Source: NBS (2005, 2014)
Table 3 reveals a change in the poverty rate indicator with a percentage score of staggering figure of 54.4% in 2004 that marked the introduction of NEEDS era compare to 42.85% in 2000 before the intervention of NEEDS policy. While employment creation and wealth creation remains staggered. The value-re-orientation increased from 2004 with a percentage score of 10% to higher figure of 22% in both 2006 to 2007. Moreover, the grand mean also increased from 21.19% in PRE- NEEDS era to 22.76% in NEEDS era. This indicates the immediate
impact of NEEDS policy on the value re-orientation GDI but the impact on employment creation and poverty reduction remains increasingly insignificant.
Table 3 – NEEDS era
Indicator/ Year (%) 2004 2005 2006 2007 Mean Poverty Reduction 54.4 51.56 51.58 51.6 52.54 Employment Creation 13.4 11.9 12.3 12.1 12.42 Wealth Creation 10.4 7 6.7 7.3 7.85 Value Re-orientation 10 19 22 22 18.25 Grand Mean (%) 22.76 SD 412.14 Variance 20.3 Source: NBS (2005, 2014)
Table 4 shows that poverty was temporarily stabilized immediately after the introduction of NEEDS policy with figure of 67.5, 68 and 69 percent in 2008, 2009 and 2010 respectively. The employment creation experienced no impact because the percentage stood at 50 for the three years. Wealth creation increased and later decreased but the value re-orientation was the worst hit, the percentage plummeted from the higher percentage of 22.73 in 2008 to -4 in 2010 which is the lowest. Yet the overall grand mean increased from 22.76 to 32.69%. The increase in the grand mean could be attributed to the immediate effect of NEEDS intervention.
Table 4 – Post NEEDS era 1
Indicator/ Year (%) 2008 2009 2010 Mean Poverty Reduction 67.5 68 69 68.1 Employment Creation 50 50 50 50 Wealth Creation 7.2 8.4 11.3 8.9 Value Re-orientation 22.73 -7.41 -4 3.7733 Grand Mean (%) 32.69 SD 31.38 Variance 984.7
Source: UN Department of Economics. Social Affairs, NBS (2014 & 2015)
Table 5 shows that poverty rate grew worse after the introduction of NEEDS policy with a whopping figure of 69.01 in 2011 compared to 51.6% in 2007. The rate continues to worsen even from 2012 to 2014 with an average mean score of 69.43%. The unemployment rate also continues to increase with 27.4% in 2012 and average mean score of 25.25% in compared to 11.9% in 2005 and average mean of 12.42% when NEEDS was introduced. The overall grand mean increased from to 31.7%. The increase in the grand mean could be attributed to the temporary effect of NEEDS intervention but was short-lived due to lack of sustainable culture.
Table 5 – Post NEEDS Era 2
Indicator/ Year (%) 2011 2012 2013 2014 Mean Poverty Reduction 69.01 69.47 69.49 69.74 69.43 Employment Creation 23.9 27.4 24.7 25 25.25 Wealth Creation 7.68 6.17 5.49 6.23 6.39 Value Re-orientation 24 27 25 27 25.75 Grand Mean (%) 31.7 SD 713.72 Variance 26.72 Source: NBS (2005, 2014)
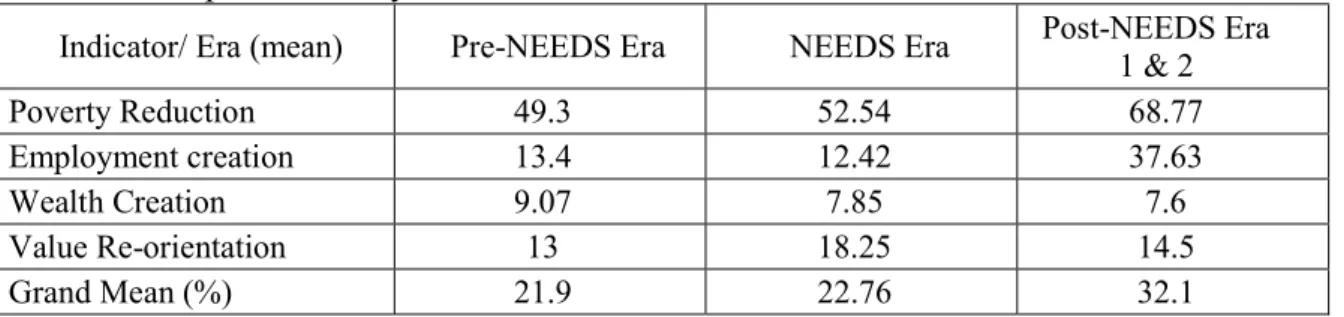
Table 6 shows the summary and comparative analysis of the four eras; Pre-NEEDS, NEEDS and Post-NEEDS 1 and 2. The table shows that average means score of poverty rate continue to increase unabated from lower 49.3% from 2000 to 2003 that represent the era before the advent of NEEDS intervention compared to the increased figure of 52.54% and 69.43% during NEEDS era and after the introduction respectively. On employment creation rate, the rate was adopted from the report available on United Nations Department of Economics Social Affairs and National Bureau of Statistics (NBS) and it was stabilized after the introduction of NEEDS with 37.63% after the intervention of NEEDS. Wealth creation recorded the almost the same impact with9.07% before the advent of NEEDS to a decreasing figure of average mean score of 9.07% to 7.6% after the introduction of NEEDS. The value re-orientation also suffered the same fate, it risen 13% to 18% which later fell to 14.5% in 2008, 2009 and 2010 respectively. The overall grand mean show increase in the figure from 21.9% to 32.1% but far lower to the 50% bench mark set for the study. This indicate that NEEDS intervention was not effective, though it cannot be totally tagged a failed policy but ineffective because it was unable to achieve the four cardinal objectives of reducing poverty rate, employment creation and national wealth created and value-re-orientation.
Table 6 – Comparative analysis of the four eras
Indicator/ Era (mean) Pre-NEEDS Era NEEDS Era Post-NEEDS Era 1 & 2 Poverty Reduction 49.3 52.54 68.77 Employment creation 13.4 12.42 37.63 Wealth Creation 9.07 7.85 7.6 Value Re-orientation 13 18.25 14.5 Grand Mean (%) 21.9 22.76 32.1
4. Results
The analysis of the data and its interpretation were divided into two parts. Part one analyzed the secondary data collected using comparative mean analysis in analyzing the percentage mean scores of the intervention of NEEDS policy before, during and after on the targeted GDI. The grand mean scores were determined to take a decision. Any percentage mean score that is less than 50% is considered not significant.
The second part of the analysis involves the analysis of the research questions and testing of the hypotheses. A two-point scale was used for analysis. For instance, “Significant” was awarded 2 and “Insignificant” was awarded 1. Following this, the mean scores were determined
to take a decision. To take a decision, any mean score below 1.5 is considered negative and above is considered as positive. Discussion of the findings is presented at the end of each table.
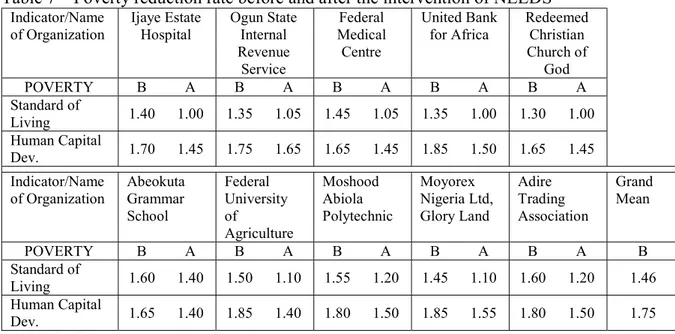
Research Question 1: What is the significant difference in poverty reduction rate before and after the intervention of NEEDS?
Table 7 shows the impact on GDI before and after the intervention of NEEDS. Table 4 revealed different mean scores under two indicators of poverty.
Before the intervention of NEEDS, both standard of living and human capital development indicator recorded high mean score and none of the mean score was below 1.5. The standard of living after the intervention of NEEDS recorded the lowest mean score of 1.10 compared to 1.50 mean score before the intervention of NEEDS. Also human capital development recorded only one instance average of 1.50 mean score and the rest scores were lower than the ceiling mark of 1.5. Worthy of note are the two instances when standard of living slipped into 1.00 after the intervention of NEEDS, and improving the standard of living and development of human capital through poverty reduction are the first objective of NEEDS. This shows that there is no significant difference in poverty reduction rate after the intervention of NEEDS Table 7 – Poverty reduction rate before and after the intervention of NEEDS
Indicator/Name
of Organization Ijaye Estate Hospital Ogun State Internal Revenue Service Federal Medical Centre United Bank
for Africa Redeemed Christian Church of God POVERTY B A B A B A B A B A Standard of Living 1.40 1.00 1.35 1.05 1.45 1.05 1.35 1.00 1.30 1.00 Human Capital Dev. 1.70 1.45 1.75 1.65 1.65 1.45 1.85 1.50 1.65 1.45 Indicator/Name
of Organization Abeokuta Grammar School Federal University of Agriculture Moshood Abiola Polytechnic Moyorex Nigeria Ltd, Glory Land Adire Trading Association Grand Mean POVERTY B A B A B A B A B A B Standard of Living 1.60 1.40 1.50 1.10 1.55 1.20 1.45 1.10 1.60 1.20 1.46 Human Capital Dev. 1.65 1.40 1.85 1.40 1.80 1.50 1.85 1.55 1.80 1.50 1.75
NOTE: B=Before intervention, A=After intervention
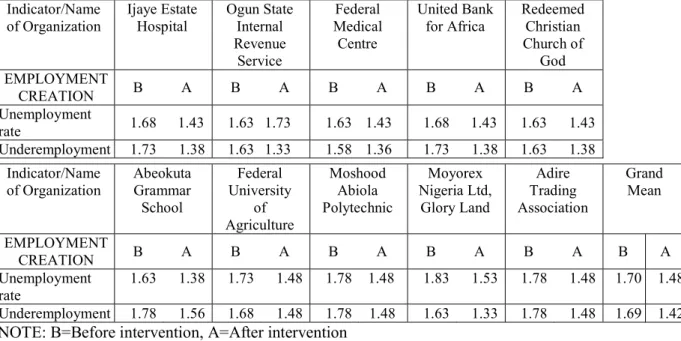
Research Questions 2: What is the significant difference on employment creation before and after the intervention of NEEDS?
Table 8 shows the significant influence on employment generation before and after the intervention of NEEDS. It reveals different mean scores of unemployment and underemployment which serve as indicator for employment creation before and after the intervention of NEEDS.
Before the intervention, none of the two indicators recorded mean score lower than the ceiling mean score of 1.5 and while after the intervention the mean scores also took the lower direction lower than 1.5. The employment creation mean score drastically reduced and underemployment score didn’t soar towards the ceiling mean score of 1.5. The mean scores for the two items remained higher than the ceiling mean score before the intervention and remained
increasingly lower after the intervention. This connotes two implications, one, the number of employment created was insignificant compared to number of unemployed labor and also the reduction in unemployment and underemployment was not significant.
Table 8 – Significant difference on employment creation before and after the intervention of NEEDS
Indicator/Name
of Organization Ijaye Estate Hospital Ogun State Internal Revenue Service Federal Medical Centre United Bank
for Africa Redeemed Christian Church of God EMPLOYMENT CREATION B A B A B A B A B A Unemployment rate 1.68 1.43 1.63 1.73 1.63 1.43 1.68 1.43 1.63 1.43 Underemployment 1.73 1.38 1.63 1.33 1.58 1.36 1.73 1.38 1.63 1.38 Indicator/Name
of Organization Abeokuta Grammar School Federal University of Agriculture Moshood Abiola Polytechnic Moyorex Nigeria Ltd, Glory Land Adire Trading Association Grand Mean EMPLOYMENT CREATION B A B A B A B A B A B A Unemployment rate 1.63 1.38 1.73 1.48 1.78 1.48 1.83 1.53 1.78 1.48 1.70 1.48 Underemployment 1.78 1.56 1.68 1.48 1.78 1.48 1.63 1.33 1.78 1.48 1.69 1.42
NOTE: B=Before intervention, A=After intervention
Research Question 3: Is there any significant difference in wealth created before and after the intervention of NEEDS?
Table 9 shows the state of wealth created through the indicators of GDP and level of industrialization before and after the intervention of NEEDS. Table 9 reveals different mean scores under these two indicators wealth creation. Before intervention, the GDP and industrialization level were both higher and fair because the average mean scores for both were higher than 1.5 mean score set as ceiling mean score. But the GDP mean was plummeted after the intervention of NEEDS. So also for industrialization, the policy was not favourable because all the mean scores after the intervention were lower than 1.5 compared to higher mean score of 1.85 recorded before the intervention. The average mean scores for both GDP and Industrialization were higher than the ceiling score of 1.5. This shows that the policy was favorable to wealth creation objective. The implication is that, the level of wealth created was significant after the intervention of NEEDS but not beneficial to the citizens.
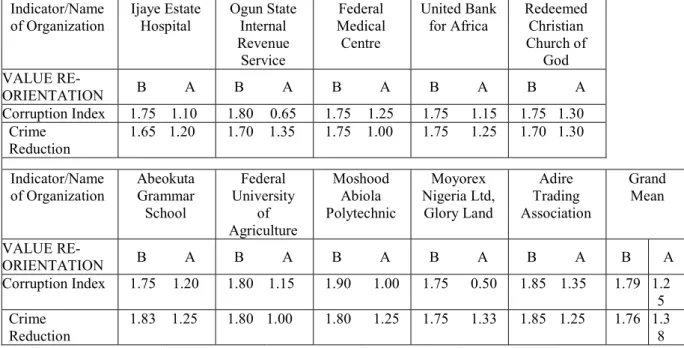
Research Question 4: What is the significant difference in value re-orientation before and after the intervention of NEEDS?
Table 10 shows the state of wealth created through the indicators of value re-orientation through corruption index and crime reduction rate before and after the intervention of NEE DS. Table 10 reveals different mean scores under these two indicators of value re-orientation. Before intervention, the mean score for corruption was higher but not above the ceiling mean score of 1.5 mean score while that of crime reduction were above 1.5 ceiling mean score but the mean score of corruption were made worst after the intervention having mean score lower than 1 mean score in two instances and also of crime reduction have no instance where the mean
score was equal or above the ceiling mean score of 1.5. This shows that the NEEDS policy intervention was not effective re-orientation of people value. The implication is that, the policy was unable to re-orientate the value of Nigerians and the efforts put up by the policy were not significant.
Table 9 – Significant difference in wealth creation before and after the intervention of NEEDS Indicator/Name
of Organization Ijaye Estate Hospital Ogun State Internal Revenue Service Federal Medical Centre United Bank
for Africa Redeemed Christian Church of God WEALTH CREATED B A B A B A B A B A GDP 1.75 1.50 1.80 1.65 1.75 1.55 1.75 1.55 1.75 1.60 Industrialization 1.65 1.50 1.70 1.55 1.75 1.50 1.75 1.55 1.70 1.50 Indicator/Name
of Organization Abeokuta Grammar School Federal University of Agriculture Moshood Abiola Polytechnic Moyorex Nigeria Ltd, Glory Land Adire Trading Association Grand Mean WEALTH CREATED B A B A B A B A B A B GDP 1.75 1.50 1.80 1.55 1.90 1.60 1.75 1.50 1.85 1.55 1.79 Industrialization 1.83 1.65 1.80 1.60 1.80 1.55 1.75 1.63 1.85 1.65 1.76
NOTE: B=Before intervention, A=After intervention
Table 10 – Significant difference in value re-orientation before and after the intervention of NEEDS
Indicator/Name
of Organization Ijaye Estate Hospital Ogun State Internal Revenue Service Federal Medical Centre United Bank
for Africa Redeemed Christian Church of God VALUE RE- ORIENTATION B A B A B A B A B A Corruption Index 1.75 1.10 1.80 0.65 1.75 1.25 1.75 1.15 1.75 1.30 Crime Reduction 1.65 1.20 1.70 1.35 1.75 1.00 1.75 1.25 1.70 1.30 Indicator/Name of Organization Abeokuta Grammar School Federal University of Agriculture Moshood Abiola Polytechnic Moyorex Nigeria Ltd, Glory Land Adire Trading Association Grand Mean VALUE RE- ORIENTATION B A B A B A B A B A B A Corruption Index 1.75 1.20 1.80 1.15 1.90 1.00 1.75 0.50 1.85 1.35 1.79 1.2 5 Crime Reduction 1.83 1.25 1.80 1.00 1.80 1.25 1.75 1.33 1.85 1.25 1.76 1.38
5. Hypotheses Testing
Hypothesis 1: There is no significant difference in poverty reduction before and after the intervention of NEEDS
Table 11 shows the t-test result for difference in poverty reduction before and after the intervention of NEEDS. Since t-stat calculated value of 0.510452. is lesser than the t-critical of 12.7062 at a'=0.05, then we can conclude that there is no significant difference on poverty reduction after the intervention of NEEDS. Therefore, the hypothesis which says that there is no significant difference on poverty reduction as a result of intervention of NEEDS is accepted. Table 11 – T-test result in difference on poverty reduction
Before After Mean 1.605 1.3395 Variance 0.04205 0.29645 Observation 2 2 DF 1 t-start 0.510452 t-Critical (2 tails) 12.7062
Hypothesis 2: There is no significant difference on employment creation before and after the intervention of NEEDS
Table 12 shows the t-test result for difference in significant difference on employment creation before and after the intervention on NEEDS. Since t-stat value of 8.05555 is lesser than t-critical value of 12.7062 at a'=0.05, then we can conclude that there is no significant difference in unemployment rate after the intervention of NEEDS. Therefore, the hypothesis which says that there is no significant difference on employment creation as a result of intervention of NEEDS is accepted.
Table 12 – T-test result on difference in employment generation after the intervention of NEEDS Before After Mean 1.695 1.450 Variance 0.00005 0.0008 Observation 2 2 DF 1 1 t-Start 8.05555 t-Critical (2 tails) 12.7062
Hypothesis 3: There is no significant difference in wealth created before and after the intervention of NEEDS.
Table 13 shows the t-test result for difference in wealth creation before and after the intervention of NEEDS. Since t-stat value of 9.89949 is greater than t-critical of 4.30265 at a'=0.05, then conclusion can be made that the wealth creation was significant as a result of NEEDS intervention. Therefore, the hypothesis which says that there is no significant difference in the wealth creation due to intervention of NEEDS is not accepted.
Table 13 – T-test result on difference in the wealth created after the intervention of NEEDS. Before After Mean 1.775 1.565 Variance 0.00045 0.00045 Observation 2 2 DF 1 t- start 9.89949 t- Critical (2 tails o 4.30265
Hypothesis 4: There is no significant difference in value-reorientation before and after the intervention of NEEDS.
Table 14 shows the t-test result for difference in value re-orientation before and after the intervention of NEEDS. Since t-stat value of 6.89569 is lesser than t-critical of 12.7062 at a'=0.05, then we can conclude that the value re-orientation were not significant as a result of NEEDS intervention. Therefore, the hypothesis which says that there is no significant difference in the value re-orientation due to intervention of NEEDS is not rejected.
Table 14 – T-test result on difference in the value re-orientation after the intervention of NEEDS. Before After Mean 1.775 1.31501 Variance 0.00045 0.00845 Observation 2 2 DF 1 t- start 6.89569 t- Critical (2 tails o 12.7062
6. Discussion
The result of the appraisal indicated that there was no significant difference recorded on all the (GDI) of poverty rate, employment creation, value-re-orientation after the introduction of NEEDS except for wealth creation.
This also confirms the poor state of GDI as corroborated by Afolayan (1998) on the retrogressive effects that most of the post-SAP policies had on the economy. In addition, findings aligned also with Okonjo -Iweala (2017) on the weakness of NEEDS and other PP in translating the merits into citizenry benefits despite the laudable introduction. This could have been due to the leadership factor or available political will of the policy stakeholders. The findings from the study indicate that NEEDS was unable to achieve its four cardinal objectives of reducing the national poverty, reduction of unemployment by creating more employment opportunities, national value re-orientation , even though pool of wealth was created but few individual benefit at the expense of the general masses and also failed in general objective of reforming the whole sectors of the economy.
In addition, the findings reveal an ineffective impact and insignificant differences on the targeted GDI before and after the intervention of NEEDS. It was observed that the mean scores of most of the items decreased after the intervention of NEEDS except for the items such as the GDP which was rising and falling. Standard of living, corruption crime reduction, and
unemployment were worsening with lower and absurd mean scores compared to their mean score before the intervention of NEEDS. So in general the intervention of NEEDS was not effective because it added no significant change to the targeted GDI in Nigeria but rather worsen the situation.
7.
Conclusion and Recommendations
The study has revealed gross ineffectiveness as policy intervention on GDI. This is an indication that even the tripartite effort of the Federal (NEEDS), State (SEEDS) and Local (LEEDS) did not achieve the planned objectives. Subsequent study on this topic is advised to focus on how the merits of laudable governmental policies can be translated into the benefits of the citizens.
Based on the findings of this study, the following recommendations are made:
i. Thorough analysis of previous or existing policy needs to be undertaken in order to ascertain the reason for its failure, weakness, and replacement and sustainability. ii. There is need for appropriate and effective growth plan in order to improve socio-
economic welfare of the people.
iii. Law must be enacted that will ensure continuity of value adding existing policy regardless of change in administration to avoid premature jettisoning of same.
iv. New policies should be introduced when only the existing policy has failed to achieve the purpose for which it was introduced.
v. A ministry should be saddled with the responsibility of carrying out a comprehensive appraisal of intending policy with appropriate sanction in case of eventual failure before the introduction of new one to avoid waste of human and material resources, including recommendation to abandon any policy that is not working.
vi. Introduction of new policies should specifically focus on a sector or selected sectors rather than center on the whole sectors of the economy for effectiveness and efficiency.
References
1. Afolayan, B. (1998). Macro Economics, Indemac Limited.
2. Akpobasah, M. (2004). The development strategy for Nigeria. A paper presented at the overseas development/Nigeria Economic Summit Group Meeting on Nigeria. London 3. Bamiduro, J.A. and Babatunde, S. T. (2006). NEEDS: Prospects and Challenges for
Nigeria. Journal of Economics and Financial Studies, Adekunle Ajasin University, Akungba Akoko, Ondo: logos-universal Publishers Inc. p.123
4. Danladi, A. and Naankiel, P.W. (2016). Structural Adjustment Programme in Nigeria and its implication on Socio-Economic Development, 1980-1999, The Calabar History Journal, 6, 2, University of Calabar, Calabar, Nigeria.
5. Effoduh, J. O. (2015). The Economic Development of Nigeria from 1914 to 2014. Journal of Council on African Security and Development.
6. Egonmwan, J.A. (1991). Public Policy Analysis Concept and Application. Benin City: Resyin (Nig.) Company
7. IDA and IMF (2006). Poverty Reduction Strategy Paper Joint Staff Advisory Note. 8. International Journal of Economics and Financial Research. 3(5), 65-75.
9. Obasanjo, A. O. (2004). An address delivered during the lunching of the NEEDS at the presidential villa, Abuja, Nigeria.
10. Okojo-Iweala, N. (2013). Nigeria: Background to economic reforms. Vanguard Nigeria Newspaper,www,vanguardngr.com/2012/11/nigeria-background-to-economic-reforms/ amp
11. Okojo-Iweala, N. and Osafo-Kwaako, P. (2007). Nigeria's Economic Reforms: Progress and Challenges, Brooking Global Economic Development
12. Okonkwo, C. Eze (2014). NEEDS and Labour in Nigeria, 2003-2007, Journal of Good Governance and Sustainable Development in Africa 2. 2
13. Otoghagua, E. (2007). Trends and contemporary issues on regimes of Nigerian heads of state policies and politics achievements and failures. 3rd edtn., Benin City: Research Knowledge and Educational Services, Nigeria.
14. Soludo, C.C. (2004). Debt, Poverty and Inequality: Toward an exit strategy for Nigeria and Africa. Trenton: Africa World Press
15. Ugoani, J.N.N. (2017). Examination of the Impact of NEEDS on Poverty Reduction in Nigeria.