RISK AND PERILS IN LBO
TRANSACTIONS
Vincenzo Capizzi
*
, Renato Giovannini
**
, Valerio Pesic
***
* Eastern Piedmont State University, Novara, Italy; SDA Bocconi School of Management, Milan, Italy** Guglielmo Marconi University, Rome, Italy; SDA Bocconi School of Management, Milan, Italy *** Corresponding author, La Sapienza University, Rome, Italy
Contact details: Faculty of Economics, La Sapienza University, Via del Castro Laurenziano 9, 00161 Rome, Italy
1. INTRODUCTION
This study aims to analyze the objectives of LBO transactions, together with the risks and opportunities that can derive to the whole firms’ stakeholders. From this perspective, we add to previous literature that has investigated the post-LBO operating performance and the factors that can determine the success of those deals. In particular, we confirm the hypothesis of a potential peril of assets stripping, even if we find evidence that the presence of private equity, among other factors, can help to mitigate that issue. We find evidence that especially firms characterized by a higher debt before the deal, are more suitable to experiment a contraction of the number of employees, even if also for this variable we find evidence that the presence of private equity mitigates that threat. We find evidence of a
contraction of the cost of employees, which seems to become even stronger when the firm is characterized by a higher level of taxation and when a private equity investor is involved. We find evidence that, especially in the short term, enterprises suffer from a slight deterioration in operating performance compared to their situation before the buyout. Moreover, under specific circumstances, enterprises experience a slight improvement in the ability to generate cash. Finally, we find evidence that the presence of private equity investors is mainly able to promote the growth of firms, as well as to increase the capability to generate cash. To perform this analysis, we created a dataset that was sufficiently large and able to carry out a survey of these types of operations, with a final sample consisting of 2,450 MBO and MBI deals, which we consider as particularly significant since it is related to a very broad sample of transactions occurred around the world. Thank this dataset, we
Abstract
How to cite this paper: Capizzi, V.,
Giovannini, R., & Pesic, V. (2019). Risk and perils in LBO transactions [Special issue]. Corporate Ownership
& Control, 17(1), 306-324.
http://doi.org/10.22495/cocv17i1siart12 Copyright © 2019 The Authors This work is licensed under a Creative Commons Attribution 4.0 International License (CC BY 4.0). https://creativecommons.org/licenses /by/4.0/ ISSN Online: 1810-3057 ISSN Print: 1727-9232 Received: 05.10.2019 Accepted: 26.12.2019 JEL Classification: G32, G34 DOI: 10.22495/cocv17i1siart12
In this study, the risks and perils arising from LBO transactions are considered. By focusing attention on 2,450 deals, for which we compare the performance achieved before and after the deal, our study adds to previous literature that has investigated the post-LBO operating performance and the factors which can determine the success of those deals. In particular, we confirm the hypothesis of the peril of assets stripping, even if we find evidence that the presence of private equity, among other factors, can help to mitigate that issue. We find evidence that, especially in the short term, enterprises suffer from a slight deterioration in operating performance compared to their situation before the buyout. Moreover, under specific circumstances, enterprises experience a slight improvement in the ability to generate cash. Finally, we find positive evidence about the presence of private equity investors, which through their governance are mainly able to promote the growth of firms, as well as to increase the capability to generate cash, together with the hypothesis to generate positive effects on the level of employment. At the same time, we find also evidence that the presence of private equity investors is related in some cases to distress for firms involved in LBO transactions.
Keywords: LBO, Governance, Private Equity, Asset Stripping, Employment, Distressed
Authors’ individual contribution: Conceptualization – V.C., R.G., and V.P.; Methodology – V.C. and R.G.; Validation – R.G. and V.P.; Formal Analysis – V.C. and V.P.; Writing – Original Draft – V.C. and R.G.; Writing – Review and Editing – R.G. and V.P.; Supervision – V.C. and V.P.
add to previous literature that has investigated the post-LBO operating performance and the factors that determine their success, as well as their failure. More in particular, we show how the presence of a private equity operator seems to be beneficial, especially for promoting the growth of firms in the medium and long term, as well as to increase the capability to generate cash, together with the hypothesis to generate positive effects on the level of employment. Nevertheless, we find evidence that in certain case the presence of PE investors can become potential detrimental for firms, probably because their pressure to achieve their financial performance push them to bear a high level of risk, with the consequence of a higher likelihood of distress. The remainder of the paper is structured as follows. Section 2 is dedicated to a brief overview of the literature on LBO transactions. Section 3 summarizes our research hypothesis, about the risks and opportunities of LBOs transactions. Section 4 describes the dataset and the model of analysis, together with the variables observed. Section 5 presents the evidence obtained. Section 6 concludes.
2. LITERATURE REVIEW
During different times, LBO transactions have received considerable attention in the economic literature (Nikoskelainen & Wright, 2005). From this perspective, there is an abundance of research on the increase in the value of the targets of buyouts and returns made by the buyout level of investment. However, since the availability of the output of this research depends on access to information on transactions, which are usually confidential, research on the returns of buyout is focused on limited samples (Kaplan, 1989) or level analysis investment funds (Kaplan & Scholar, 2003; Ljungqvist & Richardson, 2003). Studies that analyze the factors that have an impact on the returns of buyouts can be ascribed to the existing literature on LBOs. In particular, a large literature on the economic effects of the buyout, focused mainly in the US in the 80s and 90s, has generally demonstrated a positive impact of this transactions on corporate organization, as measured by an increase in the profitability and productivity of the subsidiary (Kaplan, 1989; Lichtenberg & Siegel, 1990; Muscarella & Vetsuypens, 1990; Palepu, 1990; Smith, 1990; Wright, Thompson, & Robbie, 1992). In the literature, over the years, have been put forward and tested several hypotheses about the LBO. The idea of tax incentives (tax benefits hypothesis) consider the advantage resulting from increased deductibility of interest expense that is achieved with the implementation of the LBO because it is financed by the increase in financial leverage (Lowenstein, 1985; Kaplan, 1989a; Frankfurter & Gunay, 1992; Halpern, Kieschnick, & Rotenberg, 1999).
Jensen (1986) suggests that the companies engaged in a buyout transaction increase their operating profitability more than comparable firms that are not subject to such action, as a result of better governance mechanisms. Cressy, Munari, and Malipiero (2007) show that in the first three years after the buyout operating profits of venture-backed firms is higher by 4.5% compared to their comparables, in agreement with Jensen’s hypothesis. In addition, the initial yield of venture-backed firms
plays a key role in the post-buyout profitability, suggesting that the ability in the selection of investments and financial engineering techniques may be more important in the managerial incentives to generate higher performance for these companies. The results are consistent with the hypothesis that the change in the governance structure of these firms leads to the creation of a new organizational structure, which is more efficient than the previous one. There is also the possibility of underestimation, which emphasizes the existence of a positive relationship between the underestimation of pre-LBO firms and the gains expected by the shareholders at the time of completion of the transaction. Within the work carried out by Renneboog, Simons, and Wright (2007), this effect is found to be stronger for the Management Buyout (MBO) and Institutional Buyout (IBO), rather than in Management Buy-In (MBI), as the former are able to make better use of the problems related to the underestimation and deriving from information asymmetries. The hypothesis of defense against takeover, however, suggests that LBOs transactions, especially if then followed by a delisting, are the last line of defense against hostile takeovers and initial public offerings (Lowenstein, 1985; Stulz, 1988), especially when the pressure on the part of the market for corporate control becomes stronger (Lehn & Poulsen, 1989; Halpern, Kieschnick, & Rotenberg, 1999). According to the free cash flow hypothesis proposed by Jensen in 1986, the LBOs lead to corporate governance mechanisms that reduce agency costs and by improving operational efficiency lead to an increase in the value of the firm. The central elements of this governance structure are the debt and the presence of active investors. Agency costs arise if the cash flow is invested in less profitable development, expanding the business or distributed to shareholders. Debt can reduce these costs and can be used as a substitute for dividends, creating an obligation to pay periodic interests. However, the inability to repay these costs and capital borrowed can lead to the liquidation of the company. Since the LBO debt levels are very high, most of the cash flow is used to honor the debt service. The threat of bankruptcy created by the failure to pay interest motivates companies to become as efficient as possible. The massive use of debt to finance the buyout leads to a reduction in shareholders’ equity in the financial structure, allowing investors and private equity managers to control the majority of shares, which would otherwise not be able to buy. The concentrated ownership provides private equity investors the ability to monitor and control the strategy of the Target Company through an active presence on the board. Support for Jensen’s theory of free cash flow has been documented in numerous studies. Lehn and Poulsen (1989), Kaplan (1989), Smith (1990), Muscarella and Vetsuypens (1990), Cotter and Peck (2001) and Bruton, Keels, and Scifres (2002) find that higher leverage and realignment of incentives have a positive effect on the operating performance of the company being leveraged buyout. Furthermore, Bull (1989), Hall (1990), Lichtenberg and Siegel (1990), Opler (1992), Long and Ravenscraft (1993), Ofek (1994), Wright, Hoskisson, Busenitz, and Dial (2001), Desbrières and Schatt (2002) and Harris, Siegel, & Wright (2005)
provide evidence of a cost-cutting, improved margins and efficiency after the buyout. Easterwood, Seth, and Singer (1989), Singh (1990), Smith (1990), Long and Ravenscraft (1993) and Holthausen and Larcker (1996) also show that, even if the buyout lead to improvements in performance and financial accounting, such improvements are not durable, so that seem to be reduced with increasing time since the buyout. Operational performance, as well as the efficient use of available resources and funding, are key elements of the value of the firm. However, the various changes and improvements in operational only serve as a proxy but are not direct measures of the value created. In addition, the changes made to operations often are in the short term and can have a negative effect on the future prospects of a company. As pointed out by Jensen (1989), the private equity firm, as well as any other party that provides equity, wants to maximize the value of their investment: therefore, the returns generated by buyouts are of fundamental importance to their income and reputation. Performance can only be measured when the investment was made through an exit through IPO, trade sale or other similar forms of disposal. The increase or decrease in value, and any conclusions about the factors leading to this change must be based on measures arising from the comparison of the difference in value that occurs between the date of entry and the time of exit. This makes it possible to measure both the success of the buyout that the importance of factors that influence the degree of success. As Kaplan (1991) and Wright, Thompson, Robbie, and Wong (1995) show that there is strong evidence on the longevity of the buyout, Holthausen and Larcker (1996) point out that the evidence relating to the performance of buyouts are limited only to those whose exit has been through IPO. Wright et al. (1995) show that the size of a buyout is positively correlated to a short period of detention and to a high probability of exit. Kaplan (1991) found similar evidence, even if the results are not conclusive since his study focuses only on larger acquisitions. This suggests that the size of the buyout could be very influential in determining performance. When private equity funds invest in a number of buyouts, each of these investments will contribute to the overall performance of the fund. Because their financial sponsors want to make major investments, it could be expected a high total return, which will boost the overall performance of the private equity fund. Then, it must be considered that private equity investors often want to invest in companies that are able to provide a high income, rather than use their energies on small businesses that require significant efforts, but only marginally impact of the overall yield of their funds, even if the yield percentage of each individual investment is high. In addition, for financial investors, it can be more difficult to get investment in small businesses, either due to lack of interest by large industrial customers because it does not have a sufficient size in order to be listed on a regulated market.
3. HYPOTHESIS: RISKS AND PERILS IN LBO
TRANSACTIONS
During recent years, there has been a particularly intense debate among several authors, in order to
investigate about the objectives of LBO transactions, together with the risks and opportunities that can derive to the whole firms’ stakeholders. With regard to the economic effects of buyout transactions, the economic literature shows that such interventions, generally determine a major improvements in shareholder wealth (De Angelo, De Angelo, & Rice, 1984; Kaplan, 1989b; Lehn & Poulsen, 1989; Easterwood, Singer, Seth, & Lang, 1994, Weir & Laing, 2003; Renneboog & Simons, 2005; Renneboog et al., 2007). Very often, however, these gains to shareholders, are related to the expropriation of minority investors (Amihud, 1989) and other stakeholders (Marais, Schipper, & Smith, 1989), such as the bondholders (Travlos & Cornett, 1993; Citron, Wright, Ball, & Rippington, 2003) and employees (Shleifer & Summers, 1988; Wright, Bacon, & Amess, 2009). The changes produced in the company’s performance after the completion of these transactions have been an object of interest by a growing literature (Muscarella & Vetsuypens, 1990; Cressy et al., 2007; Cao & Lerner, 2009; Guo, Hotchkiss, & Song, 2009; Jelic & Wright, 2010). From this point of view, the results achieved from the literature, however, are discordant. In particular, with reference also to the operations of delisting that took place from 1980 to 1989, US literature on LBOs identifies improvement in the performance of the company after the completion of a buyout (Kaplan, 1989; Singh, 1990; Long & Ravenscraft, 1993; Smart & Waldfogel, 1994). On the other hand, the most recent literature, focusing on delisting made during the period 1998-2004 in the US and the UK, provides evidence more heterogeneous. In their study on the second wave of LBOs in the US, Guo, Hotchkiss, and Song (2011) find no evidence on the presence of a significant improvement in adjusted-performance after LBOs. Analyzing the market of delisting in the UK, Weir, Jones, and Wright (2009) find that the performance has deteriorated compared to pre-buyout, but private companies have performed worse than those that have been listed, and indeed, there is some evidence showing that the performance of delisted may be slightly better. The analysis of the adjusted-performance of European companies delisted shows an improvement in the situation of these companies before delisting. It was also demonstrated that the presence of a private equity operator is able to positively influence the long-term performance, especially when the target is large and has a company needs to initiate a complex process of restructuring. From this perspective, some authors evidence that a strategy of delisting, for a company that has a complex restructuring plan, it is a good way to implement the turnaround strategy more effectively and away from the public eye: this is especially important for small listed companies, that cannot afford to undertake such a journey without the support of the market (Capizzi, Caselli, Giovannini, & Pesic, 2012). Long and Ravencraft (1993) found that performance tends to be as high as smaller performances are pre-delisting, even if they do not find any evidence of this effect in the medium or long term. Guo et al. (2009) for the US and Weir, Jones, and Wright (2009) for the UK, argue that when a private equity firm is involved in an operation of PTPs, there is a deterioration of corporate performance compared to pre-buyout, but there is no evidence that these enterprises have worse performance than their counterparts listed.
4. DATASET AND EMPIRICAL MODEL
4.1. Data
Coherently with the objective of analyzing the relation existing between the buyout and the impact of these interventions on operating performance, debt, taxes, employment, dimension of the companies, a significant effort to provide a dataset that was sufficiently large, so that it was able to carry out a survey of these types of operations. To achieve these results, it was decided to focus attention on the overall deals relating to MBO and MBI transactions carried out worldwide, in order to obtain a database that could be represented in terms of dimension and significance of the phenomenon. We initially considered a sample obtained from Zephyr Database (Bureau Van Dijk Electronic Publishing), which consists of 12,098 deals that took place during the period 1997-2015. Data on economic and financial performance achieved by the enterprises before and after the transaction are obtained from the database, Orbis Database (Bureau Van Dijk Electronic Publishing), which allows us to obtain data on 6,780 companies which have been a target of LBO transactions during the period from
2002 to 2015 (we consider Zephyr and Orbis Database since they have been largely considered in economic literature, especially when dealing with other country than US, given their coverage in terms of deals and financial performance). Unfortunately, the data on economic and financial performance were not available for all the firms we considered. There are several explanations for this, including situations in which the companies have merged with other companies or where they changed the name making it impossible to find them. Through the combination of information from the two databases, it was possible to have a final sample of 2,450 deals, occurred during the period 2002-2012, for which we have been able to catch information on the economic and financial performance of the target company among a window of 5 years before and after the deal.
4.2. Empirical model
To examine the effects of LBO transactions on firms’ performance among the window of 5 years before and after the deal, we estimate the following model, for which we use 3 alternative versions with increasing complexity: ( ) ( ) ( ) ( ) ( ) ( ) ( ) ( ) ( ) ( ) ( ) ( ) ( ) ( ) (1)
The first version of the model uses the minimum number of independent variables, trying to investigate the impact on the various dependent variables thinking primarily in terms of performance generated, efficiency, debt, and taxes. The independent variables, measured from 1 to 2 years before the deal, considered in the baseline model are the following: the size of the firm (Log Turnover), the level of debt (Liability/Total Assets), the level of investments (CAPEX/Total Assets), the performance (ROA), the indicator of tax burden (Taxation/Total Assets) and finally the reverse of capitalization (Total Debt/Equity). The other two versions of the model can be considered as extensions of the basic model, which aim to investigate the impact on the various dependent variables using a larger number of independent variables. In particular, the second version of the model takes into account the type of operation carried out, considering the characteristics of the financial and legal system. The other independent variables used in this case are: the PE&VC dummy variable, the Management Buyout dummy variable, the Common Law dummy variable, the Bank-Based dummy variable. The third version of the model analyzes the impact on the dependent variables as independent variables by adding some factors that belong to the macroeconomic environment, such as the Index of protection of the rights of creditors and debtors, the Index of depth of information on credit, the coverage of private credit bureau (% adults) and the coverage of public credit bureau (% of adults).
The goal of our analysis is to determine whether, after the completion of the transactions, the economic and financial performance of companies has improved or worsened. To make the
comparison between the performance pre and post-operation, we proceed first with the calculation of some performance indicators, which are found both in the pre-deal and in the post-deal period. More specifically, for each variable of the analysis, it was decided to check for the changes occurred according to the following approaches:
a) for the short term, we calculated the difference between the value of each financial indicator between 1 year after the deal and 1 year before the deal;
b) for the short-medium term, we calculated the difference between the value of the averages, for each indicator, covering the first two years post-deal (AV+2) and the two years pre-deal (AV-2);
c) for the medium-long term, we calculated the difference between the value of the averages, for each indicator, covering the first three years post-deal (AV+3) and the three years pre-post-deal (AV-3);
d) for the long-term term, we calculated the difference between the value of the averages, for each indicator, covering the first five years post-deal (AV+5) and the five years pre-deal (AV-5).
Despite we performed our analysis over a broader sample of variables, we consider of particular interests, the following dependent variables, which we investigate through all 3 models we discussed previously:
Total Assets variation: this indicator aims to verify whether, after the completion of the transactions, there is a phase of disposal of assets not considered to be of strategic importance and therefore not part of the core business (Asset stripping hypothesis);
Numbers of Employees variation: this indicator is intended to analyze whether, after the
phase of rationalization after the implementation of the deal, the companies that were the subject have increased or decreased the number of employees (Occupation hypothesis);
Cost of Employees variation: this indicator is intended to analyze whether, after the phase of rationalization after the implementation of the deal, the companies have increased or decreased the cost of employees, as defined by the ratio of cost of employees to turnover (Occupation hypothesis);
Cash Flow variation: this indicator aims to verify whether, after the implementation of the transactions, enterprises engage in the more efficient management of cash flows (Cash flow hypothesis);
Turnover variation: this indicator aims to investigate whether, after the deal, enterprises improve their efficiency, especially in terms of managerial efficiency, cost efficiency and productivity of the workforce (Operating performance hypothesis);
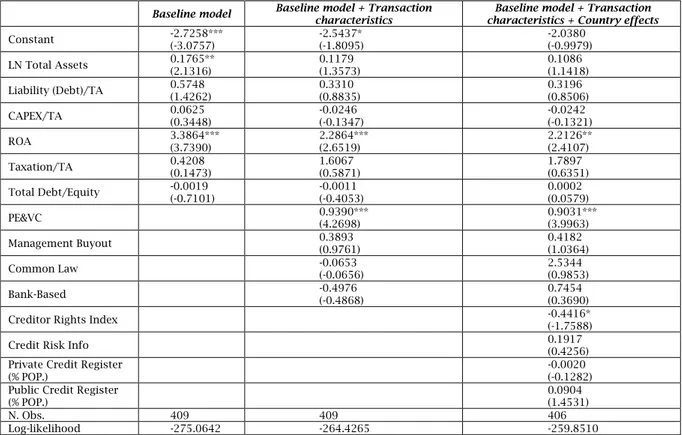
Distressed: this indicator represents a dummy variable, which assumes value 1 if the company after the deal experiments a conjunct reduction of total assets, number of employees and turnover, and 0 otherwise (Distressed hypothesis).
4.3. Description of the variables
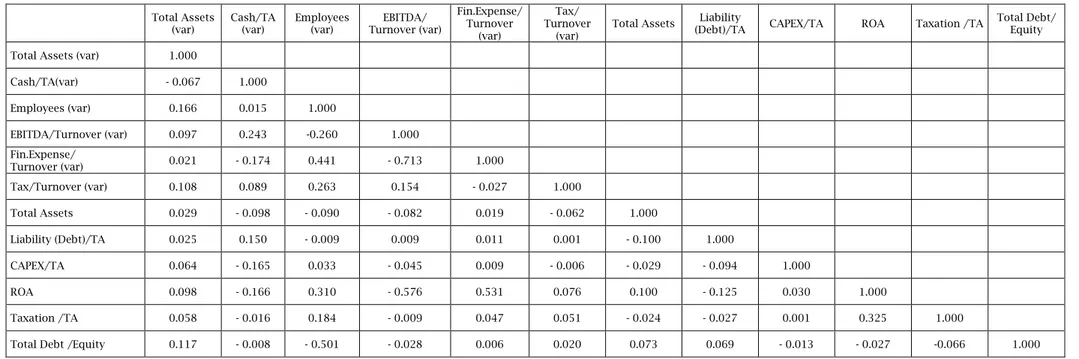
This subsection describes the variables used to measure the impact of LBOs on operating performance, debt, taxes, employment and the level of efficiency, growth in size and financial health of the companies that have been subjected. Of course, depending on the objective of the analysis, some financial variables were considered as dependent and independent variables. The financial variables used in this study were selected to reflect the traditional dimensions of performance evaluation within the limits of data availability. In an attempt to provide a complete profile of the performance achieved by the companies, we considered the following financial variables:
ROA: this indicator is calculated as the operating profit (EBIT) compared to the total assets and is an indicator of how the profitability of the company is derived from its assets. This indicator gives us an idea of how efficient is the management to use the business assets to generate profits. The higher the ROA is higher, the better because the company is generating profits with less investment.
Total Debt/Total Assets: is an indicator of financial leverage, as well as the percentage of total assets that are financed with debt. A report Total Debt/Total Assets high indicates that the company has a high level of leverage.
Debt/Equity: is an indicator of financial leverage that is often used in place of the ratio Total debt/Total assets. This indicator uses the same input but offers a different view. Generally, the higher is this ratio the more the greater the risk borne by creditors, actual and potential. This indicator allows us then to identify how you financed the buyout in terms of debt and equity.
Financial Expenses/Debt: is an indicator that stresses the impact of financial charges on total debt. The more the ratio is high and the greater the weight of financial charges on debt. Then allows us
to understand how much of the cost of the debt stems from the borrowing costs paid.
Taxes/Turnover: this indicator measures the impact of taxes, the latter by dividing the value of total sales of the company. The higher the ratio assumes a high value is the tax burden is high. This will result in consequent erosion of revenues from sales.
Financial Expenses/Turnover large sums for the financial burdens which, consequently, will lead to the erosion of revenues from sales.
CAPEX/Total Assets: The ratio reflects the efficiency of a company to employ its operational funds to maintain or increase its assets in the future. Specifically, it is a measure of the investment that the company makes for its future, in order to increase the revenue generated from sales.
In addition to the financial variables, the model also employs other variables through which it is possible to investigate which factors have had a particular impact on the financial performance post-MBO. This section provides an overview of what has been defined as “other variables”:
PE&VC: it is a binary dummy variable that has a value of one if a private equity provider is involved in the transaction, and zero otherwise. The expected coefficient is positive because of the additional expertise that the operator of PE provides to the business (Cressy et al., 2007). It is also expected that, given their financial involvement in the company, they will undertake effective monitoring (Cotter & Peck, 2001; Nikoskelainen & Wright, 2007). Analyzing this binary variable shows that the PE&VC backed deal is 1746.
Listed, Unlisted, Delisted: are binary dummy variables that take values respectively equal to one if the company is listed (listed), not listed (unlisted) or has been expelled from the market (delisted), and zero otherwise. Further analysis of these three binary variables, it appears that within the sample are 52 listed companies, unlisted companies 4864 and those subject to delisting 280.
Country Dummy: are binary dummy variables that are named after the country code of belonging to the target company. Each variable assumes the value of one if the deal is for a target company operating in the specific country identified by the variable, and zero otherwise. The three main countries in which they were made the largest number of deals in our final sample are the UK operations with 2616, followed by France with 511 and the U.S., with 509 operations.
Deal Type: is binary dummy variables that take the name of the category of "Deal Type" belongs to the operation. Each variable assumes the value of one if the deal falls under the classification of “Deal Type” that it represents, and zero otherwise.
Secondary Buyout: dummy variables are binary ranging to investigate whether or not a company has been the subject of a number of buyouts greater than one. Respectively, the first variable assumes value equal to one if the company has been the subject of a second buyout and zero otherwise, the second variable will assume a value of one if the company has been subject to the third buyout and zero otherwise, and finally, the third variable assumes value one if the company has been the subject of buyout quarter and zero otherwise. Overall, the final sample there are 95 operations
secondary buyout, 4 tertiary buyouts and only one of quarterly.
Sector: binary dummy variables are going to investigate the area of operation of the target. Each variable assumes the value of one if the target company we are considering work in the particular industry considered by the variable and zero otherwise.
Creditor Rights Index: with this variable, we measure the degree to which the law (concerning bankruptcy, collateral, etc.). Protects the rights of creditors and debtors thus facilitating the granting of credit. The index takes values from 0 to 10, with higher scores identifying legislative systems that better protect the rights and then seek to expand access to credit.
Credit Risk Info: with this variable, we measure accessibility, scope, and quality of credit information available from public and private credit registries. The index takes values from 0 to 6, with higher scores that determine the availability of more and more detailed information on credit, both from public records that private offices, in order to facilitate the decision regarding the granting of loans.
Coverage of Private Credit Bureaus (% of adults): is a variable that indicates the number of individuals and companies registered by a private credit bureau with current information on the debt has not been repaid, the outstanding loans and loans received in the past. The number is expressed as a percentage of the adult population.
Coverage of Public Records On Credit (% of adults): is a variable that indicates the number of individuals and companies registered in a public register on the credit-date information on the debt has not been repaid, the outstanding loans and loans received in the past. The number is expressed as a percentage of the adult population.
Common Law: in this context, common law is used as a binary dummy variable that assumes the value of one if the country under consideration exists a legal system of common law, zero otherwise.
Bank-Based: This term identifies the countries that have a financial system where banks hold a major role in stimulating economic growth, because providing more efficient services especially regarding the mobilization of savings and the reduction of agency problems. In this context, the based bank is used as a binary dummy variable that assumes the value of one if the country presents a value of the ratio of the bank system’s total assets to GDP which is above the mean of the sample, and zero otherwise.
5. EMPIRICAL EVIDENCE
5.1. Asset stripping hypothesis
Broadly discussing about the growth of the firms, the literature on LBOs and especially the studies carried out by Lehn and Poulsen (1989), Singh (1990), Bhagat, Shleifer, and Vishny (1990), Kaplan (1991), Easterwood and Seth (1993), Asquith, Jones,
and Kieschnick (1998) tend to highlight that there is no significant evidence of the fact that the targets of LBO transactions are able to outperform the industry average in terms of growth. Our results of the analysis are presented in Table 1.
This analysis aims to identify what are the factors that influence the growth of firms, which in this case is represented by the dependent variable, Variation of Total Assets (Logarithm). The analysis seems to confirm the asset stripping hypothesis, because of reduction of Total Assets achieved by the enterprises (negative and significant coefficient for the constant it all the regression). Despite this evidence, the analysis shows that firm size is positively influenced by the size of the original (starting) of the same, from capital expenditures and profitability, while it is negatively influenced by debt and taxes. Looking at the Total Assets, it could be seen that in all three models, the evidence highlights that the largest companies at the time “t” experience then, in all time horizons thereafter, a further increase in their size and therefore a greater growth: this is proved by the fact that the coefficients are positive and statistically significant at the 1% level. As regards the relationship CAPEX/TA, the empirical evidence tends to emphasize how companies that had the higher capital expenditures have then subsequently experienced a significant increase in their size: also this evidence, as the previous one, is particularly significant since intercepts are positive and statistically significant at the 1% level in all three models and is for all time horizons. There is also evidence of the fact that the companies that had the highest ROA have then experienced a marked increase in their size: in this case, the result is shown as particularly significant, with the coefficients positive and statistically significant at the level of 1% in all models and for all time horizons. It is also interesting to highlight the particularly important role played by the operators of PE&VC in this process: in fact, there is a positive relationship between the presence of these operators and the growth of firms, as the venture-backed companies are those in the medium and long term seem to grow more. The ratio of Liability/TA, for all models and all-time horizons, points out that companies were more indebted they then experienced slower growth than the other, since their coefficients are negative and statistically significant. Of course, this is also reflected in the relationship Taxation/TA, which is also showing the coefficients negative and statistically significant at the 1% level of significance in all models and time horizons of reference, points out that companies that have experienced a high tax burden are also improved from less. Regarding the independent variable “Management buyout”, in accordance with the claims made by Lehn and Poulsen (1989), Singh (1990), Bhagat et al. (1990), Kaplan (1991), Easterwood and Seth (1993), Asquith et al. (1998), it presents the coefficients not statistically significant and therefore there is no significant evidence of the fact that the object of LBO firms are able to outperform the industry average in terms of expansion.
Table 1. Total assets variation
Baseline model model characteristics Baseline + Transaction Baseline + Transaction + Country model characteristics effects Short term (-1, +1) Medium short term (-2, +2) Medium long term (-3, +3) Long term (-5, +5) Short term (-1, +1) Medium short term (-2, +2) Medium long term (-3, +3) Long term (-5, +5) Short term (-1, +1) Medium short term (-2, +2) Medium long term (-3, +3) Long term (-5, +5) Constant -1.1331*** (-4.8426) -1.2865*** (-5.2780) -1.2356*** (-4.7715) -1.1073*** (-3.8369) -0.7732** (-2.0040) (-2.1068) -0.8322** -0.9063** (-2.1642) -0.8912* (-1.9582) -0.1707** (-2.2529) -0.1037** (-2.1536) -0.0791* (-1.9104) -0.1245* (-1.8926) Total Assets t 0.1343*** (5.4523) 0.1556*** (6.0680) 0.1550*** (5.6940) 0.1486*** (4.9019) 0.1379*** (5.4006) 0.1578*** (5.9741) 0.1542*** (5.5099) 0.1435*** (4.6335) 0.1535*** (5.6670) 0.1692*** (6.0397) 0.1643*** (5.5329) 0.1484*** (4.5182) Liability/TA t -0.1350** (-2.5206) -0.1579** (-2.8203) -0.1719*** (-2.8889) -0.1785*** (-2.6821) -0.1404*** (-2.6112) (-2.9916) -0.1673*** -0.1822*** (-3.072) -0.1894*** (-2.8738) -0.1349*** (-2.4885) -0.1620*** (-2.8709) -0.1802*** (-3.0107) -0.1892*** (-2.8448) CAPEX/TA t 0.3329*** (4.0942) 0.3385*** (3.9884) 0.3308*** (3.6676) 0.3260*** (3.2318) 0.3225*** (3.9465) (3.7175) 0.3155*** 0.3034*** (3.3702) 0.2903*** (2.9009) 0.3234*** (3.9470) 0.3140*** (3.6853) 0.3022*** (3.3440) 0.2875*** (2.8618) ROA t 0.0647*** (5.8227) 0.0648*** (5.5791) 0.0584*** (4.7322) 0.0555*** (4.0177) 0.0638*** (5.7331) (5.4775) 0.0634*** 0.0569*** (4.6345) 0.0538*** (3.9428) 0.0624*** (5.5890) 0.0624*** (5.3610) 0.0561*** (4.5462) 0.0535*** (3.8972) Taxation/TA t -0.3530*** (-6.0265) -0.3534*** (-5.7670) -0.3198*** (-4.9109) -0.3046*** (-4.1806) -0.3484*** (-5.9368) (-5.6683) -0.3462*** -0.3121*** (-4.8183) -0.2963*** (-4.1140) -0.3410*** (-5.7867) -0.3404*** (-5.5470) -0.3076*** (-4.7258) -0.2943*** (-4.0659) Total Debt/Equity t -0.0011 (-1.1969) -0.0011 (-1.0806) -0.0009 (-0.8650) -0.0026** (-2.1853) -0.0011 (-1.1257) (-0.9327) -0.0009 -0.0007 (-0.6829) -0.0023** (-1.9682) -0.0015 (-1.5490) -0.0013 (-1.2585) -0.0010 (-0.9437) -0.0025** (-2.0273) PE&VC 0.0701 (0.8704) 0.1743** (2.0962) 0.2493*** (2.8319) (3.7675) 0.3674*** 0.0622 (0.7650) 0.1686** (2.0061) 0.2440*** (2.7412) 0.3655*** (3.7075) Management Buyout -0.0818 (-0.5962) -0.0805 (-0.5640) -0.0381 (-0.2518) (0.5740) 0.0966 -0.1084 (-0.7785) -0.1008 (-0.6955) -0.0608 (-0.3957) 0.0830 (0.4860) Common Law -0.3353 (-1.1696) -0.4522 (-1.5863) -0.3662 (-1.2114) -0.3804 (-1.1795) -0.2130 (-0.4192) -0.2482 (-0.4712) -0.1936 (-0.3464) -0.1484 (-0.2397) Bank-Based -0.3851 (-1.3627) -0.5466* (-1.9351) -0.4745 (-1.5842) (-1.6584) -0.5337* -0.3432 (-0.9046) -0.4902 (-1.2688) -0.4833 (-1.1793) -0.5649 (-1.2604) Creditor Rights Index 0.0184 (0.2690) -0.0098 (-0.1394) -0.0217 (-0.2891) -0.0562 (-0.6791) Credit Risk Info -0.2343* (-1.8811) -0.2135* (-1.6538) -0.2006 (-1.4648) -0.1881 (-1.2385) Private Credit Register
(% POP.) 0.0044 (0.8900) 0.0038 (0.7487) 0.0036 (0.6590) 0.0038 (0.6360) Public Credit Register
(% POP.) 0.0003 (0.0282) 0.0019 (0.1427) 0.0033 (0.2405) 0.0085 (0.5517) N. Obs. 572 567 555 547 572 567 555 547 572 567 555 547 Adj. R-squared 0.2818 0.2735 0.2433 0.2018 0.2807 0.2799 0.2532 0.2218 0.2801 0.2774 0.2510 0.2198
Note: The table reports the results obtained with OLS regression for the different periods considered. *, **, and *** indicate statistical significance at the 10%, 5%, and 1% levels, respectively. Adj.-R2 is adjusted R-squared.
5.2. Occupation hypothesis
LBO deals are often criticized because it is claimed that cause the loss of jobs in the years post-deal. From this perspective, the results obtained by the economic literature are very conflicting. Opler (1992) finds evidence of a slight increase in employment in the post-deal, the thesis also supported by Kaplan (1989) and Smith (1990), but when it is considered the “industry effects” in the employment level falls. Muscarella and Vestuypens (1990) show that employment increases during the execution of a reverse LBO. A large number of studies on MBO and MBI UK, for example, Wright et al. (1992), and Wright et al. (2007) show that there is an initial reduction followed by a subsequent increase in employment in the post-operation but without return to pre-LBO. The results obtained with regard to the level of occupation are presented in Table 2.
The analysis aims to identify what are the factors that influence the level of employment in enterprises, which in this case is the dependent variable Variation of Number of Employees (Logarithm). The evidence shows that the level of employment within a firm is positively influenced by the profitability, taxes and the presence of a private equity firm, and is negatively affected by debt. Looking at the relationship Liability/TA, there is significant evidence (at the significance level of 1%) in all models and time horizons considered, the fact that companies were more leveraged and have experienced a substantial reduction in the number of employees. The same information, even in a different form, is provided by the ratio of Total Debt/Equity. For this indicator, as well as the previous one, the coefficients are negative and statistically significant at the 1% level for all models and time horizons, reflecting the fact that firms that use consistently capital debt rather than equity, they tend to experience a significant reduction in the level of employment. This is because companies often heavily in debt are in trouble when they have to pay the debt and the interest, so they try to recover from this difficult situation by reducing the workforce. The ROA, however, points out, for all models and all-time horizons, that the most profitable companies then tend to experience a significant increase in the number of employees. This usually happens because companies with higher profit, are those that have higher margins and therefore can afford to hire new employees. The result is shown as particularly significant since the coefficients are positive and statistically significant at the 1% level. With regard to the relationship Taxation/TA you may notice that its coefficients are positive and statistically significant at the 1% level, but only in the medium and long term. This means that companies that at the time “t” had greater tax burden have then experienced in the medium/long term and an increase in their workforce. This can be explained mainly in light of the tax breaks that benefit companies that increase their workforce. It is also interesting to highlight the particularly important role played by the operators of PE&VC. In fact, it can be noticed that there is a positive relationship between the presence of these
operators and the number of employees of the companies, as the venture-backed companies are those in the medium and long term seem to gain most of their staff. This result is fully in agreement with the claims made by Opler (1992), Kaplan (1989) and Smith (1990), Muscarella and Vestuypens (1990). Overall, however, the effects of LBOs on employment do not show clear, it is also important to consider that often the loss of jobs can also be connected to the phenomenon of asset stripping. The results obtained with regard to the cost of occupation are presented in Table 3.
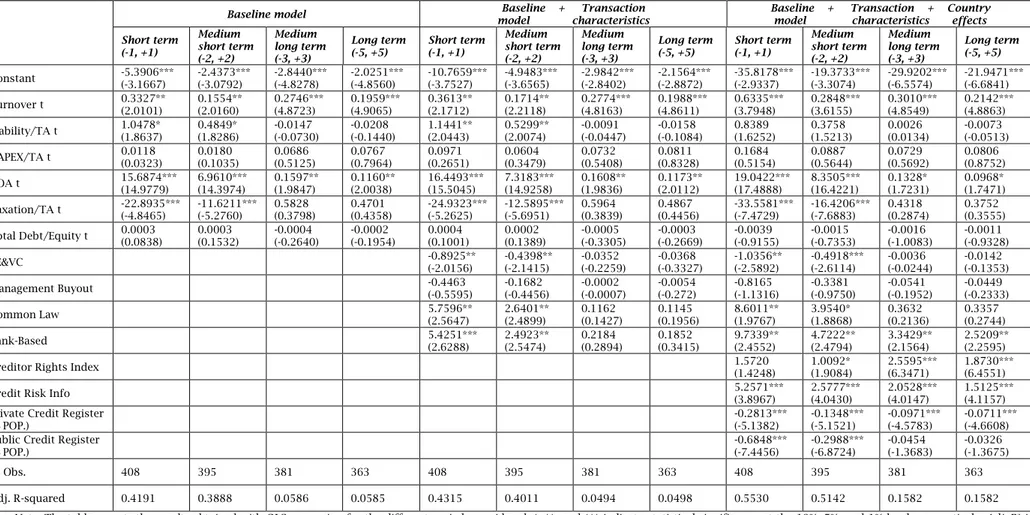
In this case, is it possible to notice a general contraction of cost of employees (negative and statistically significant constant for all the models considered), with a reduction which seems to be amplified by those firms, which were characterized by higher level of taxation before the deals, rather than for the presence of private equity investors? From this perspective, it seems to be confirmed the hypothesis about the strategy of firms involved in LBO transactions, to research for a more efficient cost structure, achieved also by the reduction of wages and salaries (Shleifer & Summers, 1988; Wright et al., 2009). Differently, for larger and more profitable firms the reduction of costs for employees seems to be less significant, probably because those firms can achieve their objectives without a reduction of wages and salaries.
5.3. Cash flow hypothesis
With regard to the ability of “cash generation” by the companies, the US literature and especially Lehn and Poulsen (1989), Singh (1990), Kieschnick (1998), Opler and Titman (1993), Halpern et al. (1999) have achieved over the years strongly conflicting evidence regarding the ability of LBO to generate returns for shareholders, especially in terms of capability of cash flow, which, according to Jensen (1986), would result from the reduction in agency costs resulting from the separation between ownership and control. Recently, the role of free cash flow has also been studied on the UK market, but with results similar to those achieved in the USA (Weir, Laing, & Wright, 2005b; Guo et al., 2011). The results we obtained are presented in Table 4.
This analysis aims to identify which factors are able to influence the generation of an accumulation of cash, which in this case is represented by the dependent variable Variation of Cash Flow. The evidence shows that the production of an accumulation of cash is positively influenced by the debt and the realization of a management buyout and the presence of a private equity firm, and is negatively influenced by the profitability of the company and taxes. Looking at the relationship Liability/TA, you may notice that in all models and time horizons of reference, there is significant evidence (at the 1% level) that the most indebted companies experience a build-up of cash and therefore a reduction in their level of efficiency. This probably occurs because most state debt requires companies the need for more resources in cash or readily convertible into cash. Even the presence of an operator of VC&PE appears to act in these terms.
Table 2. Number of employees variation
Baseline model Baseline + Transaction
model characteristics
Baseline + Transaction + Country model characteristics effects Short term (-1, +1) Medium short term (-2, +2) Medium long term (-3, +3) Long term (-5, +5) Short term (-1, +1) Medium short term (-2, +2) Medium long term (-3, +3) Long term (-5, +5) Short term (-1, +1) Medium short term (-2, +2) Medium long term (-3, +3) Long term (-5, +5) Constant -0.0478 (-0.2143) -0.1453 (-0.6333) -0.1247 (-0.5164) -0.1437 (-0.5703) -0.4126 (-1.0983) (-0.9793) -0.3801 -0.0862 (-0.2238) -0.0434 (-0.1079) -0.4468 (-0.8467) -0.4993 (-0.9136) -0.2425 (-0.4543) -0.1240 (-0.2217) Total Assets t 0.0114 (0.5084) 0.0236 (1.0115) 0.0295 (1.2077) 0.0337 (1.3242) 0.0048 (0.2081) 0.0190 (0.8050) 0.0236 (0.9621) 0.0248 (0.9729) 0.0214 (0.8250) 0.0325 (1.2227) 0.0322 (1.1704) 0.0324 (1.1418) Liability/TA t -0.1971*** (-3.5039) -0.2069*** (-3.5438) -0.2500*** (-4.087352) -0.2544*** (-3.9282) -0.1996*** (-3.5293) (-3.6371) -0.2125*** -0.2525*** (-4.1762) -0.2593*** (-4.0758) -0.1979*** (-3.4305) -0.2036*** (-3.4160) -0.2338*** (-3.7932) -0.2335*** (-3.6120) CAPEX/TA t 0.0165 (0.2904) 0.0114 (0.1935) -0.0105 (-0.1674) -0.0097 (-0.1458) 0.0107 (0.1885) (-0.0142) -0.0008 -0.0336 (-0.5424) -0.0381 (-0.5838) 0.0136 (0.2367) 0.0001 (0.0022) -0.0349 (-0.5629) -0.0406 (-0.6233) ROA t 0.7729*** (5.2083) 0.8822*** (5.8374) 0.1821*** (4.7672) 0.1513*** (3.7359) 0.7508*** (4.9408) (5.3297) 0.8223*** 0.1731*** (4.5871) 0.1407*** (3.5405) 0.7492*** (4.6516) 0.7698*** (4.7091) 0.1639*** (4.3141) 0.1296*** (3.2495) Taxation/TA t 0.4477 (0.6392) 0.6533 (0.9131) 2.1950*** (3.1929) 2.2676*** (3.1260) 0.3351 (0.4718) (0.8372) 0.6053 2.0378*** (2.9779) 2.0606*** (2.8713) 0.3289 (0.4426) 0.8195 (1.0820) 2.3098*** (3.3172) 2.4131*** (3.3154) Total Debt/Equity t -0.0045*** (-6.7191) -0.0042*** (-6.0491) -0.0041*** (-5.5983) -0.0041*** (-5.2359) -0.0045*** (-6.6465) (-5.8069) -0.0041*** -0.0039*** (-5.2972) -0.0038*** (-4.9010) -0.0048*** (-6.6299) -0.0043*** (-5.7870) -0.0041*** (-5.2052) -0.0040*** (-4.8261) PE&VC 0.0956 (1.4805) 0.1412** (2.1445) 0.2357*** (3.5029) (4.0845) 0.2877*** 0.0845 (1.2923) 0.1325** (1.9866) 0.2193*** (3.2221) 0.2693*** (3.7901) Management Buyout 0.0662 (0.5802) 0.0439 (0.3773) 0.0544 (0.4582) (0.2871) 0.0355 0.0524 (0.4513) 0.0423 (0.3569) 0.0679 (0.5645) 0.0572 (0.4583) Common Law 0.3351 (1.1520) 0.2042 (0.6773) -0.1047 (-0.3651) -0.1342 (-0.4440) 0.2290 (0.3645) 0.3765 (0.5779) -4.97E-05 (-7.65E-05) 0.2638 (0.3864) Bank-Based 0.3404 (1.1603) 0.0832 (0.2735) -0.2808 (-0.9647) (-1.1540) -0.3541 0.2843 (0.5657) 0.2491 (0.4778) -0.1868 (-0.3692) -0.0494 (-0.0929) Creditor Rights Index 0.0551 (0.9429) 0.0320 (0.5282) 0.0365 (0.5783) 0.0044 (0.0658) Credit Risk Info -0.1146 (-1.1892) -0.0999 (-1.0002) -0.0931 (-0.9845) -0.1117 (-1.0234) Private Credit Register
(% POP.) 0.0021 (0.5648) 0.0014 (0.3710) 0.0020 (0.4842) 0.0023 (0.5316) Public Credit Register
(% POP.) 0.0004 (0.0405) 0.0019 (0.1793) 0.0102 (0.9498) 0.0132 (1.1689) N. Obs. 463 454 445 431 463 454 445 431 463 454 445 431 Adj. R-squared 0.1923 0.1991 0.1681 0.1396 0.1919 0.2045 0.1916 0.1743 0.1883 0.1950 0.1872 0.1708
Note: The table reports the results obtained with OLS regression for the different periods considered. *, **, and *** indicate statistical significance at the 10%, 5%, and 1% levels, respectively. Adj.-R2 is adjusted R-squared.
Table 3. Cost of employees variation
Baseline model model characteristics Baseline + Transaction Baseline + Transaction + Country model characteristics effects Short term (-1, +1) Medium short term (-2, +2) Medium long term (-3, +3) Long term (-5, +5) Short term (-1, +1) Medium short term (-2, +2) Medium long term (-3, +3) Long term (-5, +5) Short term (-1, +1) Medium short term (-2, +2) Medium long term (-3, +3) Long term (-5, +5) Constant -5.3906*** (-3.1667) -2.4373*** (-3.0792) -2.8440*** (-4.8278) -2.0251*** (-4.8560) -10.7659*** (-3.7527) (-3.6565) -4.9483*** -2.9842*** (-2.8402) -2.1564*** (-2.8872) -35.8178*** (-2.9337) -19.3733*** (-3.3074) -29.9202*** (-6.5574) -21.9471*** (-6.6841) Turnover t 0.3327** (2.0101) 0.1554** (2.0160) 0.2746*** (4.8723) 0.1959*** (4.9065) 0.3613** (2.1712) 0.1714** (2.2118) 0.2774*** (4.8163) 0.1988*** (4.8611) 0.6335*** (3.7948) 0.2848*** (3.6155) 0.3010*** (4.8549) 0.2142*** (4.8863) Liability/TA t 1.0478* (1.8637) 0.4849* (1.8286) -0.0147 (-0.0730) -0.0208 (-0.1440) 1.1441** (2.0443) (2.0074) 0.5299** -0.0091 (-0.0447) -0.0158 (-0.1084) 0.8389 (1.6252) 0.3758 (1.5213) 0.0026 (0.0134) -0.0073 (-0.0513) CAPEX/TA t 0.0118 (0.0323) 0.0180 (0.1035) 0.0686 (0.5125) 0.0767 (0.7964) 0.0971 (0.2651) (0.3479) 0.0604 0.0732 (0.5408) 0.0811 (0.8328) 0.1684 (0.5154) 0.0887 (0.5644) 0.0729 (0.5692) 0.0806 (0.8752) ROA t 15.6874*** (14.9779) 6.9610*** (14.3974) 0.1597** (1.9847) 0.1160** (2.0038) 16.4493*** (15.5045) (14.9258) 7.3183*** 0.1608** (1.9836) 0.1173** (2.0112) 19.0422*** (17.4888) 8.3505*** (16.4221) 0.1328* (1.7231) 0.0968* (1.7471) Taxation/TA t -22.8935*** (-4.8465) -11.6211*** (-5.2760) 0.5828 (0.3798) 0.4701 (0.4358) -24.9323*** (-5.2625) (-5.6951) -12.5895*** 0.5964 (0.3839) 0.4867 (0.4456) -33.5581*** (-7.4729) -16.4206*** (-7.6883) 0.4318 (0.2874) 0.3752 (0.3555) Total Debt/Equity t 0.0003 (0.0838) 0.0003 (0.1532) -0.0004 (-0.2640) -0.0002 (-0.1954) 0.0004 (0.1001) (0.1389) 0.0002 -0.0005 (-0.3305) -0.0003 (-0.2669) -0.0039 (-0.9155) -0.0015 (-0.7353) -0.0016 (-1.0083) -0.0011 (-0.9328) PE&VC -0.8925** (-2.0156) -0.4398** (-2.1415) -0.0352 (-0.2259) (-0.3327) -0.0368 -1.0356** (-2.5892) -0.4918*** (-2.6114) -0.0036 (-0.0244) -0.0142 (-0.1353) Management Buyout -0.4463 (-0.5595) -0.1682 (-0.4456) -0.0002 (-0.0007) (-0.272) -0.0054 -0.8165 (-1.1316) -0.3381 (-0.9750) -0.0541 (-0.1952) -0.0449 (-0.2333) Common Law 5.7596** (2.5647) 2.6401** (2.4899) 0.1162 (0.1427) 0.1145 (0.1956) 8.6011** (1.9767) 3.9540* (1.8868) 0.3632 (0.2136) 0.3357 (0.2744) Bank-Based 5.4251*** (2.6288) 2.4923** (2.5474) 0.2184 (0.2894) (0.3415) 0.1852 9.7339** (2.4552) 4.7222** (2.4794) 3.3429** (2.1564) 2.5209** (2.2595) Creditor Rights Index 1.5720 (1.4248) 1.0092* (1.9084) 2.5595*** (6.3471) 1.8730*** (6.4551) Credit Risk Info 5.2571*** (3.8967) 2.5777*** (4.0430) 2.0528*** (4.0147) 1.5125*** (4.1157) Private Credit Register
(% POP.) -0.2813*** (-5.1382) -0.1348*** (-5.1521) -0.0971*** (-4.5783) -0.0711*** (-4.6608) Public Credit Register
(% POP.) -0.6848*** (-7.4456) -0.2988*** (-6.8724) -0.0454 (-1.3683) -0.0326 (-1.3675) N. Obs. 408 395 381 363 408 395 381 363 408 395 381 363 Adj. R-squared 0.4191 0.3888 0.0586 0.0585 0.4315 0.4011 0.0494 0.0498 0.5530 0.5142 0.1582 0.1582
Note: The table reports the results obtained with OLS regression for the different periods considered. *, **, and *** indicate statistical significance at the 10%, 5%, and 1% levels, respectively. Adj.-R2 is adjusted R-squared.
Table 4. Cash flow variation
Baseline model model characteristics Baseline + Transaction Baseline + Transaction + Country model characteristics effects Short term (-1, +1) Medium short term (-2, +2) Medium long term (-3, +3) Long term (-5, +5) Short term (-1, +1) Medium short term (-2, +2) Medium long term (-3, +3) Long term (-5, +5) Short term (-1, +1) Medium short term (-2, +2) Medium long term (-3, +3) Long term (-5, +5) Constant 0.0093 (0.1822) -0.0630 (-1.3545) -0.0536 (-1.1824) -0.0593 (-1.3188) -0.0260 (-0.3330) (-1.6984) -0.1203* -0.0929 (-1.3322) -0.0752 (-1.1047) 0.0729 (0.5448) -0.0857 (-0.7227) -0.0836 (-0.7147) -0.0705 (-0.6277) Turnover t -0.0050 (-0.9370) 0.0016 (0.3309) 0.0004 (0.0890) 0.0005 (0.1090) -0.0080 (-1.4509) -0.0016 (-0.3217) -0.0022 (-0.4593) -0.0018 (-0.3780) -0.0073 (-1.2322) -0.0018 (-0.3334) -0.0030 (-0.5657) -0.0025 (-0.4835) Liability/TA t 0.0260** (2.4221) 0.0403*** (4.0619) 0.0440*** (4.4965) 0.0477*** (4.8979) 0.0263** (2.4522) (4.1140) 0.0407*** 0.0445*** (4.5470) 0.0481*** (4.9295) 0.0270** (2.4858) 0.0414*** (4.1341) 0.0452*** (4.5692) 0.0489*** (4.9576) CAPEX/TA t -0.0205 (-1.2867) -0.0205 (-1.3897) -0.0200 (-1.3759) -0.0198 (-1.3651) -0.0215 (-1.3428) (-1.4711) -0.0217 -0.0203 (-1.3910) -0.0201 (-1.3804) -0.0219 (-1.3579) -0.0223 (-1.5055) -0.0210 (-1.4299) -0.0208 (-1.4177) ROA t -0.0290*** (-3.0525) -0.0307*** (-3.4894) -0.0232*** (-2.6730) -0.0181** (-2.0893) -0.0292*** (-3.0667) (-3.5407) -0.0311*** -0.0232*** (-2.6695) -0.0180** (-2.0823) -0.0294*** (-3.0699) -0.0312*** (-3.5259) -0.0232*** (-2.6536) -0.0181** (-2.0766) Taxation/TA t -0.2227* (-1.9408) -0.1876* (-1.7718) -0.1534 (-1.4714) -0.1768* (-1.7022) -0.2445** (-2.1148) (-2.0596) -0.2188** -0.1723 (-1.6403) -0.1895** (-1.8088) -0.2388** (-2.0360) -0.2123** (-1.9698) -0.1651 (-1.5504) -0.1809* (-1.7025) Total Debt/Equity t 4.53E-05 (0.2423) 4.81E-05 (0.2797) 6.64E-05 (0.3925) 8.39E-05 (0.4979) 2.64E-05 (0.1407) (0.2466) 4.24E-05 5.17E-05 (0.3041) 6.64E-05 (0.3921) -9.09E-06 (-0.0460) 3.36E-05 (1.1864) 5.76E-05 (0.3231) 6.98E-05 (0.3923) PE&VC 0.0260 (1.5473) 0.0331** (2.1986) 0.0205 (1.3850) (1.1262) 0.0165 0.0259 (1.5170) 0.0332** (2.1754) 0.0210 (1.4044) 0.0172 (1.1572) Management Buyout 0.0474* (1.6793) 0.0595** (2.3128) 0.0476* (1.8879) (1.5752) 0.0396 0.0490* (1.7042) 0.0607** (2.3136) 0.0495* (1.9288) 0.0421 (1.6437) Common Law 0.0059 (0.1046) 0.0169 (0.3424) 0.0091 (1.1864) -0.0085 (-0.1811) 0.0353 (0.3553) 0.0731 (0.8005) 0.0707 (0.7822) 0.0413 (0.4598) Bank-Based 0.0386 (0.6991) 0.0417 (0.8516) 0.0373 (0.7697) (0.4414) 0.0206 0.0323 (0.4351) 0.0636 (0.9484) 0.0691 (1.0410) 0.0490 (0.7531) Creditor Rights Index -0.0038 (-0.2838) -0.0063 (-0.5103) -0.0077 (-0.6322) -0.0059 (-0.4923) Credit Risk Info -0.0165 (-0.6716) 0.0039 (0.1729) 0.0124 (0.5585) 0.0095 (0.4307) Private Credit Register
(% POP.) -4.26E-05 (-0.4409) -0.0006 (-0.7172) -0.0008 (-0.9076) -0.0006 (-0.6968) Public Credit Register
(% POP.) 0.0004 (0.1463) -0.0005 (-0.2111) -0.0009 (-0.3857) -0.0008 (-0.3812) N. Obs. 538 533 524 495 538 533 524 495 538 533 524 495 Adj. R-squared 0.3600 0.3904 0.2612 0.1535 0.3668 0.4055 0.3528 0.2450 0.4430 0.4988 0.2666 0.1615
Note: The table reports the results obtained with OLS regression for the different periods considered. *, **, and *** indicate statistical significance at the 10%, 5%, and 1% levels, respectively. Adj.-R2 is adjusted R-squared.
In fact, the second and the third model of the analysis show that in the short/medium term the presence of such operators tends to generate an accumulation of cash for PE&VC backed firms. In this sense, then there is a little evidence (the significance level is 10%) of the fact that the actions of management buyouts also push in this direction, allowing, especially in the short and medium-term, to increase cash flow. In fact, the intercept is shown as a positive and statistically significant in the short and medium-term, both for the second and for the third model, while in the long term is not significant. Therefore, there is evidence that the companies subject to an MBO tend to experience an accumulation of cash, but only in the short and medium-term. We can interpret this result by saying that the MBO does not produce any permanent effect, so that, in agreement with the view taken by Mehran and Peristiani (2010), one can only partially support the free cash flow hypothesis. The ROA instead highlights, for all models and all-time horizons, that the most profitable subsequently experience a marked decrease in cash & cash equivalent. The result is shown as particularly significant since the coefficients are negative and statistically significant at the 1% level. Nevertheless, the result is highly unexpected, since it is not easy to understand how the most profitable can then experience a reduction of their cash on hand. This phenomenon, however, may be seen from another point of view. In reality, the availability of cash may be considered either as the generation of cash flow or in terms of retention of cash (cash accumulation). In this case, the most profitable are those that are more efficient and thus might be in a possibility to drain liquidity, a situation that seems to have been less strong in those imprinted with a heavy debt, which as we have seen, is able to mitigate this phenomenon. Finally, looking at the relationship Taxation/TA, it is possible to notice that the coefficients are negative and statistically significant in all models, especially in the short and long term, reflecting the fact that the companies subject to greater tax burden have also drained liquidity excess creating a “cash spooling”. This led them to rationalize the availability of cash & cash equivalents, allowing them to increase their level of efficiency.
5.4. Operating performance hypothesis
With regard to the economic/financial performance of the deal, US literature on LBO and especially Kaplan (1989), Singh (1990), Smart and Waldfogel (1994) tend to highlight, for companies that have been subject to LBO, an improvement in operating performance in the post-buyout. However, these studies were carried out during the first wave of LBOs, which occurred in 1980 at a time when it was particularly easy to find companies that were undervalued. This, of course, made it even more likely that he could be an improvement in operating performance in the post-buyout. In fact, the analysis carried out by Guo et al. (2011) on the second wave of LBO can not show any improvement in industry
adjusted performance after the buyout. There is then further research, carried out by Long and Ravenscraft (1993), Guo et al. (2011), Weir et al. (2009) that put instead emphasize improvements in adjusted performance post-LBO, especially in the short and medium-term. The results obtained among that issue are presented in Table 5.
The analysis aims to identify what are the factors that affect the operating performance of firms, which in this case is represented by the dependent variable Variation of Turnover. The evidence shows that economic performance is positively affected by taxes, the profitability original starting business (long-term), the creation of a management buyout from the fact that the country has a legal system of type “common law” and the fact that the financial system is of type “bank-based”, while it is negatively influenced by the debt from the original departure profitability of enterprise (short-term), the index of the depth of credit information and the degree of coverage of public records on credit. Especially the latter two, are used as control variables, in order to avoid the main criticism that is moved to these models, namely that suffer from an error distortion arising from omitted variables. Looking at the relationship Liability/TA, it is possible to notice that in all models and time horizons of reference, there is significant evidence (at the 1% level) that the most indebted companies then experience a decrease in their performance. The ROA provides evidence very interesting highlights how companies that at the time “t” had a high level of profitability then tend to begin to experience a significant reduction in the short term (at the level of 1%) of their profitability and then show a substantial increase in the long term (at 1%) and thus a return to profitability. This recovery occurs in all three models in the long run as if it was necessary for businesses time to recover their profitability. This is because the operation lever beginning stifles operations (and profitability) and only in the long term allows companies to recover their stability. The increase in profitability occurs especially if the operation is a buyout, in accordance therefore with the theories of Long and Ravenscraft (1993), Guo et al. (2009), Weir et al. (2009), if the company is operating in a common law country and if the financial system is bank-based. Indeed, the coefficients for these variables are positive and statistically significant, thus attesting to the existence of a positive relationship of the variables with the profitability of the undertaking. But we must consider that there are also control variables which act negatively as the index of depth of credit information, rather than the degree of coverage of the public registers on credit: in this case the coefficients are negative and statistically significant, thus attesting to the existence of a negative relationship of the variables with profitability. From this perspective, the evidence shows that firms operating in a macroeconomic environment of high index of depth of credit information and a high degree of coverage of public records on credit have seen, in the medium and long term, contract their profitability.