1
Università degli Studi di Ferrara
DOTTORATO DI RICERCA IN
Scienze della Terra
CICLO XXVII
COORDINATORE Prof. Massimo Coltorti
Sediment transport and morphodynamics of mixed
beaches: case studies of two Mediterranean sites
Settore Scientifico Disciplinare GEO/04
Dottorando Tutore
Dott. Grottoli Edoardo Prof. Ciavola Paolo
2
Table of contents
1. INTRODUCTION ... 5
1.1 Motivation ... 6
1.2 State of the arts on mixed beaches ... 7
1.2.1 - Classifications and reviews ... 7
1.2.2 - Sediment transport ... 14
1.2.3 - Influence of sediment characteristics on transport... 15
2. STUDY AREAS ...17
2.1 - Portonovo beach ... 18
2.2 - Marina di Pisa beach ... 21
3. MATERIALS AND METHODS...24
3.1 - Radio tracers: RFID technology ... 25
3.2 - Experiment set up ... 27
3.2.1 - Portonovo experiments ... 28
3.2.2 - Marina di Pisa experiment... 34
3.3 - Surface samplings and grain size analyses ... 36
3.4 - Topographic surveys ... 38
3.5 - Volume variation estimation ... 40
3.6 - Shoreline variation estimation ... 40
3.7 - Storm events identification... 41
3.8 - Analysis of tracer characteristics... 41
3.8.1 - Statistical analysis ... 41
3
4. PEBBLE TRANSPORT: DISPLACEMENTS ON THE SHORT AND LONG TERM .44
4.1 - Portonovo beach ... 45
4.1.1 - Short term tracer recovery ... 45
4.1.2 - Long term tracer recovery ... 51
4.2 - Marina di Pisa beach ... 55
4.2.1 - Short term tracer recovery ... 55
4.3 - Discussion ... 59
5. PEBBLE TRANSPORT IN THE SHORT TERM: INFLUENCE OF SIZE AND SHAPE OF PARTICLES (PORTONOVO BEACH) ...69
5.1 - The role of size ... 70
5.1.1 - Displacement and recovery of pebbles based on their size ... 70
5.1.2 - Statistical analyses ... 72
5.1.3 - Threshold of tracer motion ... 74
5.2 - The role of shape ... 75
5.2.1 - Displacement and recovery of pebbles based on their shape. ... 75
5.2.2 - Statistical analyses ... 77
5.3 - The combinational role of size and shape ... 79
5.3.1 - Displacement of pebbles based on the combinational effect of size and shape ... 79
5.4 - Statistical analyses ... 81
5.5 - Discussion ... 83
6. BEACH EVOLUTION (PORTONOVO BEACH) ...89
6.1 - Topographic variation ... 90
6.2 - Shoreline variation ... 108
6.3 - Volumetric variation ... 121
6.4 - Discussion ... 122
7. SURFACE SEDIMENT VARIABILITY (PORTONOVO BEACH) ... 127
4
7.2 - Analysis of sediment parameters: dispersion maps ... 130
7.2.1 - Mean diameter (Mz) variability ... 130
7.2.2 - Sorting (σ1) variability ... 130
7.2.3 - Skewness (Sk) variability ... 131
7.3 - Discussion ... 135
8. CONSIDERATIONS ON FILL MATERIAL CHARACTERISTICS FOR NOURISHMENT PURPOSES ... 141
8.1 - Italian and worldwide overview on gravel nourishment projects... 142
8.2 - Which fill material? ... 143
8.2.1 - Recommendations on fill material for the case studies. ... 147
9. CONCLUSIONS ... 150 REFERENCES...154 LIST OF FIGURES...169 LIST OF TABLES...178 APPENDIX A...181 APPENDIX B...183 APPENDIX C...186 ACKNOWLEDGEMENTS...198
5
6
1.1 Motivation
The main intent of this work is to improve the knowledge on sediment transport of mixed beaches with particular focus on the coarse fraction. Given the lack of information and foremost the actual quality level of in-depth analyses on coarse and mixed beaches, especially in comparison to what is already known about the sandy equivalent, several hypotheses were assumed to be demonstrated from field data acquirement. First of all, the knowledge improvement of pebble transport in microtidal beaches during low-energy conditions and in short periods of time. The investigation was possible by means of radio tracer technique (RFID Radio Frequency Identification). The remarkable asset of the technique is to univocally gather displacement information for each single pebble, allowing to compare direct field measurements with existing models of sediment transport, usually based on indirect measures and in need of statistical treatment to decrease as much as possible an error which is nevertheless irremovable. Pebble transport was investigated during short fair-weather spans of time (6 and 24 h after the tracer injection) and also monitored in the long term (months to 1 year). It is clear that different factors exert control on beach dynamic during severe storm events rather than under low energy conditions. In the latter case it is likewise spontaneous to generate assumptions to be tested, such as if any selective transport of pebbles, based on their size and shape, is possible, or which hydrodynamic factor is the most decisive to destabilize the sediment particle at equilibrium; keeping in mind that the swash zone is certainly the most active part of a mixed beach and several factors affect its dynamic. All the previous purposes had to be supported by a strong substrate of morphodynamics concepts, suited on the basis of constant field data gathering. The classical morphodynamics study approach of beach is to consider here as sustain of the sediment transport findings and useful to observe the actual response of a replenished beach. Nourishment practices are increasingly chosen by local policies to improve beach stability in critical areas, even on mixed beaches, but there is still a relative lack of information regarding the post-replenishment behaviour of these beaches, never forgetting that a knowledge refinement, on which refill material is the best fitting for specific replenished areas, is also needed.
7
1.2 State of the arts on mixed beaches
1.2.1 - Classifications and reviews
Since mixed and coarse grained beaches have been studied, many authors have basically focused on the field description of morphological features and sediment arrangements. On the basis of these evident characteristics some scientists tried to conceive classification schemes with the justifiable aim to suite them for all cases. Despite a substantial improvement has been around the first decade of this millennium, a classification perfectly suitable for any beach is yet to be established. When the first peak of interest on gravel beaches emerged around 1960s, Bluck (1967) proposed a qualitative model based on field observations of six beaches of South Wales. He described the surface sediment stretching these beaches, distinguishing among four particle cross-shore zones on the basis of their shapes. According to Bluck (1967) two types of gravel beaches are assumed: the Sker type, and the Newton type, on the basis of erosional or accretionary structures created by the wave reworking. Both these two typology has the same particles zones (“landward large disc zone”, “imbricate zone”, “infill zone”, “outer frame”) which basically vary for a different sequential arrangement (Figure 1-1). The two facies types (Sker and Newton) reflect respectively a high and a lower energy environment (Mason and Coates, 2001). As stated by Orford (1975) they are not exclusive of a specific beach, but mostly representative of the ambient energy conditions.
8
Figure 1-1. A) Construction cycle of a “Sker” type beach and B) a “Newton” type beach (Bluck, 1967).
Bluck (1967) realised a detailed description of the internal structures of a gravel beach, lately improved in his recent work with other case studies (Bluck, 2011), always ascribing a prominent role to the particle shape in the construction phase of a gravel beach. The Bluck’s works took place on beaches affected by an important tidal range that, joined to the wave action, obviously lead to a more complex selection of beach material, as also confirmed by Mason and Coates (2001). A more comprehensive classification of mixed and coarse-grained beaches was ratified by Jennings and Shulmeister (2002). The authors proposed a classification scheme which still represents the only one that is suitable for most of the worldwide coarse grained and mixed beaches. Three different types of beaches are conceived: pure gravel beach, mixed sand and gravel beach (MSG), and composite beach. The pure gravel beach has a completely gravelly profile with minor berms and a strong sediment sorting. The main grain size range from -2 to -6 phi. These characteristics make the profile linear with highly steep beachface (tan β values between 0.1 and 0.25, and a mean beachface slope of 0.18; Table 1-1; Figure 1-2). Previous researchers described pure gravel beaches, giving information mainly based on field observations. According to Carter and Orford (1993) pure gravel beaches are highly reflective at all stages of the tidal cycle. Surf zone processes are absent and edge wave development control the morphodynamics regime, with associated cuspate morphology (Sherman et al., 1993).
9
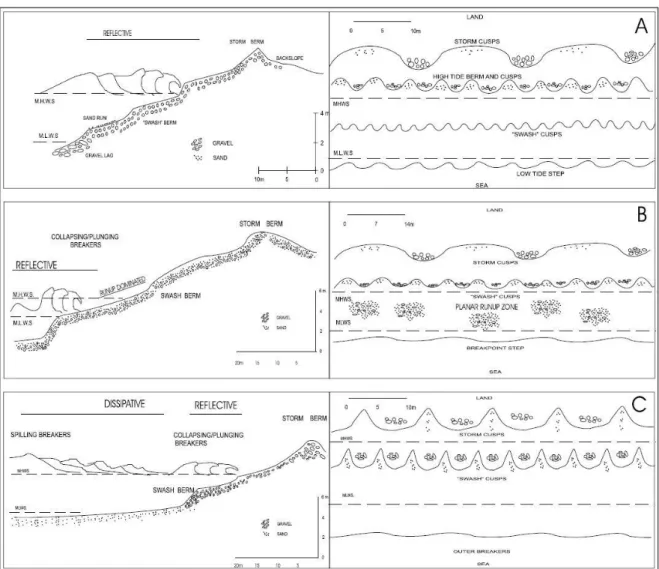
Cusps can be either accretionary or erosional in these kinds of beaches (Sunamura and Aoki, 2000). Surging and collapsing waves dominate under all conditions but during storm events (Jennings and Shulmeister, 2002). The mixed sand and gravel beach (MSG) is whereas characterised by a complete intermixing of sandy and gravelly sediments (Kirk, 1980; Jennings and Shulmeister, 2002). Grain size varies from coarse sand to pebble (0.5 to -6 phi). Beach slope varies from 0.04 to 0.12 values and well developed step represents the main break point of the profile slope. Beach cusps are frequent and often well-formed on more than one tier (Jennings and Shulmeister, 2002). During fair-weather periods, swash processes control the hydrodynamic regime; consequently the swash zone is the most dynamic part of the beach relative to sediment transport (Kirk, 1980). Plunging and collapsing waves are typical of these kind of beaches (Figure 1-2), while little is known, according to Jennings and Shulmeister (2002), about their behaviour under severe storms conditions. The composite gravel beach occurs when hydraulic sorting is able to clearly separate the beach profile in two distinct parts: one seaward, sand dominated, with lower gradient (tan β = 0.03-0.1); the other landward, gravel dominated, with an higher tan β value between 0.1 and 0.15 (Jennings and Shulmeister, 2002). Given these characteristics, spilling waves will form with a dissipative surf zone at low tide and a long-shore bar-trough system may develop (Figure 1-2).
10
Table 1-1. Morphological parameters of studied beaches by Jennings and Shulmeister (2002).
The lack of classification scheme was partially camouflaged by some remarkable paper reviews. Kirk (1980) was the first author who tempts to offer a comprehensive scientific point of view of the state of the arts at that time, collecting works of different nature dealing with mixed and gravel beaches. He presented and discussed several aspects and distinctive characteristics relating to processes, sediments and morphology of mixed beaches basing on New Zealand beach study. Kirk’s work was essentially the first morphodynamic study of mixed beaches which could include all the crucial features of those environments (i.e. sediment characteristics, wave parameters, profile evolution, sediment transport and sediment variations both along and cross-shore). He also determined an ideal visual scheme of a mixed beach (Figure 1-3), based on field observations of New Zealand beaches that can be generally believed valid elsewhere.
11
Figure 1-2. Schematic representation of the three types of beaches proposed by Jennings and Shulmeister (2002): A) pure gravel beach, B) mixed sand and gravel beach (MSG), C) composite beach.
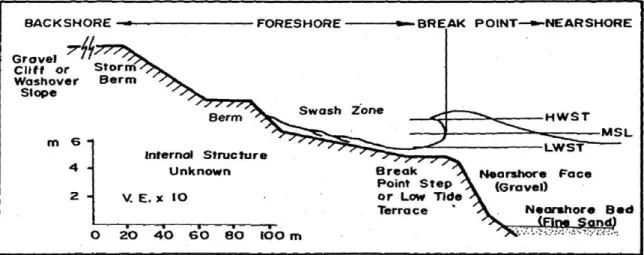
According to Kirk (1980), mixed beaches are typically narrow, steep between 5 and 12° and broadly convex in profile shape. Four elements are shown in Figure 1-3 and can normally be identified on a mixed beach: a backshore zone landward the highest run up limit of storm swash; a steep foreshore extending from the topmost berm (or cliff base) to the wave break point; a lower foreshore marked by a distinct break point step or low tide terrace; a clear slope change, seaward of the breaker zone, between a steep gravel nearshore and a gently sloping and sandy inner shelf surface. Two decades later, Mason and Coates (2001) resumed the Kirk’s work giving a long range review on processes affecting mixed beaches. They distinguished in a first and second order factors influencing sediment transport on these environments.
12
Figure 1-3. Typical morphology and zonation of mixed sand and gravel beach profiles according to Kirk (1980).
Among the first order factors the authors cited several components such as: hydraulic conductivity, groundwater infiltration, wave reflection and threshold of motion. A less crucial role seems to have sediment shape, tidal range, specific gravity, armouring phenomena and chemical processes. If one can agree with what the authors considered more important on controlling beach processes, it must be said that all the secondary factors were, and still are, poorly analysed and inadequately understood. Only few works have been focalised on those “second order” aspects of mixed beach morphodynamics. Mason and Coates gave also a fairly complete archive of the most relevant works of those years based on field experiments (Caldwell and Williams, 1985; Brampton and Motyka, 1987; Hill, 1990; Bujalesky and Gonzalez-Bonorino, 1991; Walker at al., 1991; McKay and Terich, 1992; Nordstrom and Jackson, 1993) or dealing with the development of beach model from laboratory tests (Petrov, 1989; Quick and Dyksterhuis, 1994; Holmes et al., 1996). In the recent years, Buscombe and Masselink (2006) were the last scientists that felt to draft a review paper on mixed and gravel beaches. Their intent was to review all the short-term processes that affect beach foreshore and beachface, highlighting the key aspects for future research. “Morpho-sedimentary-dynamics” (MSD), was the new coined term by Carter and Orford (1993), later deeply discussed and refined by Masselink and Puleo (2006) and by Buscombe and Masselink (2006). The term wants to focus the reciprocal relationship between the morphology evolution, the sediment transport and the hydraulic properties on a mixed or gravel beach. These three aspects should be present in every future research, representing the minimum number of parameters to understand in order to adequately describe the state of a beach. According to the authors, spatial heterogeneity of sediment properties (grain size and shape in particular) is both an
13
expression and a control on gravel beach morphodynamics. The paper of Buscombe and Masselink (2006) contains a comprehensive review of the most recent works dealing with hydrodynamics factors, sediment transport (sorting and grading of sediments, longshore and cross-shore transport, transport modes) and morphological features (step, cusps, storm beach, foreshore dynamics). The concept of “Morpho-sedimentary-dynamics” (MSD) is shown in Figure 1-4, where the interactions between and within the surf zone and the swash zone morphodynamic system are represented. A morpho-sedimentary-dynamics (MSD) approach treats sediments, and the spatial variation of sediment characteristics, not as a boundary condition but as a fundamental and integral aspect which permeates through morphodynamics, which may act as both an expression and control on gravel beach behaviour (Buscombe and Masselink, 2006).
Figure 1-4. Conceptual morpho-sedimentary-dynamics diagram for gravel beachface. This diagram was already drafted by Masselink and Puleo (2006) and later modified by Buscombe and Masselink (2006) in the current form. The diagram illustrates interactions between and within the surf zone and the swash zone morphodynamic system.
As regularly happens when it is attempted to study natural processes, the more it is tried to define precise theoretical classes, the more is easy to find cases in between. Any beach classification or conventional scheme, as far as simple, is not perfectly suitable for each case of study: it is common to recognize distinctive characteristics in theory assumed for specific beach categories also for different ones, or observe beach behaviours which are not strictly fitted in one single typology.
14
1.2.2 - Sediment transport
Sediment transport along ocean shorelines is a foremost aspect in the morphological evolution of coastal environments, the factors responsible for sediment displacement driving the morphodynamics of a given beach between erosion and accretion in the process of achieving some form of equilibrium. Understanding the principles of beach morphodynamics and following the pathways of sediment movement have been major objectives of beach studies over past decades (e.g., Komar and Inman, 1970; McCave, 1978; Wright et al., 1985; Salomons and Mook, 1987; Ciavola et al., 1997, 1998; White, 1998; Short, 1999; Benavente et al., 2005; Silva et al., 2007; Poizot et al., 2013; Sancho-García et al., 2013). Although more attention has generally been given to sandy beaches, mainly because it is easier to carry out field experiments on sand-sized sediments rather than gravel-sized ones (Buscombe and Masselink 2006), a renewed interest in the investigation of coarse-clastic beaches can be observed in recent years (e.g., Allan et al. 2006; Curtiss et al. 2009; Bertoni et al. 2010; Miller et al. 2011; Curoy 2012). The understanding of sediment transport in coastal environments has in recent years improved mostly because of novel technical solutions that solved many of the logistical problems encountered previously. For instance, the possibility of tracking individual pebbles by means of the RFID (Radio Frequency IDentification) technique provided a major boost toward the unravelling of coarse sediment displacement mechanisms (Allan et al. 2006; Bertoni et al. 2010). In addition, the use of gravel and pebble nourishment as a form of coastal protection has progressively increased because they are more resistant to wave scour than are sandy beaches (Masselink and Hughes 2003). Improving the knowledge of sediment transport in mixed beaches is therefore of particular importance, especially in the swash zone where the magnitude of transportation is likely to be more significant rather than on sand beaches (Van Wellen et al., 1999a; 2000). In the past, most work dealing with coarse sediment transport on beaches was carried out in high-energy environments (e.g., Bluck 1967; Ibbeken and Schleyer 1991; Deguchi et al. 1998; Packham et al. 2001; Buscombe and Masselink 2006; Curoy 2012). A few studies dealing with low-energy coarse-clastic beaches mainly concentrated on their response to episodic storms or the aftermath of high-energy events (e.g., Bertoni et al. 2010, 2012a; Bertoni and Sarti 2011; Ellis and Cappietti 2013).
15
1.2.3 - Influence of sediment characteristics on transport
Several hydrodynamic factors exert significant control on sediment transport for gravel and mixed sand-gravel beaches, and these factors are still poorly understood. As already cited in the paragraph 1.1, some comprehensive review of these forces was made in the recent past (Kirk, 1980; Mason and Coates, 2001; Buscombe and Masselink, 2006), but finding clear correlations between sediment characteristics and hydrodynamic agents still represents a hard challenge, especially in the swash zone. A conceptual model of sediment transport on a gravel beach was proposed by Carter and Orford (1991): they listed a series of probabilistic opportunities (Figure 1-5) in which an incoming clast may face on the active zone of a gravel beach (within a finite time period), including incorporation, washover or projectile rejection, acceptance, attrition or breakage, abandonment, or gravity-assisted loss offshore.
Figure 1-5. Conceptual model of the probabilistic nature of a sediment grain transport on a gravel beach (Carter and Orford, 1993, after Carter and Orford, 1991).
Gravel is not only larger, but usually varies over several orders of magnitude greater than beach sands (Buscombe and Masselink, 2006) and this characteristic creates extremely evident texture variations on coarse clastic beach surfaces, which cyclically raises the interest of researchers. After the early papers which mainly focused on the description of particle characteristics (Wentworth, 1922b, 1923; Zingg, 1935), a first peak of interest on the relationship between hydrodynamics factors and sediment characteristics came through around the 1970s and 1980s (Bluck, 1967; Carr, 1969; McLean and Kirk, 1969; Carr et al., 1970; McLean, 1970; Carr, 1971; Gleason and Hardcastle, 1973; Orford, 1975; Kirk,
16
1980; Caldwell, 1981; Williams and Caldwell, 1988; Isla, 1993; Isla and Bujalesky, 1993), a further renewed interest in sediment transport based on different coarse particle characteristics formed during the first decade of this millennium (Buscombe and Masselink, 2006; Ciavola and Castiglione, 2009; Bluck, 2011; Bertoni et al., 2012a). Textural mosaics of different clast shapes and sizes are common and different cross-shore size-shape zonations and modes of transport were demonstrated by many authors (Bluck, 1967; Orford, 1975; Williams and Caldwell, 1988; Isla, 1993; Ciavola and Castiglione, 2009; Hayes et al., 2010; Bluck, 2011), although the relative importance of size and shape in sorting is yet to be resolved (Buscombe and Masselink, 2006). Orford (1975) noted that the roles of size and shape cannot be easily separated; using both factors is therefore well-advised to establish the degree of pebble zonation on a beach. Williams and Caldwell (1988) proposed a model wherein the influence of particle size is more important on the sorting of sediments when energy conditions are high, while particle shape predominates when energy conditions are low and cross-shore sediment transport prevails. Because most of the cited papers were undertaken on meso- or macro-tidal beaches, except for Ciavola and Castiglione (2009), whose dataset provided insights on a micro-tidal beach, the aim of this work would theorise further ideas on this type of beach by attempting to discriminate whether shape and size affect pebble displacements in the swash zone differently under low-energy conditions. Furthermore, thanks to the RFID technology that enables the unambiguous identification of pebbles, it is possible to describe the movement of each individual particle according to its characteristics such as shape and size. This tracing technique, according to Van Wellen et al. (2000), is currently best suitable to obtain short-term transport rates on coarse-grained beaches.
17
18
2.1 - Portonovo beach
Portonovo is a town located on the northern edge of the Conero Headland in the central sector of the Adriatic Sea; the study mixed beach is located on the eastern side of the town (Figure 2-1). The beach is approximately 500 m long and 20 to 50 m wide and is bounded by two boulder armours built between 1940s and 1960s to protect historical buildings (Regione Marche, 2005). The beach is approximately NW-SE oriented. The southern portion of the beach is wider and slightly embayed, whereas the northern part is narrower and straight. In the central zone of the area the backshore is limited by a seawall parallel to the shoreline, while the northern part is limited by a small cliff. The beach was formed by a prehistoric landslide from the north-eastern slope of Conero Headland (Coccioni et al., 1997). Cliff erosion is the only sediment source as there is no river input and the beach sediments consist of marls and limestones. In 2010, a replenishment made of alluvial material, compatible with the original sediment, was carried out by local authorities: pebbles and cobbles (4-100 mm in diameter) of limestone were injected to contain beach erosion. The total amount of infill material deployed on Portonovo beaches between 2006 and 2011 was approximately 18500 m3: most of the part was unloaded on the western side of the village (personal communication by officers of the Regione Marche). The exact quantity released in 2010 in the study site is unknown. The beach sediment grain size varies from medium sand to cobble with a prevalent gravel fraction mainly formed by pebbles. The beach looks extremely heterogeneous regarding the surface sediment grain size: sand and scattered gravel accumulations cover the backshore, with barely continuous stripes of different grain size parallel to the shoreline, already noted by many authors in local beaches (Van Straaten, 1965; Pigorini, 1968; Van Straaten, 1970; Brambati et al., 1973; Brambati et al., 1983; Curzi, 1986; Curzi and Tomadin, 1987). In Portonovo stripes of different grain size are mainly given by normal and stormy wave action and visually highlighted by long storm berms. The gravel fraction usually occupies the swash zone, with granules and fine pebbles normally found on the berm and in the swash zone and cobbles and boulders usually found on the step zone. The beachface typically slopes 0.2, whereas the seabed seaward of the step is approximately 0.01, as normally known for the Adriatic seabed. According to the Jennings and Shulmeister (2002) classification, Portonovo is a mixed sand and gravel beach (MSG) where a complete intermixing of sandy and gravelly sediments occurs (Figure 2-2), and results as a reflective beach for the Wright and Short (1984) classification of beaches. In this part of the coast, the littoral drift, influenced by “Levante” (E) and “Scirocco” (SE) winds, is directed northwards (Colantoni
19
et al., 2003; Regione Marche, 2005), but this has no effect on the beach sediment transport because of its longshore boundaries. The tide regime in the Adriatic Sea is semidiurnal and the average tidal range at spring tide in Ancona area is 0.47 m, with a maximum record of 0.58 m (Colantoni et al., 2003). The typical wave directions recorded by the Ancona offshore wave buoy of ISPRA (ISPRA - Servizio Mareografico “Rete Ondametrica Nazionale”, Bencivenga et. al., 2012) in the period 1999–2006 are from SE (20%) and NE (16%) (Figure 2-3), which correspond to the typical storm directions (“Scirocco” wind from SE and “Bora” wind from NNE) for the Adriatic Sea.
20
Figure 2-2. Overall view of the beach during the first (A) and the second experiment (B).
Figure 2-3. Multiyear wave climate for Portonovo (recording period from 1999 to 2006). Wave data recorded by ISPRA buoy of Ancona (ISPRA - Servizio Mareografico “Rete Ondametrica Nazionale”).
21
2.2 - Marina di Pisa beach
The mixed beach chosen on the western side of the Italian coast is located in Marina di Pisa, a small town stretching on the left side of the Arno River, only 11 Km southwest of the city of Pisa (Figure 2-4). The beach is named Barbarossa, is 180 m long and 15-30 m wide and is approximately oriented N-S (Figure 2-4; Figure 2-5). The width variation is due to the presence of some structures that were built on the backshore. Moreover, the beach is bounded on both sides by groins that prevent coarse sediments from leaving the system (Bertoni and Sarti, 2011) and a seawall, made of large boulders, separates the backshore from the littoral promenade (Figure 2-4). Barbarossa is an artificially replenished beach built in 2008 within a large protection scheme conceived by local authorities to prevent the town littoral zone from erosion and boost the local business. The native sandy beach profile was covered by marble pebbles and cobbles 60–100 mm in diameter derived from quarry waste (Figure 2-5). The replenishment pebbles mainly occupy the backshore and the step area, rather the swash zone is normally comprised of finer sediment (medium to coarse pebbles). The step base is still made of pebbles but here occurs the sediment transition to the typical and native grain size which is medium to fine sand (Bertoni et al., 2012a). The beachface has a steep slope of 0.17, whereas the sandy seabed seaward of the step is flat sloping 0.01, which is a typical value for this part of the Ligurian Sea and the rest of the region (Cipriani et al., 2001, Bertoni et al., 2012a).
22 Figure 2-4. Marina di Pisa study area.
Figure 2-5. Overall look of Barbarossa beach during the experiment. View towards N (A) and towards S (B).
23
Barbarossa beach can be classified as reflective in accordance with the classification by Wright and Short (1984) and it can be defined as a composite gravel beach according to the classification of Jennings and Shulmeister (2002). The littoral drift along this sector of the coast is southward-trending (Cipriani et al. 2001; Pranzini, 2004; Bertoni and Sarti 2011) but this does not affect the sediment dynamics in the Barbarossa sector because of its longshore boundaries. The tide regime is semidiurnal and the maximum tidal range measured at spring tide at Livorno station is 0.38 m (Nordstrom et al., 2008). The waves most frequently approach the coastline from the southwest (Cipriani et al., 2001), and the major storms are commonly driven by south-westerly winds (Libeccio wind) as also measured between 1989 and 2007 by the wave buoy deployed by ISPRA (ISPRA - Servizio Mareografico “Rete Ondametrica Nazionale”, Bencivenga et al., 2012) off La Spezia (Figure 2-4,Figure 2-6).
Figure 2-6. Multiyear wave climate for Marina di Pisa (recording period from 1989 to 2007). Wave data recorded by ISPRA buoy of La Spezia (ISPRA - Servizio Mareografico “Rete Ondametrica Nazionale”).
24
25
3.1 - Radio tracers: RFID technology
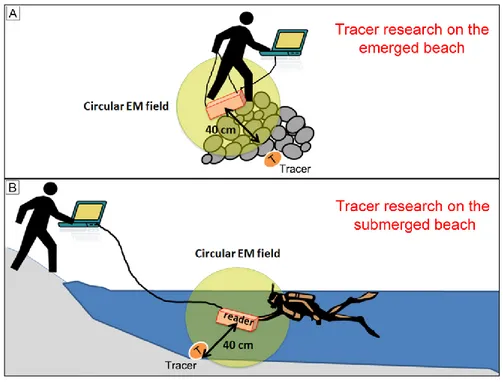
The pebble displacement was investigated by means of RFID technology. RFID technology is one of the most widely used automatic identification techniques and the term RFID stands for Radio Frequency IDentification. Basically, an RFID system consists of two components: the transponder (or tag), which is the effective identification device positioned on the item to be identified (Figure 3-1), and the reader (or radio signal antenna), which generates the interrogating electromagnetic field that performs the location and identification operations (Benelli et al., 2012, Figure 3-3). Each tag has an alphanumeric code that is required to unequivocally identify the item (the pebble in our case) to which is coupled. The antenna is connected to a laptop (Figure 3-2), where the tag code is shown once a tracer is detected; in addition, an acoustic signal is emitted by the RFID reader coupled with a light signal as additional warning signs of pebble detection. In order to track the pebbles underwater low frequency (125 kHz) passive transponders were used. Benelli et al. 2011 made also some tests using high frequency (13.56 MHz) transponders but the signal attenuation due to the water was too high, with a substantial decrease of the reading range. RFID technology was initially designed for subaerial pebble tracking (Allan et al. 2006, Figure 3-2) and recently improved to work in the underwater environment (Bertoni et al. 2010, Figure 3-2 B) by embedding the reader inside a waterproof plastic box (Figure 3-3 A). The electro-magnetic field generated by the antenna has a spherical shape with a 40 cm radius, which represents the maximum detection range possible (Figure 3-2). In order to prevent shorter displacements wrongly caused by the RFID antenna detection range, tracer displacements were considered significant if greater than 0.5 m in XY. The tracers were prepared by drilling each pebble to create a hole suitable to accommodate the tag (Figure 3-1 C); the hole was sealed with a waterproof resin. The tagged pebbles were randomly collected from the beach surface (backshore and beachface), the only limitation being the size, which needed to be coarse enough to be drilled. In our three experiments we used cylinder glass tags of different sizes (Figure 3-1 A, B).
26
Figure 3-1. A) Cylinder tags adopted to track pebbles; B) samples of drilled pebbles; C) drilling operations by means of the vertical driller; D) Pebbles sealed and painted: the reds are disc shaped, the blue are sphere shaped. These two categories were used in the second experiment in Portonovo.
27
Figure 3-3. A) Reader and batteries: two plexiglass sheets render the reader waterproof ; B) Reader set up on a plastic sledge to easily drag it on the emerged beach ; C) dragging operations on a steep beachface; D) Trailing the reader on the beach surface by means of sledge.
3.2 - Experiment set up
Three radio tracer experiments were carried out to investigate the short term displacement of pebbles in the two beaches. Two experiments were realized in Portonovo beach and one in the Barbarossa sector of Marina di Pisa. All the experiments followed the same injection scheme which involved the deployment of tracers along cross-shore transects in the swash zone. The marked pebbles were released on three critical profile locations: on the fair-weather berm, in the swash zone mid-point, and on the step crest; following the morphological terminology of Bauer and Allen (1995). The pebbles were not just dropped on the beach surface at the three injection points, but were carefully positioned in a stable
28
position amid the ambient sediment, in order to facilitate a movement as natural as possible. The recovery campaigns were performed 6 and 24 h after the injection, covering both the subaerial and underwater portions of the beaches. Tracer dispersion was studied adopting the spatial integration method (SIM), method already tested on beaches by many authors (Komar and Inman, 1970; Bray et al., 1996; VanWellen et al., 1999a; Lee et al., 2000; Ciavola, 2004). The pebble displacements were measured by means of an RTK-DGPS (Trimble R6, instrument accuracy approximately ±2 cm). In Portonovo a continuative research of marked pebbles was constantly carried out over one year time span to monitor the long term displacement of tracers.
3.2.1 - Portonovo experiments
Two tracer experiments involved the same beach sector at Portonovo beach (Figure 2-1). The marked pebbles were deployed in the swash zone along 29 cross-shore transects (Figure 3-7 A) and recovered 6 and 24 hours after the injection. During both experiments, the wave characteristics were recorded by means of an InterOcean S4 directional wave gauge (Figure 3-4; Figure 2-2). The device was deployed on the bed seaward of the beachface (-1.5 m below the Mean Sea Level) to keep it underwater for the entire acquisition time (Figure 3-4; Figure 3-7 A; Figure 2-2 A). Two time series of 20 min per hour were provided, measuring the water level and wave parameters at a frequency of 2 Hz. The device was operative through the entire experiment duration.
The first tracer experiment was carried out in the early spring of 2012. The pebbles were sampled on March 17th, two weeks before the experiment: no significant topographic modifications occurred on the beach (Figure 3-5). At 10:00 am on March 29th, 145 marked pebbles were injected in the swash zone according to the following order for each transect: one tracer was deployed on the fair weather berm crest; two tracers at the swash zone mid-point; and two tracers on the step crest (Figure 3-7 A, B). Five marked pebbles were injected along each profile without taking their size or shape into account (Figure 3-7 B). Because no sediment tracer tests had ever been performed up to that date at the Portonovo beach, two marked pebbles were injected in the swash zone and on the step crest along the transects, in order to check the consistency of the resulting displacement trends.
29 Figure 3-4. InterOcean S4 directional wave gauge.
At the time of the injection, the tracers released on the fair-weather berm (75 mm) and in the swash zone (73 mm) were characterized by average mean diameters that were not equivalent to those of the beach sediments (6 and 9 mm, respectively, Table 3-1). Beach sediment (65 mm) and tracer (79 mm) grain sizes were similar in the step area (Table 3-1). Information on the beach sediments was obtained from surface sampling carried out the day before the experiment.
The second tracer experiment was realised in mid-spring of 2013. The pebbles were sampled on March 22nd, one month before the experiment: no significant topographic modifications occurred on the beach (Figure 3-5). At 10:00 am on April 23rd, 116 tagged pebbles were deployed on every profile following the scheme: one pebble on the fair weather berm crest; two tracers at the swash zone mid-point; and one pebble on the step crest (Figure 3-7 B). No tracer subdivision in terms of shape was conducted at the injection; they were only sorted by the grain size. The mean diameter considered for tracer size subdivision was the b-axis, obtained from sieving at 0.5 phi. Three classes of size were considered: the "Small" class, characterised by a mean diameter with values between -4.5 and -5 phi (coarse pebbles according to the Udden-Wentworth grain size scale, 24 to 32 mm); the "Medium" class, characterised by a mean diameter with values between 5 and -5.5 phi (very coarse pebble according to the Udden-Wentworth grain size scale, 32 to 48 mm); and the "Big" size, characterised by a mean diameter with values between 5.5 and -6.5 phi (very coarse pebble and small cobbles according to the Udden-Wentworth grain size scale, 48 to 96 mm). One "Small" pebble was injected on the fair weather berm crest, one "Small" tracer and one "Medium" tracer were released on the swash zone mid-point, and one "Big" marked pebble was placed on the step crest (Figure 3-7 C). Four marked
30
pebbles were deployed on each profile (Figure 3-7 C). This type of injection scheme was conceived to understand whether a selective transport, based on the different size of the tracers, operates under low energy conditions. Due to the frequent variation of the sediment grain size in the swash zone, two different pebble sizes were released at its mid-point (“Small” and “Medium” classes) to better represent the most typical grain sizes. The tracers deployed on the step were compatible with the sediment normally present on that portion of the beach; pebbles slightly coarser than those characterising the natural sediment berm were injected on the fair-weather berm (Table 3-1). Because of the logistic limitations of the drilling operation, a mean diameter between -4.5 and -5 phi was the smallest size that could be drilled. Information on the beach sediments was obtained from surface sampling carried out the day before the experiment. A tracer distribution based on shape and size is shown in Figure 3-6 for both experiments.
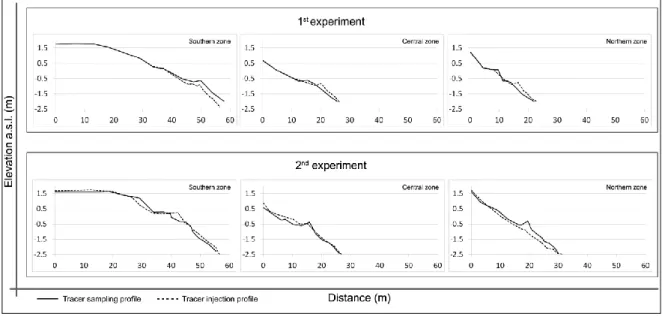
Figure 3-5. Beach profile comparison between the tracer sampling and the tracer injection for both the experiments.
31 Morphological
feature
Marked pebbles (size mm) Beach sediments (size mm) 1st experiment 2nd experiment 1st experiment 2nd experiment
Berm 75 30 6 13
Swash 73 37 9 18
Step 79 71 65 -
Table 3-1. Mean diameter comparison between the natural beach sediment and the marked pebbles. The average values showed are in mm for each morphological feature. No step crest samples were collected during the second experiment.
32
Figure 3-7. Experiment setup at Portonovo beach. A) S4 device and injection positions of tracers over an elevation surface for both experiments. Tracer injection scheme of the first (B) and second experiment (C).
33
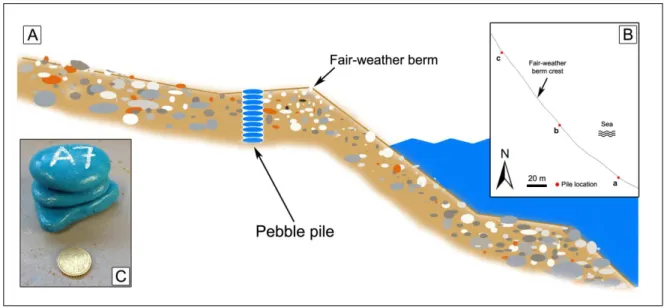
During the second experiment a evaluation of the mixing depth was carried out. Three piles of 15 painted pebbles were inserted at the back side of the fair-weather berm in order to appreciate the layer of sediments interested by wave reworking after one day (Figure 3-8 A). Piles were located at three different sites along the beach: southern edge, mid sector and northern edge (Figure 3-8 B). Disc shaped pebbles were chosen in order to build a more stable pile; they were painted in blue and enumerated from 1 to 15 for each pile (the 15th pebble at the pile bottom, the 1st at the top, Figure 3-8 C). The resulting height was reckoned adding the c axis of each pebble which was previously measured with a caliper.
Figure 3-8. Scheme of the mixing depth evaluation conceived during the second experiment (A). Pebble pile locations in three significant beach points (B). Painted pebbles of disc shape used for the mixing depth evaluation (C).
34
3.2.2 - Marina di Pisa experiment
The marked pebbles were placed on the Barbarossa beach on 15 September 2011 along 26 cross-shore transects approximately spaced 7 m. One tracer was deployed on the fair-weather berm, one on the swash zone mid-point and one on the step crest (Figure 3-9 B), for a total of 78 pebbles. The number of tracer used is less then that released in Portonovo because Barbarossa beach is shorter and a few radio tracer experiments were previously performed (Bertoni et al., 2012a, 2012b, 2013). The wave climate at Marina di Pisa was recorded twice per hour by a wave buoy of the Tuscany Hydrorgraphic Office located 40 km offshore (43°34.2′N, 09°57.4′E), comprising significant height, period, and direction. The water level was measured by the ISPRA (ISPRA - Servizio Mareografico “Rete Mareografica Nazionale”) tide gauge located at Livorno, 12 km south of Marina di Pisa (Figure 2-4). The dimensions of marked pebbles injected in the swash zone mid-point were quite different from those of the beach sediments present at the time of the injection (Table 3-2). By contrast, the tracers released on the fair-weather berm (82 mm) and on the step (86 mm) were homogeneous with the beach sediments at those locations (75 and 80 mm, respectively, Table 3-2). The beach sediment values are derived from samplings realised two years before in Bertoni’s experiments.
Marked pebbles Beach sediments
Fair-weather berm 82 75
Swash 86 35
Step 86 80
Table 3-2. Mean diameter comparison between the natural beach sediment and the marked pebbles. The averaged values are in mm for each morphological feature.
35
Figure 3-9. Experiment set up at Marina di Pisa. A) Injection positions of tracers over an elevation surface for the experiment at Marina di Pisa, Barbarossa sector.; B) reference profile at Barbarossa beach at the time of the injection.
36
3.3 - Surface samplings and grain size analyses
Six surface sediment samplings were performed at Portonovo (Figure 3-10 B) beach at 3 to 4 cross-shore locations along 14 transects (Figure 3-10 A, C). Locations were selected on the basis of morphological features observed on the first sampling (Figure 3-10 A, C): the fair-weather berm crest, the back of the fair-weather berm, the storm berm crest and the backshore (Figure 3-10 C). The sample number varied from 3 to 4 on each profile depending on the presence of the storm berm. From March 2012 and April 2013, 306 samples were collected in six times (March 2012, April 2012; May 2012; October 2012; December 2012; April 2013), 51 samples were gathered at each sampling campaign performing the same sampling grid. The methodology allowed to monitor the surface sediment variability of the beach within one year span time.
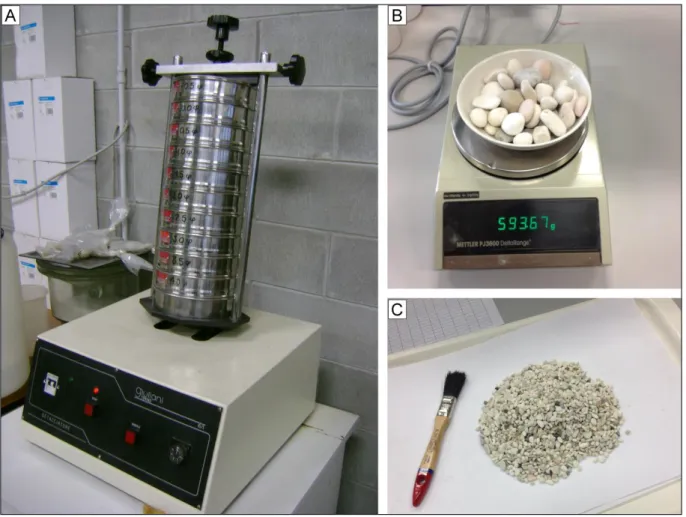
Grain size analyses were performed by dry sieving using sieves of 1phi interval. The sediments were dried in an electric oven at 105 C° and the mechanical sieve shaker (Figure 3-11 A) was set to 15 minutes shaking for each sample. Every sieve was empted (Figure 3-10 C) and then weighed by means of a precision scale (Figure 3-10 B). Grain size parameters (mean diameter, sorting, skewness, kurtosis) were calculated following the formulae proposed by the graphical method by Folk and Ward (1957) and obtained by means of software Gradistat (Blott and Pye, 2001). Beach sediments were classified according to the Udden-Wentworth granulometric scale (Udden, 1914; Wentworth, 1922a; later modified adding the phi scale by Krumbein, 1934).
37
Figure 3-10. A) Sample locations of 14 cross-shore transects on topographic surface; B) Sampling area; C) Surface sampling scheme held in Portonovo and based on the morphologies found on the first sampling campaign.
38
Figure 3-11. A) Mechanical sieve shaker; B) precision scale; C) example of granule content from a sieve.
3.4 - Topographic surveys
The beach morphology was monitored measuring cross-shore transects by means of an RTK-DGPS (Trimble R6, instrument accuracy is approximately ±2 cm). The monitoring of beach topography was constantly (monthly to seasonally) realised only on Portonovo beach where the profile spacing is approximately 10 m for a total number of 50 profiles. After an initial monitoring that covered just the experiment and sampling area which consists of 29 profiles (Figure 3-12; Figure 3-10 A, B; Figure 2-1), from May 2012 the beach surveys covered the entire beach length (approximately 500m, Figure 2-1). Thirteen topographic surveys were measured from March 2012 to February 2014 (March 2012, April 2012, May 2012, October 2012a, October 2012b, November 2012, December 2012, January 2013, February 2013, March 2013, April 2013, May 2013, February 2013) covering a whole period of almost two years (see also Appendix A). Five profiles will be
39
selected and discussed in Chapter 6 to appreciate variation of beach topography during the study period (Figure 3-12).
Figure 3-12. Profile locations on Portonovo beach. Topographic network repeated during each survey from May 2012 to February 2014. In bold are indicated the reference profiles shown and discussed in Chapter 6.
40
3.5 - Volume variation estimation
Volumetric changes observed during the topographic surveys were calculated by means of the ArcGIS tool 3D Analyst. In order to exclude bad interpolated areas, a polygon mask was created for each survey based on the measured points. Then it was chosen to compute the volume from above -1.4 m, which represented the lowest elevation reached during topographic surveys and at least reached during every survey. The tool finally calculated the volume comprised between -1.4 m and the beach surface for each survey.
3.6 - Shoreline variation estimation
Shoreline changes occurred during the topographic monitoring were computed by means of the ArcGIS extension DSAS 4.2 (Digital Shoreline Analysis System) created by Thieler et al. (2009). Shoreline design from GPS survey was possible using query expressions in ArcGIS in order to select measured elevation values within ±0.2 m. Elevation measured by GPS is referred to the mean sea level position. Thirteen shorelines were digitized based on topographic surveys realised throughout the two years of measurements. Three different statistical methods were used to calculate shoreline changes by mean of DSAS 4.2: Shoreline Change Envelope (SCE), End Point Rate (EPR) and Net Shoreline Movement (NSM). The Shoreline Change Envelope (SCE) returns the distance between the farthest and the closest shoreline. The End Point Rate (EPR) returns a rate of erosion or accretion between the oldest and the most recent shoreline. The Net Shoreline Movement (NSM) reports the distance between the youngest and the oldest shoreline. NSM was computed both for the whole period of two years and for the time passed from each survey to another. SCE and EPR were only calculated for the entire monitoring time of two years, from spring 2012 to spring 2014. DSAS tool requires a number of cross-sections to be set on the GUI; to be consistent with the topographic network measured with the GPS a total of 50 transects were specified before the computation.
41
3.7 - Storm events identification
The results reported in the next chapters which deal with long term variations of sediment transport, beach topography, shoreline rotation or surface patterns variability of sediment observed in Portonovo (Chapters 5, 6, 7) will be discussed considering their relationship with the wave conditions experienced through the whole period of study (see also Appendix B). The offshore wave data were kindly provided by the ISPRA (ISPRA - Servizio Mareografico “Rete Ondametrica Nazionale”, Bencivenga et. al., 2012) and refer to the buoy located 28 km offshore Ancona. Storm events were identified following the method described by Armaroli et al. (2012). The method considers a significant wave height greater than 1.5 m which lasted for at least 6 consecutive hours. According to Armaroli et al. (2012) two storms are considered separate if the significant wave height decays below that threshold for 3 or more consecutive hours. For each storm was also calculated the severity class following the scale of Mendoza et al. (2011) which is based on the storm energy definition of Dolan and Davis (1992). The authors define the storm energy as the square of the significant wave height observed during the storm event:
3.8 - Analysis of tracer characteristics
3.8.1 - Statistical analysis
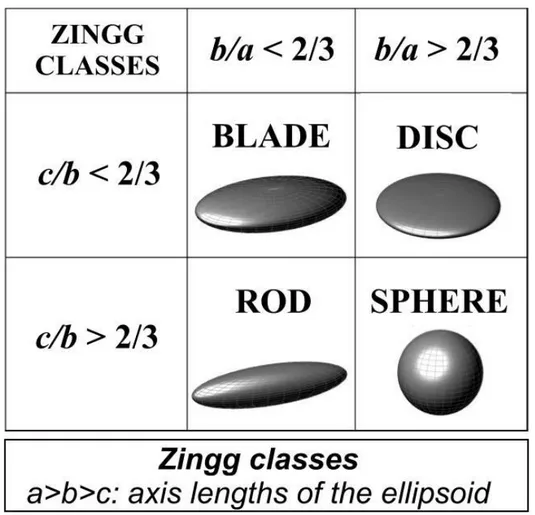
Statistical analysis was performed by means of T-tests and box plots on both the pebble shape and size of tracers which were used in the Portonovo experiments. Box plots were used to describe the distributions of the pebble displacements according to shape and size separately and also to their combinational effect. The recovery distributions after 6 and 24 hours were compared for each experiment. The size classes were divided according to the scheme used for the second experiment injection (Paragraph 3.2.1, Figure 3-7 C). The shape categories were established according to the Zingg diagram (Zingg, 1935, Figure 3-13). Each shape type was represented in the population used for the first experiment. Rods and blades were subordinate to discs and spheres in terms of appearance. Due to their small quantity, the rods and blades were incorporated with the discs to compare elongated
42
shapes with spheres. In the second experiment, all the tracers belonged to the sphere and disc shapes. Whether a differential displacement was statistically significant between the different shape and size classes of marked sediments (0.05 significance level) T-tests were performed. Because no size discrimination was adopted on the marked pebbles of the first experiment (they all belong to the "Big" class, which ranges from -5.5 phi to -6.5 phi, Paragraph 3.2.1, Figure 3-7 B), only the second experiment size data have been used for the T-tests. T-tests were not used to analyse the combinational effect of shape and size given the scarce quantity of data that would have resulted from an additional partition that takes into account both characteristics.
Figure 3-13. Shape categories of pebbles according to Zingg (1935). Shape classes are based on different ratios of axis lengths.
43
3.9.2 - Threshold of tracer motion
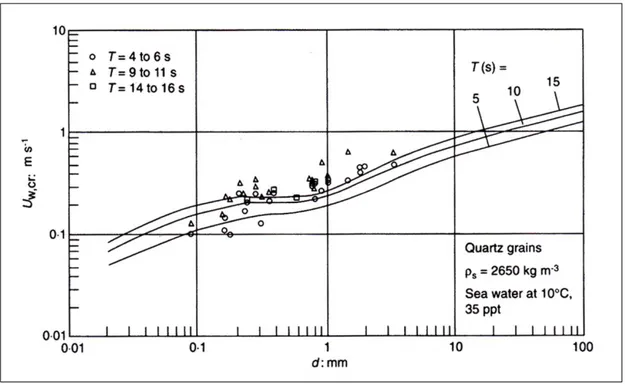
Estimations of the threshold wave orbital velocity for motion of pebble were computed and compared with the tracer displacements that were actually measured during both experiments. S4 data have been used to determine the threshold orbital velocity which was obtained using the graphical method of Soulsby (1997), shown in Figure 3-14.
44
4. Pebble transport:
displacements on the short
and long term
This chapter is part of the published paper: Bertoni, D., Grottoli, E., Ciavola, P., Sarti, G., Benelli, G., Pozzebon, A., 2013. On the displacement of marked pebbles on two coarse-clastic beaches during short fair-weather periods (Marina di Pisa and Portonovo, Italy). GeoMarine Letters, 33, 463-476.
45
4.1 - Portonovo beach
4.1.1 - Short term tracer recovery
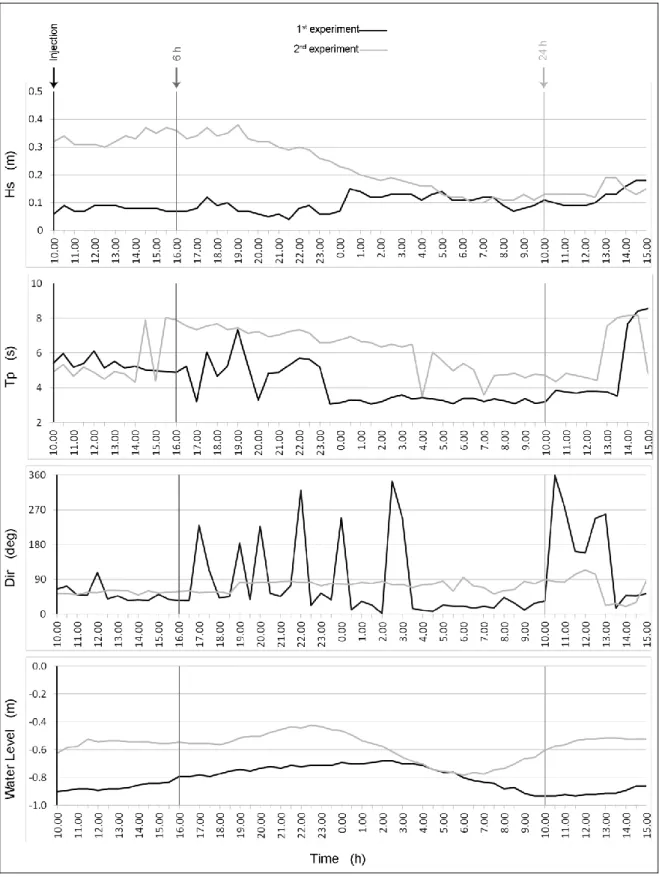
In the first experiment (spring 2012) at Portonovo beach there was virtually no wave action during the two test days. The average wave height was barely 0.1 m (max value 0.15 m), and an averaged peak wave period of 4.3 s within the experiment duration. Plunging breakers were observed during the experiment. The wave direction was strongly variable: no dominant direction was recognisable even though the most frequent direction was NE (Figure 4-1). Tracer recovery after 6 hours was 99%, which slightly decreased to 93% after 24 hours (Figure 4-1). Only a few tracers moved more than 0.5 m (17% of the whole, Figure 4-1) after the first recovery, with a maximum displacement of 2.6 m. Only 1% of the detected pebbles shifted over a different morphological feature. After 24 hours, 39% of the recovered tracers moved more than 0.5 m and the maximum measured displacement was 20 m. The amount of tracers which moved to a different morphological feature increased at 17% after 24 hours. Basically, most of the tracers were dragged down the beach face, moving from the fair weather berm to the swash or the step zone (Figure 4-2 b; Figure 4-3; Figure 5-4 B). The swash zone at Portonovo beach represented the area characterized by the highest transport rate: 36% of the tracers released on the swash zone moved over 0.5 m just 6 h after the injection (Table 4-1). The highest rate among the three injection locations at Portonovo beach after 24 h was observed on the fair-weather berm where 76% of the pebbles showed displacement distances of over 0.5 m (Table 4-1). The step crest was the area least affected by transport processes: no pebbles were lost during the entire experiment and only 10% moved over 0.5 m (Table 4-1). In all cases, the preferential direction of movement was cross-shore and offshore (Figure 4-3): 14 marked pebbles moved toward the beach step already 6 h after the injection, as opposed to six showing an onshore pattern. After 24 h the difference was sharper, as only two tracers were transported onshore and 33 offshore. Longshore displacement was very low during the first 6 h (four pebbles), but increased to 21 tracers after 24 h. After the first recovery campaign (6 h), the pebbles initially released on the swash zone shifted preferentially downslope (Figure 4-3; Figure 4-2 b). After 24 h the tracer transport rate also increased at the other injection sites, i.e., the step and the fair-weather berm (Figure 4-3; Figure 4-2 c). The step crest turned out to be the area least affected by wave action: every tracer injected at the step was detected even after 24 h. The longshore component was barely active at Portonovo during the first hours of the experiment, as no tracers moved alongshore for
46
more than 3 m and just one for 2 m. The number of pebbles that shifted alongshore increased during the next hours: 11 tracers showed a southward-trending displacement of more than 3 m, and nine over 5 m (Figure 4-3). However, the cross-shore transport component was prevalent to the longshore component, given that the majority of pebbles injected on the fair-weather berm crest felt down the swash zone (Figure 4-3; Figure 4-2; Figure 5-4 B). No differences in transport trend were noted at the sites where two marked pebbles were injected simultaneously, both tracers undergoing similar displacement.
In the second experiment (spring 2013) at Portonovo beach the energy conditions were higher compared to those of the first one. An average wave height of 0.25 m (max value 0.38 m) with an averaged peak wave period of 6 s was measured throughout the experiment. The significant wave height hovered at approximately 0.3 and 0.4 m during the first ten hours. The wave direction was basically stable within the ENE sector with a strong predominance from E, which lasted 18 hours (Figure 4-1). Pebble recovery was 34% after 6 hours and increased to 47% after 24 hours (Table 4-1). These lower percentages, compared to the first experiment, are connected to longer paths travelled by the tracers: the maximum displacements measured after 6 and 24 hours were, respectively, 52 and 54 m. After the first recovery, 90% of the detected pebbles exceeded the displacement threshold of 0.5 m (31% of the injected pebbles, Table 4-1), which reached 89% after 24 hours (44% of the injected pebbles, Table 4-1). The percentage of shifting to a different morphological feature was 38% after 6 hours and 49% after 24 hours. The tracers did not show any peculiar trend in terms of direction after 6 hours (Figure 5-4 C). A prevalent movement direction stands out after 24 hours: pebbles released at the swash zone’s mid-point essentially split towards the up-slope and down-slope locations (Figure 5-4 D). All the pebbles moved from south to north, with shorter displacements in the southern part of the beach and greater displacements in the northern sector (Figure 5-4 C, D).
In both Portonovo experiments, even though a main trend was recognisable after one day, not every part of the beach showed the same displacement patterns among the pebbles. The southern part of the beach, where the swash zone is steep and narrow, seems to be distinguished by shorter pebble displacements compared to the northern section. The latter is more exposed to wave action and looks like a "transfer zone", where a wider and milder sloping swash zone creates a more comfortable space for pebble transportation.
47
Portonovo (1st experiment) Portonovo (2nd experiment)
Recovery rate Tracers moved (> 0.5 m)
Recovery rate Tracers moved (> 0.5 m) Injection position 6h 24h 6h 24h 6h 24h 6h 24h Fair-weather berm 97% 83% 14% 76% 41% 41% 38% 38% Swash zone 100% 91% 36% 50% 28% 48% 28% 48% Step 100% 100% 0% 10% 41% 59% 31% 41% Total 99% 93% 17% 39% 34% 47% 31% 44%
Table 4-1. Recovery percentages of tracers after the first (6 h) and the second (24 h) survey for both experiments at Portonovo beach. Percentages are expressed according to the injection position of tracers. Only displacements greater than 0.5 m were retained significant given the RFID antenna accuracy of about 40 cm. The last row shows the total recovery percentages without considering the injection position of tracers.
48
Figure 4-1. Wave climate during both the Portonovo experiments recorded by the S4 directional wave gauge.
49
Figure 4-2. Tracer displacement within the time frame of the 1st experiment at Portonovo beach: a) injection position of each marked pebble; b) position of each detected pebble 6 h after the injection; c) position of each detected pebble 24 h after the injection.
50
Figure 4-3. Diagrams showing cross-shore versus longshore transport for the experiment at Portonovo.
The mixing depth evaluation carried out during the second experiment gave the following results. After one day two of the three blue pebble piles were completely dismantled. As showed in Table 4-2, only the “a” pile was not entirely wiped out because the 15th pebble, initially placed at the pile bottom, was recovered in situ even after 24 hours. Therefore, a mixing depth of at least 30 cm was observed for the central and the northern sectors of the beach, whereas a slightly lower layer of sediments was reworked at the southern edge of the beach (about 25 cm, Table 4-2).
Pile height (cm)
Mixing depth (cm) Injection 24 hours
Pile a 26.15 1.5 24.65
Pile b 28.95 0 28.95 (at least)
Pile c 28.35 0 28.35 (at least)
51
4.1.2 - Long term tracer recovery
Since the 1st experiment injection (spring 2012), tracer research was repeated a few times all over the Portonovo beach. Recovery campaigns were performed on May 2012, October 2012 and April 2013 in order to monitor the tracer transport even after storm events occurred throughout one year time span. As expected, the number of tracer recovered decreased over time (Figure 4-4). During each recovery campaign tracers were searched all over the emerged and submerged beach, up to -5 m below mean sea level. No tracers were never found beyond the two physical longshore limits that delimit the beach or offshore (except for one pebble that was found during the October 2012 recovery campaign at -2.2 m below sea level), hence decrease over time of tracer recovery was possible due to burial by other sediments moved by energetic storms. Because the RFID reader detection range does not exceed 40 cm is quite easy to think that stormy waves can pile up sediment with thickness higher than 40 cm (Figure 7-6).
Figure 4-4. Recovery rates of tracers after one year at Portonovo beach.
The most relevant result from long term research of tracers emerged during the campaign of May 2012, two months after the injection, 61 marked pebbles were found (42 % of the injected tracers, Figure 4-4). The average displacement length was 189 m, whereas the largest was 445 m (Table 4-3), value which basically corresponds to the entire beach length. The majority of the tracers ended up on the backshore and the foreshore of the
52
northern sector of the beach, shifted toward NW direction relative to the injection locations (Figure 4-5). Only six pebbles moved toward SE (Figure 4-5 B) even though some of them with significant displacement length (Table 4-3). At each recovery campaign, independently from the rate of recovery, the marked pebbles were mainly found at beach edges and they were basically never recovered, except for a few, in the central sector of the beach. The latter is the narrowest area of Portonovo beach (Figure 2-1) since the backshore is delimited by a longshore seawall and acts like a transfer zone for longshore sediment transport toward the beach limits. It is interesting that basically no variations were noted between 7 and 13 months in terms of recovery rate of the tracers, i.e. 13 and 12 % respectively (Figure 4-4), and that almost all marked pebbles were different among the two recovery campaigns (only 2 pebbles were found both times). According to the morphological feature which the marked pebbles were injected on, tracers that came from the step resulted the most recovered two months after the injection, then follow the tracers from the swash zone and those from the fair-weather berm respectively. After one year the situation appeared reversed: the highest recovery rate referred to the tracers injected on the fair-weather berm while the lowest to the step tracers (Table 4-4). These findings suggest that a continuous process of accumulation and erosion of relevant sediment thickness take place according to the last storm direction and energy occurred.
Towards NW Displacement length (m)
Towards SE Displacement length (m)
Injection position Min. Ave. Max. Min. Ave. Max.
Fair-weather berm 52 190 306 40 73 105
Swash zone 15 211 445 - - -
Step 36 184 440 26 137 264
Total 15 197 445 26 116 264
Table 4-3. Displacement length covered by tracers two months after the injection according to the two longshore directions. Values are shown according to the morphological feature where tracers were injected.
53
Injection position 2 months 7 months 13 months
Fair-weather berm 31% 14% 24%
Swash zone 41% 10% 12%
Step 47% 16% 7%
Table 4-4. Recovery rates of tracers throughout one year time span based on the injection position of pebbles.
54
Figure 4-5. Tracer displacement two months after the injection: A) Comparison between the injection and the recovery locations; B) Displacement magnitude toward the two longshore directions (i.e. NW and SE).
55
4.2 - Marina di Pisa beach
4.2.1 - Short term tracer recovery
Wave motion at Marina di Pisa was very low during the entire duration of the experiment. The significant wave height never exceeded 0.32 m, with an average height of 0.22 m and an n averaged wave peak period of 5.5 s. Waves broke as plunging breakers directly on the beachface. During the experiment waves approached from SW most of the time (Figure 4-6). After the first recovery campaign (6 h), 92% of the injected pebbles were detected; after the second survey (24 h), the recovery rate decreased to 85% (Table 4-5). If one compares the recovery positions with the release ones (Table 4-5), it is evident that the swash zone is the part of the beach where pebbles showed greatest mobility (keeping in mind that 19% and 27% of the tracers went undetected after 6 and 24 h, respectively). This observation is further confirmed by the percentage of pebbles that moved more than 0.5 m, which is well over 60% already 6 h after the injection (Table 4-5). On the other hand, no tracers released on the step moved over 0.5 m 6 h after the injection; this value increased to 35% after 24 h, while the percentages for the other two injection locations increased considerably less (8% to 19% for the fair-weather berm, and 65% to 69% for the step crest, Table 4-5). Among the tracers that moved over 0.5 m, only three showed onshore transport after 6 h, whereas 13 marked pebbles were displaced toward the step. After 24 h, the number of pebbles subjected to onshore movement did not change (three); those that moved offshore increased to 15. Longshore transport reached similar values to the onshore movement: three and five tracers after 6 and 24 h, respectively. After the first recovery campaign (6 h), the pebbles initially released on the swash zone shifted preferentially downslope (Figure 4-8; Figure 4-7 a, b). After 24 h the tracer transport rate also increased at the other injection sites, i.e., the step and the fair-weather berm (Figure 4-8; Figure 4-7 c). The step crest turned out to be the area least affected by wave action also in Marina di Pisa. The cross-shore transport component clearly dominated over the longshore component (Figure 4-8): only three pebbles moved over 3 m in a longshore direction after 24 h, and just one after 6 h. No unexpected transport tendency was observed at Marina di Pisa, even though the results show that transport processes were more active here than at Portonovo beach (93% and 85% of pebble recovery after 6 and 24 h, respectively, as opposed to 99% and 93%).
56
Marina di Pisa
Recovery rate Tracers moved
Injection position 6h 24h 6h 24h
Fair-weather berm 100% 85% 8% 19%
Swash zone 81% 73% 65% 69%
Step 96% 96% 0% 35%
Total 92% 85% 24% 41%
Table 4-5. Recovery percentages of tracers after the first (6 h) and the second (24 h) survey for the experiment at Marina di Pisa. Percentages are expressed according to the injection position of tracers. Only displacements greater than 0.5 m were retained significant given the RFID antenna accuracy of about 40 cm. The last row shows the total recovery percentages without considering the injection position of tracers.
57
Figure 4-6. Wave climate during the Marina di Pisa experiment (wave data were provided by the Tuscany Hydrographic Office; water level data were recorded by the ISPRA tide gauge located at Livorno).