Efficient, innovative, and inclusive options to overcome
monitoring challenges in the early phases of REDD+
Dissertation with the aim of achieving a doctoral degree
at the Faculty of Mathematics, Informatics and Natural Sciences
Department of Biology
of Universität Hamburg
and
at the Department of Bioscience and Territory
of Università degli Studi del Molise
submitted by Giulio Di Lallo
The following evaluators recommended the admission of the dissertation: Supervisor: prof. Michael Köhl
Summary
This cumulative thesis is composed of two parts. The first part consists of a general background on tropical forests and deforestation: it introduces us to the state of the art of the REDD+ program and presents the thematic context of the thesis. The second part integrates the articles into the thematic context and describes the concepts of innovation, efficiency, and inclusion in the domain of this thesis. The second part includes a summary and discussions into the thematic context for each article. A short explanation of the personal contribution of the author to the articles is also provided. Finally, the last section of the second part includes the overall conclusions of the thesis. The full versions of the two articles are attached in Annex 1.
The vast contribution of forests to the well-being of all living organisms is widely recognized. For example, people depend on forests for a remarkable variety of goods and services, such as provision of food and water, maintenance of biodiversity, regulation of water flow, air quality and climate. Keeping forests vigorous and healthy is paramount to ensuring long-lasting and stable provision of the goods and services. Climate regulation is one of the most important ecosystem services for its global impact and because climate change is projected to affect, directly and indirectly, all aspects of ecosystem services provision over the next century. Thanks to their capacity to regulate climate, forests represent the cornerstone of any global climate change mitigation strategy. For the first time, in the 1992 Conference of the Parties of the UN Framework Convention on Climate Change (UNFCCC), forests achieved a prominent position in the international negotiations on climate change. Since then, supporting forests and their management has gained increasing broad public attention. A number of measures have been taken to address threats that forests face and to preserve their capacity of regulating global climate.
Reducing Emissions from Deforestation and forest Degradation (REDD) is the major international political achievement to protect tropical forests’ carbon stocks. The basic idea of REDD+ is to pay forest owners (either through national government funds or directly) to reduce forest emissions and increase forest carbon sequestration. Such a simple idea is facing a number of challenges. This thesis analyses some of the forest monitoring technical challenges that countries can face, particularly during the early phases of REDD+ projects. The objective of this thesis is to provide a better understanding on approaches that could enable effective planning and implementation of monitoring activities. In doing so, this cumulative thesis focuses on three main concepts related to monitoring, reporting, and verification (MRV) systems: innovation, inclusion, and efficiency. Scientific and technological innovations support MRV systems, providing effective instruments to design and execute REDD+. Inclusion refers to the possibility of tropical countries or provinces to participate in REDD+; in fact, the capacity to implement a reliable MRV system determines the possibility of joining and
executing an effective REDD+ program. Finally, pursuing efficiency is paramount, since most developing countries grapple with a shortage of resources, and the REDD+ mechanism copes even with a critical lack of finance.
The first article presents a model, which using only available and easily accessible data and software, predicts the risk of deforestation. To predict the risk of deforestation, the model uses ten independent variables (called predictors), extracted from remotely sensed data. Environmental, social, demographic, and economic variables were incorporated in the model and used as proxies of deforestation. The model combines a machine learning approach and GIS. The machine learning approach is random forests; it is a decision tree–based method, which combining many classification trees produces a prediction of the variable of interest. We adopted random forests due to the strong non-linear relationships between the variables and because it supports evidence-based, data-driven decisions and is therefore often used in decision-making processes. We tested the model using data from Nicaragua. Results show that the accuracy of the model in predicting areas under moderate and high risk of deforestation can be considered satisfactory for some REDD+ purposes, e.g., when identifying potential target areas for REDD+ projects. Furthermore, the adoption of the model may be effective in the first phase of projects: when a country is still developing the capacity to build its own sound and accurate datasets. Therefore, the model is suitable for a stepwise implementation approach of REDD+ projects in regions with limited availability of data, capital, technical infrastructure, or human capacities. Stepwise approaches are needed to overcome existing data and capacity gaps and enable a wider participation to REDD+. Adopting an innovative model can improve efficiency and promote inclusion by exploiting already available data, by applying powerful methods to handle data, and by using open source software.
The second article examines three key factors affecting the generation of forest carbon credits from REDD+. The factors are (i) setting Reference Levels (RLs); (ii) supplying of emission reduction due to REDD+; (iii) uncertainties in forest carbon emissions estimates. This article includes two analyses: a simulation study and a sensitivity analysis . In the simulation study, the interrelationships between the costs of forest carbon monitoring, the associated reliability, and the resulting accountable carbon credits were investigated. We assumed the employment of both Lidar data and passive optical data. Findings of the simulation study highlight that combining statistically rigorous sampling methods with Lidar data can significantly boost the accountable amount of forest carbon credits that can be claimed. In fact, the generation of carbon credits is mainly affected by the uncertainties of the estimate of forest area and carbon stock changes per unit of area. We found that innovative monitoring techniques have a positive effect on the efficiency of MRV systems, and that despite having a larger initial cost, the investment in MRV system, based on Lidar, could be paid-off by the potential result-based payments. Conceiving an MRV system as an investment can encourage the
implementation of well-defined, long-term monitoring strategies. In the sensitivity analysis, the above-mentioned three factors are ranked according to their impact on the generation of carbon credits. Findings show that the amounts of avoided emissions under a REDD+ scheme mainly vary according to the monitoring technique adopted; nevertheless, RLs have a nearly equal influence. The target for reduction of emissions showed a relatively minor impact on the generation of carbon credits, particularly when coupled with low RLs.
Contents
Acronyms ... 1
Part 1. Thematic context ... 3
Why do tropical forests matter? ... 3
Tropical forests’ threats: deforestation and degradation drivers ... 4
Solutions to reverse deforestation and forest degradation: the REDD+ approach ... 7
REDD+ Safeguards ... 8
Forest reference (emission) levels ... 10
Measuring, reporting and verification ... 11
Funding for REDD+... 12
The cost of REDD+... 14
Part 2. Integration of the articles into the thematic context ... 16
First article ... 17
Summary ... 17
Discussion in the thematic context ... 19
Second article ... 21
Summary ... 21
Discussion in the thematic context ... 22
Part 3. Conclusion of the cumulative dissertation ... 24
References ... 27
Annex 1. Scientific articles ... 34
REDD+: Quick Assessment of Deforestation Risk Based on Available Data ... 35
Understanding Measurement Reporting and Verification systems for REDD+ as an investment for generating carbon benefits ... 53
Acronyms
COP Conference of the Parties
FAO Food and Agriculture Organization
GHG Greenhouse gas
GFRA Global Forest Resources Assessment
IPCC Intergovernmental Panel on Climate Change
Lidar Light Detection And Ranging
REDD+ Reducing emissions from deforestation and forest degradation
RL Reference Level
Part 1. Thematic context
Why do tropical forests matter?
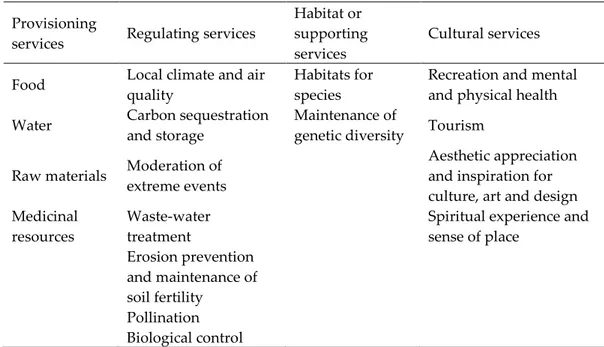
Answering the question “why is the health status of forests so important for the whole planet?” is simple: forests provide a number of vital services to all living organisms. Past human experiences teach that large-scale forest clearance can have irreversible consequences for people and, along with other factors, can drive societies to collapse (Abrams and Rue, 1988; Diamond, 2005). Environmental degradation, as a consequence of deforestation, generates devastating effect on soil erosion and further depletion of soils. Deforestation can influence the survival of societies, especially those that base their economies on agriculture. The importance of forests is associated to the wide set of services that they offer. An exhaustive classification of the forest environmental services is complex. For simplicity and clarity, four categories of services can be described: ecological, economic, socio-cultural, and scenic and landscape (Table 1).
Table 1 Overview of forest services by typology (Source: TEEB).
Provisioning
services Regulating services
Habitat or supporting services
Cultural services
Food Local climate and air quality
Habitats for species
Recreation and mental and physical health Water Carbon sequestration
and storage
Maintenance of
genetic diversity Tourism Raw materials Moderation of
extreme events
Aesthetic appreciation and inspiration for culture, art and design Medicinal
resources
Waste-water treatment
Spiritual experience and sense of place Erosion prevention and maintenance of soil fertility Pollination Biological control
All types of forests can potentially provide the services reported in Table 1. However, tropical forests’ contribution to global climate regulation and to biodiversity richness is far larger than other forest ecosystems. “Certainly the tropics, and particularly tropical moist forests, stand out as highly significant reservoirs of global biodiversity” (Dirzo and Raven, 2003); they contain the majority of the world's biodiversity hotspots
and the largest concentration of species densities. Despite covering less than 2% of the planet’s surface, they house over 50% of its biodiversity. A number of plant and animal species living in tropical ecosystems are classified as critically endangered by the International Union for the Conservation of Nature and Natural Resources (IUCN). Tropical deforestation and forest degradation represent the greatest threat to biodiversity, with potentially irreversible effects (Vieira et al., 2008). In fact, the cascade effect on human activities can be dramatic when the loss of tropical biodiversity leads to the extinction of living species (Bradshaw et al., 2009).
Another pivotal role of tropical forests —which has brought them to the top of the international agenda on climate change— is the capacity to sequester and stock carbon dioxide: they sequester more carbon at faster rates than temperate and boreal forests (Bonan, 2008). From 1750 to 2011, the human-induced CO2 emissions to the atmosphere were 555 ± 85 PgC (1 Pg = 1015 g). With 180 ± 80 PgC, changes in land use represent the second largest anthropogenic source of CO2 to the atmosphere —it mainly includes deforestation, though afforestation and reforestation also have a role. The Intergovernmental Panel on Climate Change’s (IPCC) fifth assessment report states that it is between 90-100% certainty that “more than half of the observed increase in global mean surface temperature from 1951 to 2010 is due to the observed anthropogenic increase in greenhouse gas (GHG) concentrations” (Intergovernmental Panel on Climate Change, 2014). In fact, one effect of the release of anthropogenic carbon (i.e. the carbon released by human activities) into the atmosphere is the increase of the Earth’s temperature. It clearly appears the decisive influence of forests on climate, and why any global climate change agreement has to put them at its core. In fact, without any mitigation efforts, emissions from the forest sector are likely to increase throughout the XXI century (Eliasch, 2008).
Tropical forests’ threats: deforestation and degradation drivers
In 1990, forests represented about 31.6% of the global land surface. Twenty-five years later, the Global Forest Resources Assessment (GFRA), issued by the Food and Agriculture Organization (FAO), reported that forests covered 30.6% of the global land surface, which is about 0.6 ha per every person on the planet (Keenan et al., 2015). Overall, considering the global forest area, there was a net decrease of 3% between 1990 and 2015 (Keenan et al., 2015). However, this percentage results from a combination of a loss of natural forests and an increase in planted forests, therefore does not supply information on the actual net loss of natural forests, which is indeed far higher.
The annual rate of net forest loss nearly halved over the 25-year period between 1990 and 2015. At a first glance, one may deduce from these figures that world forests are, despite everything, rather healthy or that, perhaps, the heated international debate on
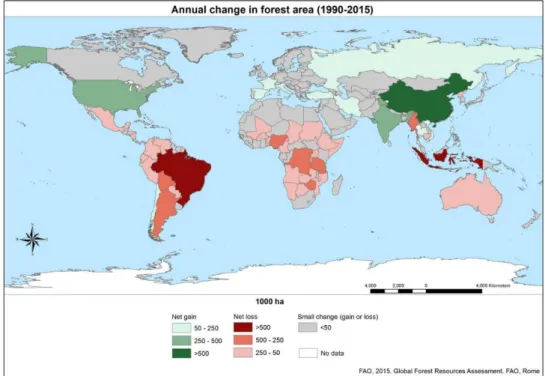
deforestation is overemphasizing the need to protect forests. However, turning the spotlight on the national level, the situation varies dramatically. Before the 1980s, deforestation and other land use changes mainly occurred in mid-northern latitudes; while since the 1980s, the tropics, particularly tropical America and Asia with smaller contributions from tropical Africa, registered alarming deforestation rates (Ciais et al., 2014). Currently, the vast majority of forest area loss occurs in the tropics. In 142 tropical countries, the area of natural forest decreased by 11% between 1990 and 2015 (FAO, 2015). Tropical rainforests experienced the largest share of deforestation: 32% of the global forest loss occurred there, of which nearly half took place in South America (Hansen et al., 2013) (Figure 1Error! Reference source not found.). It is estimated that up to 50% of the world’s tropical forests have been cleared, representing one of the most significant anthropogenic land use changes in history (Lewis, 2006). A recently published study states that intact forest landscape extent has been reduced by 7.2% from 2000 to 2013, of which 60% occurred in tropical regions (Potapov et al., 2017).
Figure 1 Annual change in forest area from 1990 to 2015 (Source: FAO 2015).
A wide definition of deforestation describes it as a long-term or permanent conversion of forested land to non-forested land (UNFCCC, 2006). Deforestation causes are commonly classified as direct (also named proximate) and indirect (named underlying). Direct causes involve any human activity, at local level, that directly and immediately drives to forest clearance. Indirect causes can affect forest decline both at local and global level, because they include underlying societal dynamics. Indirect causes drive the direct causes. Geist and Lambin (2002) analyzed 152 subnational case-study reports and described three dominant direct causes of deforestation: infrastructural
extension, agricultural expansion, and wood extraction. Direct causes are driven by five underlying factors: demographic, economic, technological, policy and institutional, and cultural. Most of the causes are region specific and, in most cases, deforestation is determined by their different combination. As one can expect, deforestation drivers vary spatially and temporally: each country and region has its own intricate set of economic, social, and political circumstances determined by public and individual decisions. Under these assumptions, “no universal policy for controlling tropical deforestation can be conceived” (Geist and Lambin, 2002).
Forest degradation is even harder to define, and therefore to identify, than deforestation. In fact, it has different facets, often difficult to define by a single measure (Morales-Barquero et al., 2014; Thompson et al., 2013). A number of different definitions of forest degradation exist. A 2003 IPCC report reviews nearly 50 definitions of degradation in use and in the end suggests a definition that can meet the criteria discussed in the context of the Kyoto protocol: “A direct human-induced, long-term loss (persisting for X years or more) of at least Y% of forest carbon stocks [and forest values] since time T and not qualifying as deforestation or an elected activity under Article 3.4 of the Kyoto Protocol”.
Since the acknowledgement by the 2007 Conference Of the Parties (COP) that forest degradation also leads to emissions and needs to be addressed (UNFCCC, 2008), it has been a topic of discussion (Mertz et al., 2012; Plugge and Köhl, 2012). At present, no certain estimates of carbon emissions from forest degradation exist for the entire tropics, though Houghton (2012) assessed that it may vary from 10% to 40% of the total net emissions from tropical forests between 1990 and 2012 (∼1.4 PgC year−1). The 2015 GFRA (FAO, 2015) defines the partial canopy cover loss (PCCL) as a proxy of degradation and assesses that the total area of PCCL in tropical climatic domain was 185 million ha from 2000 to 2012.
Complexities faced in defining degradation are even more profound when it comes to monitoring degradation. While deforestation is relatively simple to detect using space- or air-borne remote sensing platforms, degradation is far more challenging to observe remotely, even with high-resolution optical imagery (Morales-Barquero et al., 2014). Active sensors, such as RAdio Detection And Ranging (Radar) and Light Detection And Ranging (Lidar), which are able to penetrate both cloud and canopy cover, offer a good solution for monitoring stock level change in tropical forests (Ryan et al., 2012). However, the costs still hamper their application to vast tropical areas, even though their adoption in forest inventory is more efficient and convenient than field-based assessments alone (Tomppo et al., 2008).
It is also important to clarify that different forms of forest degradation exist. In many cases, forest degradation does not lead to deforestation. For example, one area can remain degraded for years, as for example local communities get fuel wood from it, and then, if the local wood extraction finishes, the forest will naturally re-increase its carbon stock
level. Therefore, forest degradation drivers are often different from deforestation drivers. The GOFC-GOLD Sourcebook (2013) and Hosonuma et al. (2012) indicated four main causes of forest degradation: timber extraction and logging, fuelwood collection and charcoal production, uncontrolled fires, and livestock grazing. Deforestation and forest degradation differ for their driving forces and their consequences, so different actions have to be implemented to address them.
Solutions to reverse deforestation and forest degradation: the REDD+ approach
The REDD+ programme (Reducing Emissions from Deforestation and Forest Degradation) is an innovative approach to reduce CO2 emissions from the forest sector. It is the most important action concerning the association between tropical forests and climate change. The innovativeness of REDD+ holds in its holistic approach in addressing deforestation and forest degradation drivers. The core ideas of REDD+ have never been executed nor conceived by previously implemented mechanisms.
At least three key features characterize REDD+ (Sunderlin and Atmadja, 2009). The first one is that REDD+ is a marked-based mechanism: it gives a monetary value to forest carbon. Since the first pilot initiatives aimed at avoiding deforestation and forest degradation, REDD+ projects have generated carbon credits traded in voluntary carbon markets. The basic idea is to pay forest-rich countries for preserving and enhancing their forest carbon stocks. In order to comply with the commitments made in the international negotiations and to compensate their emissions, developed countries have to provide developing ones with the finance to do so, by buying carbon credits produced through REDD+. The second key feature of REDD+ is the result-based approach; it means that payments to forest-rich countries (named non-annex I parties) depend on the actual abatement of carbon emissions from forests. Each ton of CO2 equivalent not emitted in the atmosphere thanks to the REDD+ programme will generate a tradable carbon credit, only if its generation is measured, reported and verified, in accordance with the Bali Action Plan (UNFCCC, 2008). Finally, a new pivotal feature of REDD+ is the large amount of money that governments are committing to this mechanism (Sunderlin and Atmadja, 2009). Nevertheless, complex challenges remain to be resolved for effectively implementing each of the above-reported features.
REDD+ constitutes an achievement of the United Nations Framework Convention on Climate Change (UNFCCC), which has given importance to tropical forests on the global climate regime in the international community debate. UNFCCC parties started the discussion during the 11th COP held in Montreal, in 2005 (when the Kyoto Protocol came into force). Initially, only the reduction of emissions from deforestation (RED) was part of the debate. Two years later, in 2007, REDD+ was fully integrated into the global climate agenda with the addition of the second ‘D’ and the term ‘plus’. The ‘+’ allowed
for four more activities to be added as eligible for support and funding under a REDD+ mechanism: reducing emissions from forest degradation, conservation of forest carbon stocks, sustainable management of forests, enhancement of forest carbon stocks.
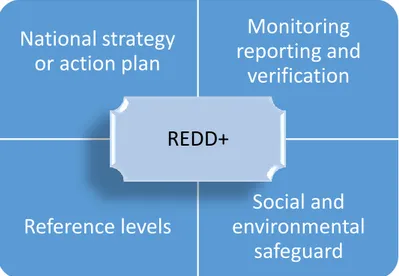
Non-annex I countries willing to participate in REDD+ under either the Forest Carbon Partnership Facility (FCPF) or the UN-REDD Programme have to develop four core components in accordance with national circumstances and respective capabilities. The Readiness Preparation Proposal template provided by the FCPF and the UN-REDD Programme is a document designed to assist a country to prepare itself for involvement in REDD+. This document defines the following four core components: a national strategy or action plan; forest reference emission level (FREL) and/or reference level (RL); a robust and transparent national forest monitoring system; a plan for establishing a safeguard information system (Figure 2).
Figure 2 Core components to be developed by non-annex I countries that aim to undertake REDD+ activities under either the Forest Carbon Partnership Facility (FCPF) or the UN-REDD Programme.
The national strategy (also called action plan) provides a comprehensive understanding of political, social and economic dynamics affecting the activities to be undertaken. It is commonly designed in the readiness phase of REDD+ (i.e. the first phase), involving all the relevant stakeholders. The national strategy or action plan have to address, inter alia, “the drivers of deforestation and forest degradation, land tenure issues, forest governance issues, gender considerations and the safeguards” (UNFCCC, 2011).
REDD+ Safeguards
Along with benefits, REDD+ can also have environmental and social detrimental effects, named “risks”. To prevent and mitigate risks that can occur during the execution
National strategy
or action plan
Monitoring
reporting and
verification
Reference levels
Social and
environmental
safeguard
REDD+
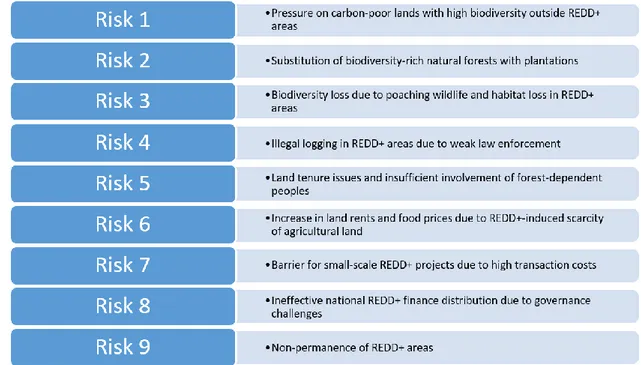
of REDD+ activities, appropriate measures have to be planned and implemented. REDD+ ‘Safeguards’ refer to policies, processes and measures that identify, analyze and manage risks and opportunities of REDD+ (Murphy 2011). Nine socio-economic and environmental risks of REDD+ implementation can be described, as reported in Figure 3 (Huettner, 2012).
Figure 3 Potential risks from REDD+ policies and programmes (adapted from Huettner, 2012). Seven safeguards should be promoted and supported when undertaking REDD+ activities to prevent or mitigate potential risks and boost benefits (UNFCCC, 2011). The seven safeguards can be grouped into three categories (Barquín et al., 2014):
1) Governance
a) REDD+ activities are compatible with national and/or international programmes, conventions, and agreements.
b) National forest governance structures are transparent and effective. c) All the relevant stakeholders are fully and effectively involved in REDD+ activities.
2) Social and environmental impact (including non-carbon benefits)
d) Respect for the knowledge and rights of indigenous peoples and members of local communities according to the United Nations Declaration on the Rights of Indigenous Peoples.
e) Protect and conserve, through REDD+, natural forests, biological diversity and their ecosystem services, in order to enhance social and environmental benefits.
3) GHG emissions integrity
f) Actions to address the risks of reversals. g) Actions to reduce displacement of emissions.
Forest reference (emission) levels
The UNFCCC requests non-annex I parties to assess national forest reference emission level (REL) and/or reference level (RL). These benchmark the actual reduction of emissions ascribable to the implemented REDD+ activities. Hence, RELs and RLs — expressed in tons of carbon dioxide equivalent per year— gauge the progresses of REDD+ participant countries and will be technically assessed in the context of result-based payments.
Establishing RLs according to the IPCC principles for reporting of national emissions and removals of GHGs is one of the most complex and challenging REDD+ elements; they can decisively determine the success of REDD+ because they “affect the quantity, credibility, and equity of credits generated from efforts to reduce forest carbon emissions” (Griscom et al., 2009). The necessity to setting RLs is tightly linked to the concept of additionality, which envisages that REDD+ projects should go beyond business-as-usual, enabling emission reductions that would have not taken place otherwise. As a result, financial support is only available for avoiding emissions that would occur in the absence of REDD+.
There is no internationally standardized method for the setting of RLs under UNFCCC; several techniques can be implemented, as long as five principles are applied: transparency, completeness, consistency, comparability, and accuracy. However, the lack of a standardized method creates the potential risk that would lead to overcompensation and therefore reduces the cost-efficiency of REDD+ payments (Hargita et al., 2016).
Two categories of methods can be applied to design RLs: retrospective and prospective approaches (Huettner et al., 2009). Retrospective approaches take into account historical GHG emissions and removals and assume a linear trend; under these approaches adjustment factors for national circumstances are considered to allow inclusion of social and economic variables (Mollicone et al., 2007). Prospective methods use land-use-change models to predict the risk of deforestation and forest degradation (Brown et al., 2007). In any case, RL methods should be selected in accordance with national circumstances and capabilities. Until now, twenty-five countries have submitted a proposed forest reference emission level and/or forest reference level and are undergoing technical assessment processes (according to the UNFCCC website, visited on the 31st May 2017);
Measuring, reporting and verification
Any valid national, sub-national or local REDD+ project has to possess the tools to assess the amount of forest carbon, including its changes over time. The measurement of the reduction of emissions accomplished by the REDD+ project, as well as the system for reporting and verifying the emissions reductions, constitute the frame of MRV-systems (Measurement, Reporting, and Verification). The Bali Action Plan of the UNFCCC encourages all non-annex I parties to measuring, reporting and verifying emission reduction (Box 1). Measurements include activities of data collection concerning forest carbon inventory and land-use change analysis over the project lifetime. Precision and accuracy of the collected data have to be rigorously quantified. The IPCC reporting guidelines suggest transparent, consistent, accurate, comparable, and complete methods for reporting GHG emissions (IPCC, 2003). The reporting process entails calculating emissions and removals from the forest carbon inventory and the land use change analysis. The data collected over time have to be formally reported and finally will go through a process of verification that evaluates and, eventually, validates the information that is presented. Two land-use change experts, selected from the roster of the UNFCCC experts, perform this process (UNFCCC, 2013). The MRV system is one of the four fundamental components that countries willing to participate in REDD+ have to elaborate (Figure 2). Implementing a reliable MRV system is crucial; in fact, result-based payments are tightly linked to the quality of field assessments and remotely sensed data (Plugge et al., 2013).
Box 1 – MRV definitions
Measurement Refers to two types of data: (i) data on land-cover change, usually assessed through remote sensing technology, termed 'Activity data'; (ii) data on forest carbon stocks, commonly derived from in-situ assessments based on
statistical sampling design, are termed ‘Emission factors’ (Goetz et al., 2015). Reporting The measured forest-related emissions have to be periodically reported to
the UNFCCC, in order to track REDD+ progresses. The reporting mechanism, that covers the whole project extension, utilizes a common reporting format and methodology, in order to ensure that information provided is complete, transparent, comparable and accurate (UNFCCC, 2013).
Verification A panel of experts performs a thorough quality control to identify potential errors, flaws, and omissions. Results of the technical assessment are issued in a report (UNFCCC, 2013).
The measurements and reporting can be performed with different levels of accuracy and complexity. The IPCC propose a hierarchical structure, called the tiered approach: it implies increasing levels of accuracy of the method for estimating GHG emissions and removals for each source. The tier 1 approach employs default data and simple equations
easily obtainable from IPCC guidelines or other international sources. Tier 2 uses region- or country-specific activity data and emission factors, with higher temporal and spatial resolution and disaggregated land-use category. Under tier 3, models and techniques specifically conceived to address national circumstances are applied; the great reduction of uncertainties requires very good forest inventory capacities. Tier 3 approaches envisage the combination of remotely sensed data calibrated over field measurements. This combination provides a reliable, practical, and cost-effective solution for developing and maintaining REDD+ MRV systems (De Sy et al., 2012). Optical sensors, Radar, and Lidar remote sensing techniques are the main sources of remotely sensed data used to extract information for forest biomass. Lidar helps to predict biomass in tropical forests with satisfactory accuracy. The mutually supportive combination of ground- and Lidar-based data was successfully applied in various forest biomes to estimate forest carbon stock (Mauya et al., 2015). Kaasalainen et al. (2015) analysed various aspects on the combined use of Lidar and Radar, highlighting their potential use for continuous global biomass mapping with improved accuracy.
Funding for REDD+
Finding a reliable source of financing is the key issue of REDD+ (Angelsen and Wertz-Kanounnikoff, 2008). The COP 19 established a work programme on REDD+ finance, and, in decision 9/CP.19, reaffirmed that finance may come from a wide variety of sources: public and private, bilateral and multilateral, including alternative sources. A conservative estimate reported that pledges and investments from public and private account for US$9.8 billion for the period between 2006 and 2014 (Norman and Nakhooda, 2015). The public sector committed the vast majority of funding (over 90%), which were channelled into bilateral country programmes and multilateral funds. Bilateral programmes represent two thirds of all internationally supported REDD+ activities (Streck, 2012); they facilitated the allocation of most of the resources to national governments in developing countries (Buizer et al., 2014). Norway is the largest contributor, followed by the United Kingdom, Germany, Japan and the United States.
Multilateral funds represent the second largest allocation of public financing. The latter includes, inter alia, the Amazon Fund, the Forest Carbon Partnership Facility and the UN-REDD programme. From 2008 to 2016, about US$4 billion was pledged to five multilateral climate funds that support REDD+ (Watson et al., 2016). Bilateral and multilateral schemes cover about 89% of total finance, while the remaining 11% is covered by private finance.
A much stronger engagement of the private sector is needed to meet the financial needs of REDD+. In fact, to support performance based payments at an effective level about US$ 30 billion per year required (UNEP, 2014). Another estimate reports that for
halving global forest emissions between 2005 and 2030, from $17.2 to $28 billion per year could be necessary (Eliasch, 2008). To raise such a large amount of money, a new funding model comprising public-private partnerships is indispensable. This new model could be part of a new paradigm based on the principles of the Green Economy (UNEP, 2014). While achieving an inclusive green economy is a long-term challenge, filling the REDD+ financial gap needs urgent action, and a relatively faster way to involve the private sector could be to trade forest carbon credits both in voluntary and compliance markets. At present, carbon credits can only be traded in voluntary markets, but the vast majority of finance flows into compliance markets, which have prohibited the trading of forest carbon credits.
According to the market-based architecture of REDD+, part of the money for the result-based payments should come from the returns derived from the selling of credits on carbon markets. However, the financial market-based transactions and commitments to reducing carbon emissions from forestry and land-use practices still remain substantially insufficient (Goldstein, 2016). This drawback may compromise the success of the mechanism, considering that a global market-based framework was expected to financially support most of the activities. REDD+ funds are limited, furthermore, their effective allocation might be hampered by institutional, legal, political and economic barriers. For example, delays in the short-term disbursement of REDD+ funds and a mismatch of donor requirements and recipient needs render its fast progresses to be hardy achievable (Streck, 2012). These unfavorable economic conditions might improve: after the COP 21 held in Paris in December 2015, REDD+ has stepped into the spotlight and some positive signs emerged. Article 5 of the agreement reads, “Parties should take action to conserve and enhance, as appropriate, sinks and reservoirs of greenhouse gases […] including forests” and suggests a market approach for financing REDD+ activities. The formal inclusion of forests in the UNFCCC agreement is certainly a positive accomplishment; however, it is a starting point rather than an end goal. The Paris Framework neither allocates funding nor provides certain information on the source for result-based finance. Now it will be up to the next COP to figure out how to implement and boost actions on the ground. On the other hand, the ongoing activities that are being carried out under the REDD+ framework must go on; countries that have already started REDD+ national actions must be permitted to keep implementing measures and achieving their objectives, while alternative solutions to cope with the lack of resources must be found. Inter alia, a solution could be to take full advantage of the available resources, for example by adopting innovative techniques that improve the capability of achieving greater efficiency.
The cost of REDD+
REDD+ costs are grouped into three categories: opportunity cost, transaction costs, and implementation costs.
Opportunity cost: besides the negative environmental impacts of converting forests to other land uses, deforestation can generate a series of associated benefits. The opportunity cost is the forgone profit that deforestation would have generated, for example from timber and agricultural commodity sales. The opportunity cost of REDD+ defines the lost net benefit for not continuing with the business-as-usual logging or converting forestland.
Transaction costs: They are the costs involved in setting in motion and managing REDD+ policies, from the very early phases until the end of the project, e.g. identifying and selecting the project, partners and consultants; upfront capacity building; feasibility studies; negotiation, such as obtaining permits, arranging financing and transactions with carbon buyers; measuring, reporting and verification. These costs, usually expressed in $/tCO2, cover the necessary expenses to establishing an operative REDD+ programme and display economies of scale.
Implementation costs: They are directly associated with the actions that reduce emissions. Some examples are: concrete actions that prevent logging, restoring vegetation in degraded areas, providing capacity building, infrastructure or equipment to develop alternative livelihoods to communities.
In reality, the categories of implementation and transaction costs are not always distinct; however, implementation costs are typically associated with reducing deforestation directly, whereas transaction costs are indirectly associated with it.
Even though several research studies have defined opportunity costs as the largest portion of REDD+ costs (The World Bank, 2011), trying to provide a general ranking of costs that applies to all countries constitutes a futile exercise for two reasons. First, assessing costs at global level is rather hard and “estimates are made less accurate by uncertain methodologies and untested assumptions” (Fosci, 2013). Second, costs can substantially vary according to the national context and specific location, for example the opportunity costs of land in remote areas may be less than transaction and implementation costs (Pagiola and Bosquet, 2009). Antinori and Sathaye (2007) presented an analysis of transaction costs for eleven forestry projects concerning forest preservation, restoration and afforestation projects (not REDD+ projects). The average transaction cost was 0.38 $/tCO2; monitoring and verification costs represent 35% of the weighted transaction costs —which is the main component— ranging from 4%, for afforestation to 67% for forest restoration projects.
It is also possible to classify REDD+ costs according to the institution or the person that bears the costs. Overall, costs are incurred by buyers and sellers of REDD+ actions. These two broad categories can include countries, government agencies, international
donors or buyers in carbon market, non-governmental organizations, research institutions, consultants-service providers, and individual actors (e.g. landholders) (Angelsen et al., 2013; Graham et al., 2016).
The present thesis investigates aspects related to MRV costs. The latter are conventionally included in the transaction costs and are incurred by the parties that implement the REDD programme (e.g. national and sub-national istitutions) and third parties, such as verifiers, certifiers, and lawyers (Pagiola and Bosquet, 2009). Transaction costs are commonly considered minor compared to the other categories of costs; nonetheless, their importance could be substantially underestimated (Fosci, 2013). Moreover, implementing an effective MRV system will directly affect the generation of carbon credits, and so it influences the overall budget of the programme.
Part 2. Integration of the articles into the thematic context
The objective of the thesis is to provide a better understanding on approaches that could enable effective planning and implementation of monitoring activities. This thesis relies on three main pillars: innovation, inclusion, and efficiency in REDD+.
1) Scientific and technological innovations support MRV systems and provide appropriate instruments to design and execute REDD+. They can make a difference in generating carbon credits. At present, the considerable digital divide between developed and developing countries remains high, particularly concerning technologies used in forest inventorying and monitoring. Spreading innovation is a key intervention to promote both efficiency and inclusion.
2) The second pillar —inclusion— refers to the possibility that every country or province is given the opportunity of participating in REDD+. In the context of this thesis, inclusion is about the barrier to participation associated to low monitoring capacities and to limited availability of data, capital, technical infrastructure, or human capacities.
3) The third pillar concerns efficiency, which is fundamental, because most developing countries grapple with a shortage of resources, and there is a critical lack of finance in the REDD+ mechanism. The concepts of efficiency that are covered in this thesis are (i) techniques that enable a wise use of available data and resources, (ii) the analysis and description of approaches that produce large result-based payments (i.e. carbon credits generation) with minimum expense.
First article
The first article, published in January 2017 in the Forests journal volume 8, issue 1, was written by Di Lallo, with a substantial contribution made by Köhl. Köhl conceived the original idea that was developed by Di Lallo, who designed the study, created the model, and analyzed and interpreted the data. Köhl also helped to structure the study and develop the method; he coordinated the study, and substantially contributed to the quality control and critical revision of the manuscript. Lopez helped with the case study and the interpretation of some data. Mundhenk suggested the application of random forests and also provided technical content and revised the manuscript. Marchetti helped to coordinate the study and revised the manuscript.
Summary
The article presents a novel modelling approach that predicts the spatial location of forests threatened by near-future deforestation. Simulating forest-clearing dynamics is a key step in the context of REDD+. The importance of adopting reliable methods to simulate trends of business-as-usual deforestation scenarios is linked to the fact that result-based payments are made for improvements over business-as-usual scenarios. Modelling techniques using mathematical and statistical methods are also useful for identifying areas where REDD+ initiatives will have the greatest impact and for supporting domestic political measures to implement an informed and transparent funding-allocation mechanism. Moreover, combining forest-clearing dynamics with data on forest carbon stock enables the prediction of carbon-rich areas under the risk of losing their ecological values.
Several spatial modelling tools and approaches exist, or have been proposed, for identifying areas at risk of deforestation. However, many of the existing models can be not easily implemented in some tropical countries, due to limited data availability, organizational structure, or monetary resources. For this reason, we created a model, which using only available and easily accessible data, predicts the risk of deforestation with satisfactory accuracy for potential application in beginning phases of REDD+ projects. We tested the model using national-scale data from Nicaragua. The model is named PREDIT (PREdicting Deforestation In the Tropics).
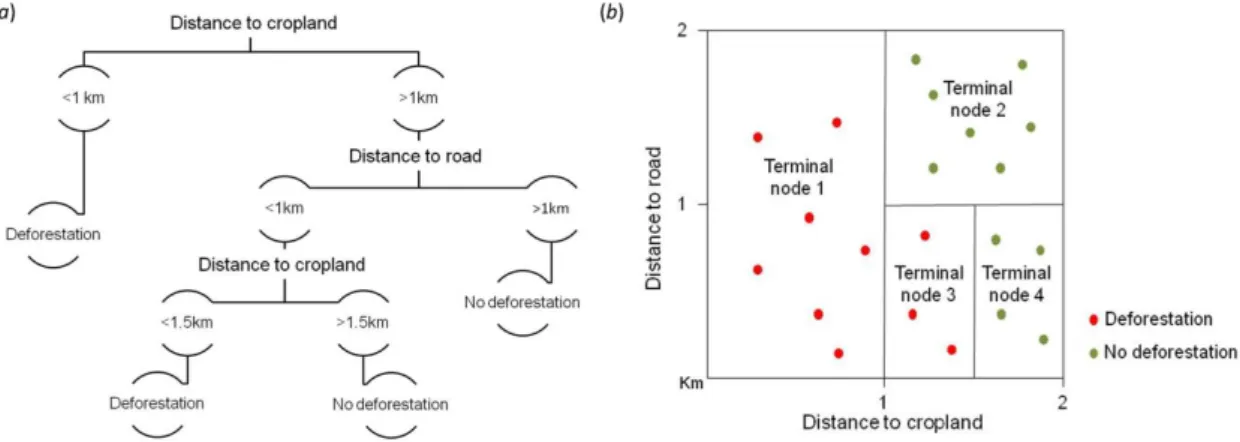
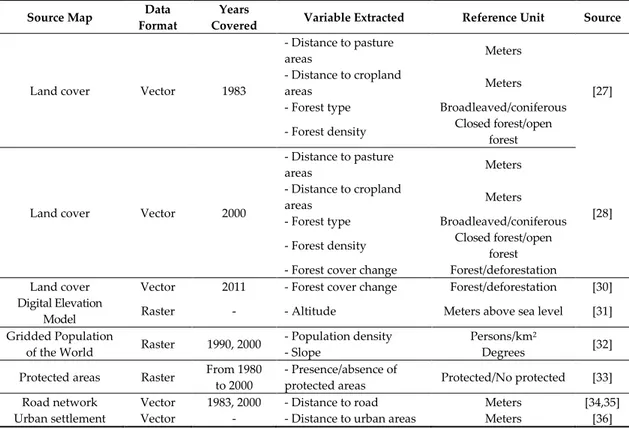
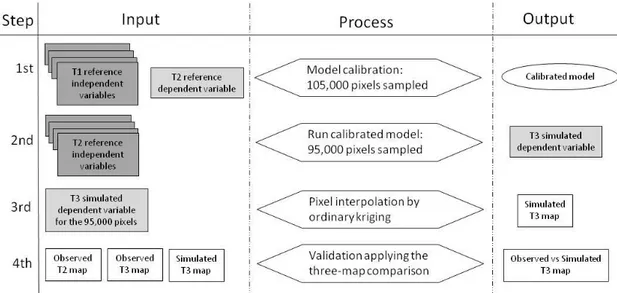
PREDIT integrates inputs from different data layers (i.e. maps) using the random forests algorithm. The random forests algorithm is a decision tree–based method belonging to the family of machine learning. Decision tree-based methods are used in decision-making processes because they enable evidence-based, data-driven decisions. We adopted random forests given the strong non-linear relationships between the variables. We used available data sources from the time interval 1983–2011. Data from t1–t2 (i.e., 1983–2000) were used to calibrate the model and data from t2–t3 (i.e., 2000– 2011) to test its accuracy. Ten independent variables (also called predictors) were used
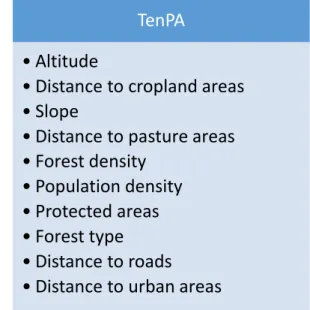
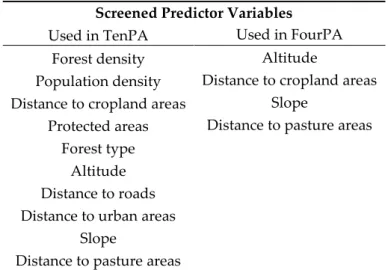
as a proxy of deforestation (Figure 4). They were selected by reviewing the available literature and according to the author’s knowledge of the country; nevertheless, the availability of data was the major limitation in selecting the predictors. The dependent variables consist of two classes: ‘forest areas’ and ‘deforested areas’. We performed PREDIT using two sets of predictor variables. In the first session, referred to as FourPA (Four Predictors Alternative), we included only the four predictors that mostly affect deforestation in Nicaragua. In the second session, referred to as TenPA (Ten Predictors Alternative), the set of all 10 available predictors was used (Figure 4).
Figure 4 Predictors used in PREDIT model. The model was run on two alternatives: (i) TenPA, which uses 10 predictors; (ii) FourPA, which uses four predictors, i.e. those that substantially influence forest-clearing dynamics.
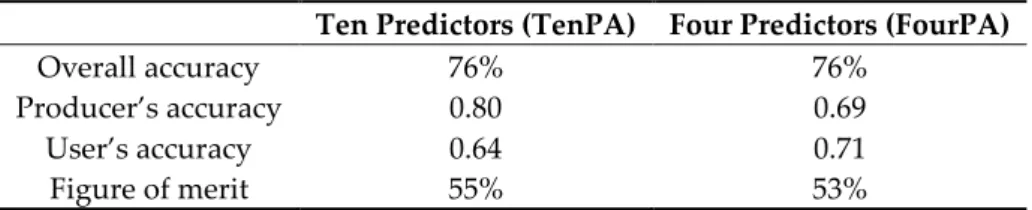
The classification error for the two modeling alternatives (with four and ten predictors) was similar, so adding six predictors to the FourPA-model did not improve the overall accuracy, which was 76%. However, the overall accuracy is not an exhaustive indicator of model performance. Assuming the application of PREDIT in REDD+ projects, FourPA would be the preferred alternative, because it does not overestimate the risk of deforestation (i.e. it applies a conservative approach). In fact, one significant difference between TenPA and FourPA is that TenPA overestimate the risk of deforestation; it also explains the high value of Producer’s accuracy (which defines the pixels correctly classified as “deforestation”) (Table 2).
FourPA
• Altitude
• Distance to cropland areas • Slope
• Distance to pasture areas
TenPA
• Altitude
• Distance to cropland areas • Slope
• Distance to pasture areas • Forest density
• Population density • Protected areas • Forest type • Distance to roads • Distance to urban areas
Table 2 Performance of the model in predicting areas subject to deforestation. The table shows statistics for the alternatives that use ten predictors (TenPA) potentially associated with deforestation and four predictors (FourPA) that certainly affect deforestation dynamics.
Ten Predictors (TenPA) Four Predictors (FourPA)
Overall accuracy 76% 76%
Producer’s accuracy 0.80 0.69
User’s accuracy 0.64 0.71
Figure of merit 55% 53%
We conclude that this modelling approach could find applications in REDD+. It can support countries involved in the early phases of REDD+. Particularly those countries that grapple with a critical lack of data, and that, while developing the capacity to build their own sound and accurate dataset, can take advantage of already available and easily accessible data.
Discussion in the thematic context
Forecasting future land-cover dynamics based on direct and indirect drivers of deforestation does not necessarily require extensive and expensive studies. Reliability and level of detail depend on the scope of the assessment and on local circumstances, such as financial availability and local technical capacity. Countries with low capacity in assessing and monitoring its forest resources, and the associated socio-economic dynamics, face serious challenges to join REDD+ due to the large investment at the beginning of the project. A lack (or inability) of access to financing can principally hinder REDD+ readiness implementation (Maniatis et al., 2013). Reforming forestry-related policies and building technical capacity are hard challenges as well; for example, investigating deforestation drivers and implementing a robust MRV system imply the existence of a well-tuned national forestry department. It may take years and large monetary investment. A stepwise approach —which envisages a gradual improvement of countries capacities as they progress toward more advanced REDD+ phases— could facilitate the implementation of REDD+ in countries lacking such capacities. This would enable a country to start implementing REDD+ activities while building its own internal structure; accordingly, it could reach a higher level of detail at advanced stages of the project. This stepwise approach is often necessary since the majority of tropical countries still lack capacities to implement a complete and accurate mechanism for measuring forest area change and performing a national forest inventory on growing stock and forest biomass (Food and Agricultural Organization, 2015).
While big challenges remain in developing forest inventory and carbon pool reporting capacities, important improvements have been accomplished in forest area change monitoring and remote sensing capacities: a recent study evaluated the capacities of 99 countries, reporting that 54 of the 99 have good to very good capacities (Romijn et
al., 2015). A meaningful contribution to the improved capacity is ascribable to the increased availability of earth-observation data and the open access data policies; at present, as never before, a number of remotely sensed data are freely available over the internet to any user (Wulder et al., 2012). Countries willing to participate in REDD+ can benefit from the open policies. However, an increasingly large volume of data needs specific approaches; specifically, handling non-linear data with complex interactions, such as forest and environmental data, requires appropriate tools and software. Data mining, machine learning, and statistical methods possess the ability to analyze very large amounts of data, and are useful in creating predictive and inference models.
The innovative modelling approach (named PREDIT) presented in the first article combines open access remotely sensed data with open source software. The three pillars (efficiency, innovation, and inclusion) are perfectly embedded in the methodological approach presented in the first article. PREDIT is suited to a stepwise framework for developing REDD+. This effective combination can support countries involved in the early phase of REDD+ and would enable wider REDD+ participation: “it represents a starting point for countries that struggle with a critical lack of data, higher uncertainties, and competing interests” (Di Lallo et al., 2017). It is highly efficient as it uses free and open access data. Freely available techniques, such as PREDIT, can also have a critical role in promoting synergies across nations and can boost countries to agree to international treaties, such as REDD+ (Wulder et al., 2012).
Second article
The second article included in the cumulative thesis (Understanding Measurement Reporting and Verification Systems for REDD+ as an Investment for Generating Carbon Benefits) was published in July 2017 in the Forests journal, volume 8, issue 8. It was written by Di Lallo with a substantial contribution made by Köhl. Di Lallo and Köhl developed the idea, which was originally conceived by Köhl. Köhl also coordinated the study. Di Lallo analyzed the data and performed the simulation study. Mundhenk contributed to the analysis of data, the simulation study and revised the quality of the manuscript. Marchetti helped to coordinate the study, and critically revised the quality of the manuscript.
Summary
This article examines three key factors affecting the generation of forest carbon credits from REDD+. The factors are (i) setting Reference Levels (RLs); (ii) carbon credits supplying from emission reductions due to REDD+; (iii) uncertainties in forest carbon emission estimates. We conducted two analysis: a sensitivity analysis and a simulation study.
In the sensitivity analysis, the three factors affecting the avoided emissions (i.e. the forest carbon credits) were ranked according to their impact on the generation of carbon credits. We found that the generation of carbon credits mostly varies as a function of uncertainties in forest carbon monitoring (i.e. according to the monitoring technique adopted). Clearly, RLs influence the number of carbon credits that can be generated and the result-based payment that project managers or countries could receive, however, their actual weight in the mechanism was uncertain. Findings show that RLs impact on the accountable avoided emissions is almost as important as the uncertainties; while the amount of emissions actually reduced has a relatively minor impact.
In the simulation study, we analyzed the interrelationships between the cost of forest carbon monitoring, the associated precision, and the resulting accountable carbon credits. We explored the potential of two approaches for monitoring forest carbon in terms of reliability and costs. The first approach makes use of Lidar data and adopts a model-assisted technique; while the second consists of passive optical data and the use of stratified sampling.
Combining statistically rigorous sampling methods with Lidar data can significantly boost the accountable amount of forest carbon credits that can be claimed. Then we compared the potential result-based payments derived from the adoption of a model-assisted technique using Lidar data with a set of realistic costs. We found that investing in sound, recurrent MRV systems critically determines a country’s potential to generate result-based payments. Therefore, potential result-based payments could pay-off the necessary investment in technology that would enable an accurate estimate of activity
data and emission factors. Conceiving an MRV system as an investment can encourage the implementation of well-defined, long-term monitoring strategies.
Discussion in the thematic context
We investigated three factors that influence the generation of carbon credits: setting reference levels (RLs), supplying emission reduction from avoided deforestation and degradation, and implementing an efficient monitoring system. A thorough understanding of the dynamics between these three factors helps to set up efficient projects —i.e. projects that produce large result-based payments. Findings of the second article show that: (i) uncertainties in forest monitoring mostly influence the potential credits received for reducing emissions and the resulting reward; (ii) uncertainties can be significantly reduced by adopting statistically sound sampling techniques and Lidar-based methods.
We indicated plausible and convenient options useful to analysts and decision-makers to understand how to take full advantage of the REDD+ opportunity. However, whether the MRV system is an effective investment or not can depend on several other factors; countries that decide to invest in innovative monitoring techniques have to carefully evaluate the tradeoff between reliability of a sound MRV and accountable carbon credits produced.
In the second paper, we also pointed out the pivotal role of innovative monitoring techniques, and their positive effect on efficiency of MRV systems. However, innovation is neither simply about the use of high-tech products or big data, nor just about external support and adoption of foreign technology. Innovation means promoting a well-designed, long-lasting strategy and a solid research and development programme. Conceived like this, innovation also promotes inclusion, as it can reduce gaps between developed and developing countries (OECD, 2012). However, it implicates a strong support from both private and public sectors. Even though the engagement the private sector has increased over the last few years, it is still far from being sufficient to cover the near-future REDD+ financial needs. Supporting a greater engagement of privates by introducing cost-effective measures is key for a successful execution of the REDD+ programme (Savaresi, 2016; Streck, 2012).
Developing countries rely on external sources of financing for implementing conservation policies through the REDD+ programme. The monetary support under the REDD+ regime is delivered at the readiness (ex ante) and at the verification phase (ex post), for the emissions effectively avoided. Ex ante funding is necessary, as preparing to perform long, extensive and expensive projects imply a strong engagement and substantial investments. Ex post payment is one novel feature that REDD+ has introduced in international forestry processes aimed at reducing tropical deforestation.
MRV costs (which are part of transaction costs) are mainly afforded at the beginning of projects, hence are charged on readiness funding. They can be very high and greatly influence the overall REDD+ budget. In addition, MRV systems influence uncertainties, which mainly determine the amount of accountable carbon credits, and thus the result-based payments. For this reason, adopting accurate, precise, long-term monitoring strategies is crucial, and conceiving MRV systems as an investment can encourage and incentivize tropical countries to do so.
Part 3. Conclusion of the cumulative dissertation
The debate on the reduction of emissions from deforestation (RED) emerged during the 11th COP, in 2005. Since the 2007 COP, held in Bali, tropical countries (non-annex 1 countries) started developing national strategies for Reducing Emissions from Deforestation and forest Degradation (Pistorius, 2012). In some cases, too high expectations were created, as many countries saw REDD+ as a fast, big transfer of resources to developing countries, or as a cheap way to reduce CO2 emissions. This vision has never materialized, though REDD+ remains an effective and efficient climate change mitigation strategy. Following the enthusiastic reaction for the entrance of REDD+ in the international policy arena, many researchers, politicians, leaders, technicians and various stakeholders have raised concerns that the REDD+ programme will fail to deliver positive results. Clearly, those who expected that REDD+ would have been a quick and simple mechanism for climate mitigation were disappointed. After ten years of activity, is probably time to take stock of the key achievements of REDD+. However, we should not ask, “What are the right measures to reduce emissions from forests?” but rather “What makes REDD+ successful and able to deliver beneficial outcomes?”. Bearing this question in mind, the doctoral research was mainly focused on technical challenges for measuring and monitoring forest areas and carbon stock. In particular, the thesis tried to answer the question by investigating innovative and cost-efficient techniques designed to help developing countries facing the first stages of REDD+.
Pursuing efficiency (representing the third pillar of this thesis) is vital considering the limited government budgets, development aids and the status of REDD+. On the one hand, developing countries involved in REDD+, which often struggle with scarcity of resources, aim to reduce emissions from deforestation and forest degradation and to improve their forest-related policies and governance; though it sometimes means to challenge deep-rooted national development paradigms and existing policy frameworks or policy objectives (Murdiyarso et al., 2012). On the other hand, there is the financial framework of REDD+, which remains uncertain, though some promising signs have emerged, such as the inclusion of the forest sector in the Paris agreement. However, REDD+ dependence on public funding is strong, and considering that it hardly provides adequate and predictable support, private investments are desirable. To encourage the involvement of the private sector as a key partner in REDD+, some parts of the programme would probably need to be redesigned in order to increase cost-effectiveness and reliability.
For an efficient allocation of funds, national and local institutions should identify areas that are prone to near-future deforestation. With the first article we highlighted that projects can take advantage from three elements: available data, methods to handle data, and free and open source software. The open access data policies lead to an increasing
availability of freely and easily accessible forest-related data, which facilitate the participation to REDD+ of developing countries that still have to develop their own data sets. These countries can elaborate their own business-as-usual scenarios to identify and rank potentially suitable areas for REDD+ interventions by adopting the model presented in the first article. We are fully aware that our modelling approach does not shed light on the complex interrelationships amongst the multiple drivers underlying the deforestation processes, neither does it explain links between land-use change processes, their drivers and the involved actors —though understanding them is necessary for a correct implementation of REDD+ (Visseren-Hamakers et al., 2012). We proposed an objective, rapid and efficient way of checking on potential future forestland cover by using available geo-spatial information as a proxy for stakeholder activities.
Efficiency tightly relates to innovation: a key element to shift towards efficiency is the adoption of innovative techniques. For example, the use of big data by adopting novel and innovative types of analytics such as machine learning and artificial intelligence can improve the efficiency and effectiveness of REDD+.
The idea of efficiency formulated in the second paper is different, as it explores monitoring techniques that aim for a maximum generation of carbon credits with minimum expense. We found that Lidar-based monitoring techniques have a positive effect on the efficiency of MRV systems, as the uncertainties are reduced and, consequently, revenues flow derived from result-based payments can be larger than those achievable by using passive optical remote sensing. Supporting the use of Lidar in forest monitoring for the scope of REDD+ needs large investments. Promoting a fertile ground for investments and innovations can expand access to Lidar technology in developing countries. In addition to remote sensing-based forest monitoring methods and technologies, a number of studies have highlighted that the involvement of local people in monitoring activities (e.g. community-based forestry monitoring) can help to safeguard sustainability and equity in forest programmes, such as REDD+ (DeVries et al., 2016; Pratihast et al., 2014).
The third pillar introduced in this thesis is inclusion. The process to take part in REDD+ is long, several steps need to be taken, as well as having to meet rigorous requirements to access international funding opportunities. Strict regulations and protocols seek to ensure the effectiveness of REDD+. Whether a country is eligible as a ‘REDD+ country’ or not depends on a number of factors. For example, good governance, a sound legal framework for protecting the rights of indigenous people and clear land tenure laws are prerequisites for successful REDD+ project (Engel et al., 2010; Pettenella and Brotto, 2012). However, this thesis only focused on aspects concerning forest monitoring. Possessing an MRV system is one essential factor that can determine the successful planning and implementation of REDD+. Given the weak monitoring capacities, many tropical countries still use traditional forest inventories for forest monitoring systems (Mbatu, 2016). This can hinder the access to REDD+ to those
countries that lack an effective accounting system to monitor and keep track of forest cover change and carbon emissions. However, to contribute effectively to climate change mitigation, the REDD+ mechanism needs to involve almost all tropical developing countries. The articles included in this thesis demonstrate that even countries with low monitoring capacities can start developing a project; furthermore, conceiving an MRV system as an investment can encourage them to implement a well-defined, long-term monitoring strategy.
References
Abrams, E.M., Rue, D.J., 1988. The Causes and Consequences of Deforestation among the Prehistoric Maya. Hum. Ecol. 16, 377–395.
Angelsen, A., Ainembabazi, J.H., Bauch, S.C., Herold, M., Verchot, L., Hänsel, G., Schueler, V., Toop, G., Gilbert, A., Eisbrenner, K., 2013. Testing methodologies for REDD+: Deforestation drivers, costs and reference levels. Ecofys.
Angelsen, A., Wertz-Kanounnikoff, S., 2008. What are the key design issues for REDD and the criteria for assessing options?, in: Center for International Forestry Research (Ed.), Moving Ahead with REDD Issues, Options and Implications. Center for International Forestry Research, Bogor, Indonesia, pp. 11–22.
Antinori, C., Sathaye, J., 2007. Assessing Transaction Costs of Project-based Greenhouse Gas Emissions Trading. Ernest Orlando Lawrence Berkeley National Laboratory, Berkeley, California.
Barquín, L., Chacón, M., Panfl, S., Adeleke, A., Florian, E., Triraganon, R., 2014. The Knowledge and Skills Needed to Engage in REDD+: A Competencies Framework, Conservation International, Centro Agronómico Tropical de Investigación y Enseñanza, International Union for the Conservation of Nature, Regional Community Forestry Training Center. ed. Arlington, Virginia, USA. Bonan, G.B., 2008. Forests and Climate Change: Forcings, Feedbacks, and the Climate
Benefits of Forests. Science 320, 1444–1449. doi:10.1126/science.1155121 Bradshaw, C.J., Sodhi, N.S., Brook, B.W., 2009. Tropical turmoil: a biodiversity tragedy
in progress. Front. Ecol. Environ. 7, 79–87. doi:10.1890/070193
Brown, S., Hall, M., Andrasko, K., Ruiz, F., Marzoli, W., Guerrero, G., Masera, O., Dushku, A., DeJong, B., Cornell, J., 2007. Baselines for land-use change in the tropics: application to avoided deforestation projects. Mitig. Adapt. Strateg. Glob. Change 12, 1001–1026. doi:10.1007/s11027-006-9062-5
Buizer, M., Humphreys, D., de Jong, W., 2014. Climate change and deforestation: The evolution of an intersecting policy domain. Clim. Change Deforestation Evol. Intersecting Policy Domain 35, 1–11. doi:10.1016/j.envsci.2013.06.001
Ciais, P., Sabine, C., Bala, G., Bopp, L., Brovkin, V., Canadell, J., Chhabra, A., DeFries, R., Galloway, J., Heimann, M., others, 2014. Carbon and other biogeochemical cycles, in: Climate Change 2013: The Physical Science Basis. Contribution of Working Group I to the Fifth Assessment Report of the Intergovernmental Panel on Climate Change. Cambridge University Press, pp. 465–570.
De Sy, V., Herold, M., Achard, F., Asner, G.P., Held, A., Kellndorfer, J., Verbesselt, J., 2012. Synergies of multiple remote sensing data sources for REDD+ monitoring. Curr. Opin. Environ. Sustain. 4, 696–706. doi:10.1016/j.cosust.2012.09.013 DeVries, B., Pratihast, A.K., Verbesselt, J., Kooistra, L., Herold, M., 2016.
Characterizing Forest Change Using Community-Based Monitoring Data and
Landsat Time Series. PLOS ONE 11, e0147121.