ASA CONFERENCE 2019
Statistics for Health and Well-being
BOOK OF SHORT PAPERS
Maurizio Carpita and Luigi Fabbris
Editors
ASA Conference 2019 - Book od Short Papers Statistics for Health and Well-being University of Brescia, September 25-27, 2019 Maurizio Carpita and Luigi Fabbris (Editors) ISBN: 978-88-5495-135-8 This Book is published only in pdf format. Copyright © 2019 CLEUP sc Cooperativa Libraria Editrice University of Padova via G. Belzoni 118/3 35121 Padova [email protected]
INTRODUCTION
This Book includes a selection of 53 peer-reviewed short papers submitted to the Scientific Conference "Statistics for Health and Well-Being", held at the University of Brescia from 25 to 27 September, 2019.
The Conference, aimed at promoting applications that use statistical techniques and models suitable for health and well-being analyses, was organized by the ASA (Association for Applied Statistics) and the DMS StatLab (Data Methods and Systems Statistical Laboratory) of the Department of Economics and Management, University of Brescia.
The programme of the Conference included 25 parallel sessions with a total of 82 contributions with about 100 attendants, 4 plenary sessions (organised by ISTAT, the Italian National Statistical Institute, and USCI, the Statistical Union Italian Municipalities; SIS, the Italian Statistical Society, and ASA; AICQ-CN, the Italian Association for Quality Culture-North and Centre of Italy, and AISS, the Italian Academy for Six Sigma; and DBSPORTS, Big Data Analytics in Sports Project, respectively) and 4 special events (ISTAT and ASA Open Conference with the President of ISTAT, IASA Sensory Experiment, Visit to Capitolium, and Kick-off meeting ISI-SPG in Sports Statistics). Thank you very much to Eugenio Brentari, Chair of the Local Program Committee. For more information about the programme and other material visit the website www.sa-ijas.org/statistics-for-health-and-well-being/.
As co-chairs of the ASA Conference 2019, we are very grateful to the authors for submitting their interesting research with various real application of statistics in so many contexts of health and well-being, and to the members of the Scientific Committee for collaborating to the peer-reviewing process. October, 2019 Co-chair Scientific Program Committee Maurizio Carpita Luigi Fabbris University of Brescia University of Padova
Conference session topics include, but are not limited to, the following areas of special interest: Health and healthcare
Education and health Health Psychology Work and life balance Economic well-being
Social relationships and social health Welfare and well-being
Safety and security Subjective well-being Environment and pollution
Innovation, research and creativity Quality of health services
Equitable and sustainable well-being
Resilience and vulnerability Sport, Health and wellbeing Sport analytics
Health and fitness Sport psychology Statistics and tourism
Food and beverage, health, well-being and life quality Qualitative and quantitative methods for sensory analysis Psychology and food
Food and beverage industries and markets
Methods and models for health and well-being analysis Technology for health analysis
Scientific Program Committee: Local Program Committee:
Luigi Fabbris (University of Padua, co-chair) Maurizio Carpita (University of Brescia, co-chair) Giuseppe Arbia (SIS - Università Cattolica di Milano) Rossella Berni (University of Florence)
Matilde Bini (SIS - European University of Rome) Giovanna Boccuzzo (University of Padova) Eugenio Brentari (University of Brescia) Vittoria Buratta (ISTAT)
Giulia Cavrini (University of Bolzano-Bozen)
Alessandro Celegato (AICQ-AISS, PSV Project Service and Value) Giuliana Coccia (ISTAT)
Adriano Decarli (University of Milan)
Tonio Di Battista (‘G. D’Annunzio’ University of Chieti and Pescara) Simone Di Zio (‘G. D’Annunzio’ University of Chieti and Pescara) Benito Vittorio Frosini (Sacred Heart Catholic University of Milan) Antonio Giusti (University of Florence)
Silvia Golia (University of Brescia)
Maria Gabriella Grassia (Federico II University of Naples) Maria Iannario (Federico II University of Naples)
Domenica Fioredistella Iezzi (Tor Vergata University of Rome) Michele Lalla (University of Modena and Reggio Emilia) Fabio Lucidi (SIPSA - La Sapienza University of Rome) Marica Manisera (University of Brescia)
Paolo Mariani (University of Milan-Bicocca) Francesco Mola (University of Cagliari)
Antonio Mussino (La Sapienza University of Rome) Luigi Odello (International Academy of Sensory Analysis) Francesco Palumbo (Federico II University of Naples) Maurizio Pessato (Assirm)
Alessandra Petrucci (University of Florence) Alfonso Piscitelli (Federico II University of Naples) Marco Trentini (Unione Statistica Comuni Italiani) Fabio Vernau (Federico II University of Naples) Domenico Vistocco (Federico II University of Naples) Paola Zuccolotto (University of Brescia)
Eugenio Brentari (University of Brescia, chair) Maurizio Carpita (University of Brescia) Silvia Golia (University of Brescia) Marica Manisera (University of Brescia) Manlio Migliorati (University of Brescia) Anna Simonetto (University of Brescia) Marika Vezzoli (University of Brescia)
Mariangela Zenga (University of Milano-Bicocca) Paola Zola (University of Brescia)
Paola Zuccolotto (University of Brescia)
Visit to the Capitolium. Brescia, 26th September 2019
INDEX OF SHORT PAPERS
Giuseppe Alfonzetti, Laura Rizzi, Luca Grassetti, Michele Gobbato
Observed expenditures vs estimated burden of health care: a comparative evaluation based on spatial analysis ... pag. 1 Pietro Amenta, Antonio Lucadamo, Gabriella Marcarelli
Computing ordinal consistency thresholds for pairwise comparison matrices ... pag. 5 Ilaria Lucrezia Amerise, Agostino Tarsitano
Household wealth and consumption in Italy: analysis by density-weighted quantile regression ... pag. 9 Fabrizio Antolinia, Francesco Giovanni Truglia
Ecotourism and food geographic areas ... pag. 13 Bruno Arpino, Silvia Bacci, Leonardo Grilli, Raffaele Guetto, Carla Rampichini
Issues in prior achievement adjustment for value added analysis: an application to Invalsi tests in Italian schools ... pag. 17 Silvia Bacci, Bruno Bertaccini, Alessandra Petrucci
Museum preferences analysis: an item response model applied to network data ... pag. 21 Chiara Bocci, Silvana Salvini
Elderly with and without children: do they report different health conditions? ... pag. 25 Chiara Bocci, Laura Grassini, Emilia Rocco
A multi-inflated hurdle regression model for the total number of overnight stays of Italian tourists in the years of the economic recession ... pag. 29 Riccardo Borgia, Elena Castellari, Paolo Sckokai
Family lifestyle habits: what is passed down from adults to children? ... pag. 33 Elena Bortolato, Luigi Fabbris, Marco Vivian
Quantity and mood of final open-ended comments on an Erasmus+ VET mobility questionnaire pag. 37 Rafaela Soares Bueno, Luiz Sá Lucas, Ana Carolina Sá Lucas
Balancing multi-class imbalanced data into a training dataset using SCUT method ... pag. 41 Stefania Capecchi, Carmela Cappelli, Maurizio Curtarelli, Francesca Di Iorio
Investigating well-being at work via composite indicators ... pag. 45 Maurizio Carpita, Enrico Ciavolino, Paola Pasca
Exploring the statistical structure of soccer team performance variables using the Principal Covariates Regression ... pag. 49 Maurizio Carpita
The mobile phone big data tell the story of the impact of Christo's The Floating Piers on the Lake Iseo ... pag. 53 Daniela Caso, Maria Iannario, Francesco Palumbo
Athletes’ mental skills, personality and other drivers to assess the performance in a study on volleyball ... pag. 57 Rosanna Cataldo, Maria Gabriella Grassia, Marina Marino
Partial Least Squares Path Modelling approach for sustainability using qualitative information ... pag. 61 Carlo Cavicchia, Pasquale Sarnacchiaro, Maurizio Vichi
A composite indicator via hierarchical disjoint factor analysis for measuring the Italian football teams’ performances ... pag. 65
Giulia Cavrini, Andrea Lazzerini
The determinants of vaccination behaviour of general practitioners in South Tyrol: Differences and similarities between Italian and German respondents ... pag. 69 Anna Crisci, Luigi D’Ambra
Analysis of the financial performance in Italian football championship clubs via longitudinal count data and diagnostic test ... pag. 73 Angela Maria D'Uggento, Nunziata Ribecco, Ernesto Toma, Ignazio Grattagliano
Cyberbullying: a threat for relationships and social health ... pag. 77 Cristina Davino, Pasquale Dolce, Stefania Taralli, Domenico Vistocco
Quantile Composite-based path modelling to handle differences in territorial well-being ... pag. 81 Gioia Di Credico, Jerry Polesel, Luigino Dal Maso,Carlo La Vecchia, Francesco Pauli, Nicola Torelli, Valeria Edefonti
Modeling the joint effect of intensity and duration of alcohol drinking with bivariate spline models pag. 85 Matteo Di Maso, Laura Tomaino, Monica Ferraroni, Carlo La Vecchia, Valeria Edefonti, Francesca Bravi
Potential impact fraction for a continuous risk factor: assessing the burden of oral and pharyngeal cancer according to the adherence to the healthy eating index ... pag. 89 Leonardo Egidi, Nicola Torelli
Comparing statistical models and machine learning algorithms in predicting football outcomes .. pag. 93 Rosa Fabbricatore, Carla Galluccio, Cristina Davino, Daniela Pacella, Domenico Vistocco, Francesco Palumbo
The effects of attitude towards Statistics and Math knowledge on Statistical anxiety: a path model approach ... pag. 97 Luigi Fabbris, Alessandra Andreotti, Bruno Genetti, Paolo Vian, Claudia Mortali, Luisa Mastrobattista, Adele Minutillo, Roberta Pacifici
Personal and familial determinants of gambling risk among adolescent Italian students ... pag. 101 Francesca Fortuna, Giulia Caruso, Tonio Di Battista
A functional data analysis of Google Trends on health and wellness ... pag. 105 Alberto Franci, Pietro Renzi
Measuring health inequalities: some application in Marche region ... pag. 109 Carlotta Galeone, Rossella Bonzi, Federica Turati, Claudio Pelucchi, Carlo La Vecchia
Socioeconomic inequalities and cancer risk: the challenges and opportunities of worldwide epidemiological data consortia ... pag. 113 Ilaria Giordani, Gaia Arosio, Ilaria Battiston, Francesco Archetti
A data analytics framework: medical prescription pattern dynamics ... pag. 117 Laura Giuntoli, Giulio Vidotto
Applying network modelling to uncover the relationships among well-being dimensions ... pag. 121 Francesca Greco, Silvia Monaco, Michela Di Trani, Barbara Cordella
Emotional text mining and health psychology: the culture of organ donation in Spain ... pag. 125 Elena Grimaccia, Alessia Naccarato
Validation of a food insecurity scale through structural equation models ... pag. 129 Maria Iannario, Domenico Vistocco, Maria Clelia Zurlo
A mixture model with discrete variables for depression diagnosis in infertile couples ... pag. 133 Rosaria Lombardo, Ida Camminatiello, Antonello D’Ambra
Alessandro Lubisco, Stefania Mignani, Carlo Trivisano
Assessment of game actions performance in water polo: a data analytic approach ... pag. 141 Luiz Sá Lucas, Ana Carolina Sá Lucas, Rafaela Bueno
Selecting features for Machine Learning in Alzheimer’s diagnostics ... pag. 145 Paolo Mariani, Andrea Marletta, Nicholas Missineo
Missing values in social media: an application on Twitter data ... pag. 149 Milica Maricic
Application of multivariate statistics in sports: exploration of recall and recognition of UEFA Champions League sponsors ... pag. 153 Daria Mendola, Paolo Li Donni
Short-run and long-run persistence of bad health among elderly ... pag. 157 Vittorio Nicolardi, Caterina Marini
Harmonised Administrative Databases: a new approach in the era of Big Data ... pag. 161 Antonio Notarnicola, Vito Santarcangelo, Nicola Martullib, Francesco Abbondanza
The blockchain for the certification of the dairy supply chain, the “Lucanum” basket and the bakery products for well-being ... pag. 165 Omar Paccagnella, Ilaria Zanin
Another look at the relationship between perceived well-being and income satisfaction ... pag. 169 Anna Parola, Francesco Palumbo
Profile pattern of italians NEET by nonlinear PCA ... pag. 173 Anna Maria Parroco, Vincenzo Giuseppe Genova, Laura Mancuso, Francesca Giannone
Assessing mental health therapeutic communities functioning ... pag. 177 Eugenio Pomarici, Alfonso Piscitelli, Luigi Fabbris, Raffaele Sacchi
A pre-post sensory experiment on the effect of a seminar on olive oil preferences of Italian consumers ... pag. 181 Luca Romagnoli, Luigi Mastronardi
Understanding local administrations policies effects on well-being in Italian inner areas ... pag. 185 Vito Santarcangelo, Emilio Massa, Diego Carmine Sinitò, Giuseppe Scavone
Intelligent systems to support patients ... pag. 189 Anna Simonetto, Silvia Golia, Buirma Malo, Gianni Gilioli
Food quality perception in children: a comparison between Bayesian Network and Structural Equation Modelling ... pag. 193 Federico M. Stefanini, Yura Loscalzo
The studyholism comprehensive model: towards a bayesian reanalysis ... pag. 197 Alessio Surian, Andrea Sciandra
City Prosperity Index: a comparative analysis of Latin American and Mediterranean cities based on well-being and social inclusion features ... pag. 201 Emma Zavarrone, Maria Gabriella Grassia, Rocco Mazza
Invariance in the structural topic models ... pag. 205 Paola Zola, Costantino Ragno, Paulo Cortez
Inferring Twitter users home location based on trend topics ... pag. 209
The mobile phone big data tell the story of the impact
of Christo's The Floating Piers on the Lake Iseo
Maurizio Carpita
Department of Economics and Management, University of Brescia, Italy;
DMS StatLab - Data Methods and Systems Statistical Laboratory, University of Brescia, Italy.
1. Short story of Christo's The Floating Piers
"Those who experienced The Floating Piers felt like they were walking on water – or perhaps the back of a whale. The light and water transformed the bright yellow fabric to shades of red and gold throughout the sixteen days."
Christo
Figure 1: Christo's The Floating Piers (christojeanneclaude.net/projects/the-floating-piers).
From June 18 through July 3 2016, the Italian Lake Iseo was reimagined, with an international event, The Floating Piers (Figure 1), which was free and open to the people. It was a temporary art installation on the water created - using canvases, cables and metal structures - by the contemporary artist Christo Vladimiroff Javacheff (1935-), originally conceived in 1970 together with his wife Jeanne-Claude Denat de Guillebon (1935-2009) as a 3-kilometer-long walkway, that crossed the shores of Lake Iseo (about 100 kilometers east of Milan), from Sulzano to Monte Isola and to the San Paolo’s island (Figure 1). Local authorities estimated that 1,2 million people visited the site in the sixteen days of The Floating Piers event, an average of 72,000 visitors per day in an area where usually there are about 12,000 residents. Other sources (marketingdelterritorio.info) estimated 1,5 million visitors, with a daily average of 100,000 attendances and the peak of 115,000 attendances reached on Friday July 1, 2016. In 2019 the documentary of Andrey Paounov Christo Walking on Water told the story of The Floating Piers adventure, also remembering some controversies with the local administrations due to the danger that the pontoons would not been able to hold up to the continuous crowds.
In the smart city era, mobile phone big data are increasingly used to detecting presence and quantifying the number of people at a given moment in time with reference to a more or less wide area of interest. Analytics derived from mobile phone big data are very useful and used to understand city usage and mobility pattern, and to monitor big social events (Zanini et al., 2016; Manfredini et al., 2015; Carpita and Simonetto, 2014).
In this study, the mobile phone big data and the statistical approach are used to quantifying the impact of The Floating Piers event on the area of the Lake Iseo in summer of 2016.
ASA Conference 2019 - Book of Short Papers
Maurizio Carpita and Luigi Fabbris (Editors) Statistics for Health and Well-being Brescia, September 25-27, 2019
CLEUP Coop. Libraria Editrice
2. TIM big data structure and the statistical methodology
Thanks to a two-years agreement between the Statistical Office of the Municipality of Brescia and Telecom Italia Mobile (TIM), the DMS StatLab research team (sites.google.com /a/unibs.it/dms-statlab/) had access to the TIM mobile phone activity recorded in the period from April 1 2014 to August 11 2016 for the Province of Brescia1.
Mobile phone big data are geo-referred data collected over a spatial grid and characterized by its latitude and longitude, and over the time. The simpler object containing this information is named pixel or cell, the elementary component of each Geographic Information System (GIS) that allows to gather, organize, manage, analyze, combine, develop and present geographically located information. The TIM big data for the Province of Brescia are into 923x607 pixel of 150 m2 size each, available at intervals of 15 minutes, for a total of more than 40,000 millions of records collected (Metulini and Carpita, 2019). For each pixel and time interval, the corresponding record refers to the density (estimated average number) of mobile phones simultaneously connected to the TIM network in that geographic area and time interval. The mobility feature of these data is hidden and is not possible to trace the single TIM user over time. In the standard setting of geo-statistical analysis, a rectangle union of many pixels that cover an area of interest for the study is named raster.
In this study, the statistical procedure used to analyze raster big data is based on the Histogram of Oriented Gradients (HOG) method, that's a feature descriptor widely used successfully for object detection, pattern recognition and image compression (Tomasi, 2012). The HOG represents an image (in this case a raster) as a unidimensional feature vector, that can be analyzed using standard statistical procedures. In brief, the HOG procedure is the following. First, each raster is partitioned into smaller rasters, and for each pixel of these sub-rasters the vector of gradients 𝒈 = (𝑔!, 𝑔!) (differences right − left = 𝑔! and up − down = 𝑔!
of density around the pixel) are computed. Second, for each 𝒈 two measures are computed: 𝑀𝑎𝑔𝑛𝑖𝑡𝑢𝑑𝑒 = ||𝒈|| = 𝑔!!+ 𝑔
!! and 𝐷𝑖𝑟𝑒𝑐𝑡𝑖𝑜𝑛 = arctan(𝑔!/𝑔!) .
The final HOG object for each smaller raster is obtained binning the Directions and sum the Magnitudes for each bin; the final HOG vector of the full raster is obtained stacking the vectors of its smaller rasters. The matrix X, which has in column the days of the period of interest and in row the stacked HOGs for the 96 quarters of each day, was created and used with the k-means cluster analysis to classify the daily profiles (Metulini and Carpita, 2019).
3. Analysis and results of Christo's The Floating Piers impact
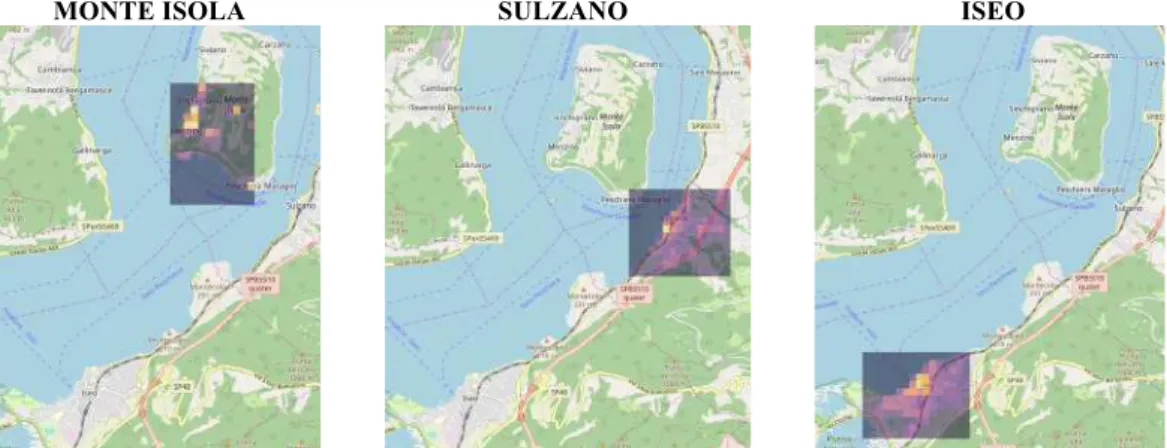
After a preliminary exploration of the area of interest, one decided to considered three rasters on the Lake Iseo side in the Province of Brescia that in the summer of 2016 were the residential areas mainly affected by The Floating Piers event (Figure 2). The first raster includes Monte Isola, the largest inhabited and car-free island of European lakes with about 1,800 residents, that has joined the Club of the most beautiful villages in Italy. The second raster includes the municipality of Sulzano, which dates back to Roman times and is a small village of about 2,000 residents just in front of the Monte Isola Island, and where the most important activities are related to tourism and sailing. The third and last raster includes Iseo, a town of about 9,000 residents major tourist center on the south-eastern shore of Lake Iseo, about 20 kilometers north of Brescia; in Roman times, Iseo was crossed by an important Roman consular road that connected Brescia to Val Camonica along Lake Iseo, and today this town is part of the famous Franciacorta wine region.
1
Many thanks to Rodolfo Metulini (DMS StatLab, University of Brescia) and Marie Cointin (Institut Universitaire de Technologie, Université de Bretagne Sud), that worked with me to this research, and to Marco Trentini of the Municipality of Brescia to support this research.
ASA Conference 2019 - Book of Short Papers
Maurizio Carpita and Luigi Fabbris (Editors) Statistics for Health and Well-being Brescia, September 25-27, 2019
CLEUP Coop. Libraria Editrice
MONTE ISOLA SULZANO ISEO
Figure 2: The three TIM rasters of the Lake Iseo area considered for the analysis. Dark colors signal absence of TIM users, more bright colors signal presence of TIM users.
The R AnalyticFlow (RAF)2 interface (Figure 3) was used to develop the ETL (Extraction, transformation and Loading) with the HOG procedure of the TIM mobile phone big data for the three rasters on the Lake Iseo
Figure 3: RAF 3-step ETL with HOG procedure for TIM big data and The Floating Piers analysis. Using the k-mean cluster analysis of the HOGs respectively of June 2015 and 2016, the scree-plot supports the choice of 4 clusters of days: in 2015 the four clusters have about the same number of days, whereas in the month of The Floating Piers the cluster 4 contains about 50% of the days. Inspection of data shows that in this cluster there are days of the second half of June, the period of The Floating Piers event.
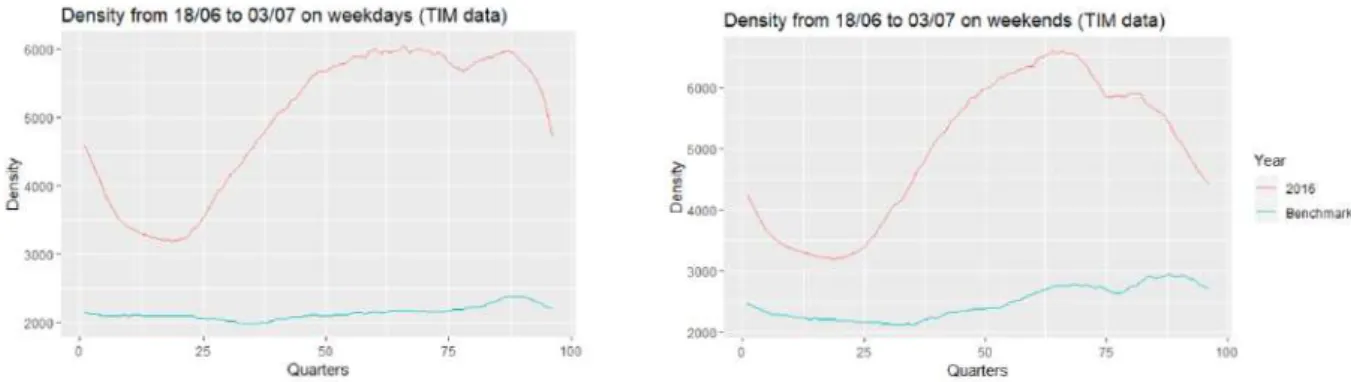
Figure 4 shows the median TIM density profile (hereafter profile) for weekdays (left) and weekends (right) in the 96 quarters of the day considered as the Benchmark (days of June and July 2014 and 2015) and for The Floating Piers (from 16 June to 3 July 2016). The range of the Benckmark profile is from 2,000 (around 6 am) to 2,500 (around 10 pm) in weekdays and reaches 3,000 in weekends. Applying the moltiplicative factor of 5 (i.e. assuming the TIM market share of 20%)3, the estimated daily average people in the three areas of the Lake Iseo in June and July 2014 and 2015 was 10,000-12,500 in weekdays and reaches 15,000 in weekends; these estimates are consistent with the official statistics. The Floating Piers profile is very much higher: its range is from 3,000 to 6,000 in weekdays and reaches 6,500 in weekends, so that the estimated daily average people in the three areas of the Lake Iseo in the 16 days of the event was 15,000-30,000 in weekdays and reaches 32,500 in weekends.
2The R AnalyticFlow (r.analyticflow.com) is an open source data analysis tool with an intuitive user
interface based on the R language and environment for statistical computing.
3
For the newspaper ilSole24Ore (Finanza & Mercati, 2016-12-29), in 2016 the national market share of TIM was 30,3%: we use 20%, considering the lower estimate (22,5%) obtained in another study (Metulini and Carpita, 2019) and that during June and July there are many tourists not TIM users.
ASA Conference 2019 - Book of Short Papers
Maurizio Carpita and Luigi Fabbris (Editors) Statistics for Health and Well-being Brescia, September 25-27, 2019
CLEUP Coop. Libraria Editrice
Figure 4: Benchmark and The Floating Piers profiles for weekdays and weekends.
Figure 5 tells the story of Christo's art installation impact on the Lake Iseo during the 16 days of the event. The Floating Piers profile is 2-3 times higher than the Benchmark profile and the people that visited the piers on the water increased in the period (the media effect has played an important role on this evidence). Applying the multiplicative factor of 5 to the two profiles, in the area of the Lake Iseo for the second half of June the estimated benchmark range is 10,000-15,000 people per day, whereas from June 18 through July 3 2016 the estimate of the daily attendances increases to 22,500-32,500 (+45%). As the installation was open from 8 am to 10 pm (14 hours), assuming an average time for the visit of about 4 hours, the median of the daily number of visitors of The Floating Piers is estimated from about 78,000 to about 115,000 on Friday July 1, 2016, results consistent with the official statistics.
Figure 5. Benchmank and The Floating Piers profiles for the 16 days of the event.
References
Carpita, M., Simonetto, A. (2014). Big data to monitor big social events: Analysing the mobile phone signals in the Brescia smart city. Electronic Journal of Applied Statistical Analysis: Decision Support Systems, 5(1), pp. 31-41.
Manfredini, F., Pucci, P., Secchi, P., Tagliolato, P., Vantini, S., Vitelli, V. (2015). Treelet decomposition of mobile phone data for deriving city usage and mobility pattern in the Milan urban region. In Advances in complex data modeling and computational methods in statistics, eds. A.M. Paganoni and P. Secchi, Springer International Publ., pp. 133-147. Metulini, R., Carpita, M. (2019). A strategy for the matching of mobile phone signals with
census data. In SIS 2019 Conference: Smart Statistics for Smart Applications - Book of short papers, eds G. Arbia, S. Peluso, A. Pini and G. Rivellini, Pearson, pp. 427-434. Available at: arxiv.org/pdf/1906. 11739.pdf.
Tomasi, C. (2012). Histograms of oriented gradients. Computer Vision Sampler, pp. 1-6. Update version available at: www2.cs.duke.edu/courses/fall15/compsci527/notes/hog.pdf Zanini, P., Shen, H., Truong, Y. (2016). Understanding resident mobility in Milan through
independent component analysis of Telecom Italia mobile usage data. The Annals of Applied Statistics, 10(2), pp. 812-833.
ASA Conference 2019 - Book of Short Papers
Maurizio Carpita and Luigi Fabbris (Editors) Statistics for Health and Well-being Brescia, September 25-27, 2019
CLEUP Coop. Libraria Editrice