Proteomics investigation of human platelets by shotgun nUPLC-MSE
and 2DE experimental strategies: a comparative study
Francesco Finamore
1,2, Luisa Pieroni
1,2#, Maurizio Ronci
1,2, Valeria Marzano
1,2,
Stefano Levi Mortera
1,2,
Mario Romano
3,4, Claudio Cortese
2, Giorgio Federici
2,5, Andrea Urbani
1,21IRCCS-Santa Lucia Foundation, Rome; 2Department of Internal Medicine, University "Tor Vergata", Rome; 3Centro Studi sull’Invecchiamento (CeSI), Fondazione università "G. d’Annunzio", Chieti; 4Department of
Biomedical Sciences, University "G. d’Annunzio", Chieti;5Ospedale Pediatrico Bambino Gesù, Roma; Italy.
Background. Platelets, the smallest human blood cells component, have a key role in the
control of haemostasis and thrombosis but they have also been shown to be implicated in a number of different pathological states because of their involvement also in the process of inflammation end its resolution .Their peculiar anucleated morphology render the proteomics an intriguing approach to understand their biology. Given the high impact of platelet in different diseases we have started a systematic investigation of protein repertoire in controlled platelet preparation.
Material and methods. Platelets have been extracted from blood of healthy donors (n=6)
collected by venipuncture in Vacutainer. The quality of the preparation was assessed by observation and enumeration in a Bürker chamber with a conventional tissue culture microscope. To characterize human platelets proteome we analysed the pool of purified platelets combining two proteomic approaches: 2-DE separation combined with Mass Spectrometry and nanoscale ultra performances LC-MSE shotgun proteomics experiments.
Results. The 2D gel analysis leads an average of 1900 protein spots, after the filtering of
“noise” and “false positive” spots, over 500 were selected to be eligible for further analysis given their optimal spot quality value. To perform the analysis by ion accounting shotgun proteomic approach, based on nano ultra performance liquid chromatography (nUPLC) coupled to MSE processing of continuum LC-MS data, the same pool of samples was subject to liquid phase tryptic digestion and the peptide obtained used for the experiments. All the data obtained were analysed using ProteinLynx GlobalServer v2.3 (PLGS, Waters). Three analytical replicates run were acquire in high/low energy modes and associated to a human protein database returning the identification of 100 distinct genes. Comparative analysis of the Gene Ontology has been performed to evaluate the differential functional representation of the molecular repertoire investigated with these two orthogonal approaches.
Discussion. The overall molecular function classification revealed differences between the
two proteomic approaches. In particular, we found significant differences in cytoskeletal proteins (19.65% 2-DE versus 45.60 Shotgun) and receptors (0,92% 2-DE versus 6.90% Shotgun).
Keywords: platelets, proteome, mass spectrometry (MS), gene onthology.
Introduction
Platelets are the smallest blood circulating cells involved in several biological processes such as haemostasis, wound repair, inflammation and pathological events causing cardiovascular diseases,
including stroke and myocardial infarction1–5. Platelets
arise from fragmentation of membrane-delimited cytoplasmic area of terminally differentiated
megakaryocytes, located in the bone marrow1.
been recognized in platelets2, their anucleate nature
renders genomic and transcriptomic techniques not very suitable for genotypic characterization, nevertheless significant analysis can be carried out on platelet protein level. In this respect, available proteomics technologies offers huge sensitivity, in terms of characterization, quantitation and identification of the proteins content of biological samples, thus representing very promising tools for the comprehensive research of platelet biology. At the beginning of the proteomics era the platelet proteome has principally been investigated by high-resolution 2-D IEF/SDS-PAGE maps as primary separation technique6-10. However, this technique is not very
efficient for the separation of several kind of proteins such as, for instance, hydrophobic proteins. Hydrophobic proteins, in fact, tend to aggregate and precipitate when they reach their pI, which represents the point of their lowest solubility. As a consequence, these proteins will be underrepresented in the second dimension gel. Moreover an analysis only based on protein separation studies can be affected by protein changes or degradation due to long term storage of the analyte, that's why alternative approaches, such as peptide analysis based strategies, mainly used for quantitation studies, has been more recently shown to be a necessary complement to have a whole image of the entire expression profile of a sample11,12.
Therefore, in this study, we have employed two different but complementary approaches, namely the classic 2-DE, in association with mass analysis and nanoscale ultra-performance LC-MSE. We compared
these techniques for sensibility, accuracy and data reproducibility and we consistently observed that combining these techniques resulted in a more detailed characterization of the platelet proteome.
Improving advances in proteomics technologies achieved in the last decade, leads to the possibility to find platelets proteomes available in several integrated database and the combination with transcriptomes data allowed the generation of comprehensive in silico model of platelets specific interactomes and platelets phosphorylations and kinases functional map13,14.
In our study we carried out a meta-analysis by bioinformatic investigation employing The
PANTHER (Protein ANalysis THrough Evolutionary
Relationships) Classification System15 combining
both our experimental data with bibliographic
references9 to estimate the functional distribution of
the identified proteins. Materials and methods
Platelet preparation and protein isolation
Blood samples, collected in sodium citrate-containing tubes were obtained from six healthy volunteers. Each blood sample was processed individually by adding acid citrate dextrose (ACD) (45 mM sodium citrate, 25 mM citric acid, 80 mM D-glucose) and centrifuged for 15 min at 150 × g at room temperature to obtain the platelet rich plasma (PRP). The upper third of the PRP was centrifuged at the same conditions to remove any contaminating leukocytes. Platelets were pelleted at 1000 × g and washed in ACD twice. Purity of isolated platelets was confirmed by microscopic inspection and a percentage of leukocite contamination < 0.02% and of RBC < 1% was calculated. Pellets were suspended in 200 µl sample buffer (7 M urea, 2 M thiourea, 40 mM Tris pH 7,5, CHAPS 4%, DTT 50 mM). The extracted proteins were subjected to precipitation with a solution of ice-cold acetone, ethanol and methanol at –20 °C overnight and then air-dried. Proteins were suspended in 6 M urea dissolved in 100 mM Tris pH 7,5 and protein concentration was determined by the Bradford method. Individual samples were pooled and subjected to 2-DE and nUPLC-MSE analysis.
2-DE
2-DE was performed using the IPGphor II (Amersham Biosciences) as previously described9
with some modifications. Proteins (triplicates of 100 µg for each condition) were loaded on a pH 3-10 NL IPG strips by in-gel rehydratation for 8 h at the voltage of 30V. Proteins were electrofocused at 80000 V/h at a maximum voltage of 8000V. After focusing, IPG strips were subjected to protein reduction and alkylation by two sequential immersion in the equilibration buffer containing 1% DTT for 10 min, and in the equilibration buffer containing 4% iodoacetamide for 10 min. Then, IPG strips were loaded at the top of 8-16% polyacrylamide linear gradient gels for the separation in second dimension. SDS-PAGE was carried out at a constant current of 40 mA per gel. Gels were stained by a silver staining protocol compatible with MS18. Image analysis was
software. Statistical analysis of differential protein expression was performed by the Student's T-test. Changes were considered significant at p = 0,05.
Protein excision and tryptic digestion
Protein spots were excised manually and transferred to eppendorf tubes (0,2 mL). Protein-containing gel pieces were destained with 200 µL of 30 mM K3Fe(CN)6 and 100 mM Na2S2O3 and then washed with sequential incubation in 100 µL of 0,1 M ammonium bicarbonate and dried with 100 µL of 100% ACN. Gel immobilised proteins were reduced with 10 mM DTT, alkylated with 55 mM iodoacetamide and subsequently reswollen with 10 ng/µL trypsin in 50 mM ammonium bicarbonate and digested overnight at 37 °C. Peptides were purified and concentrated by solid phase extraction (SPE) in ZipTip C18 pipette tips (Millipore) and spotted directly onto a MALDI target upon elution with 2 µL of CHCA matrix (5 mg/mL in 50% ACN, 0,1% TFA).
Protein identification by MS
MALDI-MS and MALDI-MS/MS were performed on an UltraFlex III MALDI-TOF/TOF mass spectrometer (Bruker-Daltonik, Bremen, Germany). Data were acquired in positive reflectron mode. Two hundred shots per spectrum were accumulated. All acquisition were performed in a mass range of 700-3500 Thomson (m/z) with voltages of 25 and 21.7 kV for the first and second ion extraction stages, 9 kV for the lens, 26.3 and 13.8 kV for reflector 1 and 2 respectively. Quadratic external calibration of TOF was performed on monoisotopic mass of bradykinin (clip 1-7) [M+H]+, angiotensin II [M+H]+, angiotensin I [M+H]+, substance P [M+H]+, bombesin [M+H]+, ACTH (clip 1-17) [M+H]+, ACTH (clip 18-39) [M+H]+, somatostatin [M+H]+. MS and MS/MS data were analyzed by the Bruker FlexAnalysis 3.0 software. Peptide mass fingerprint obtained from MS analysis were used for protein identification in the Swiss-Prot database using the peptide search routine MASCOT (http://www.matrixscience.com). All peptide mass values were considered mono-isotopic and mass tolerance was set at 50 ppm. MASCOT scores greater than 56 were considered significant (p = 0,05). For MS/MS analysis, peaks were searched against the Swiss-Prot database, using the same setting of MS analysis, with a fragment tolerance of 0,3 Da.
Protein identification by nUPLC-MSE
Samples (25 µg of total protein for each pool) were diluted in 25 µL 6 M urea in 100 mM Tris pH 7,5. Proteins were reduced in the presence of 10 mM DTT for 1 h at 37 °C and subsequently alkylated with 20 mM iodoacetamide for 1 h at RT in the dark. Modified proteins were digested with 1 µL of 0,5 µg/µL trypsin solution at 37 °C overnight. The reaction was stopped by adding 1 µL of TFA 10% (v/v). A 2 µL aliquot of the digested peptides was loaded, three times for each pool, on the nano-ACQUITY UPLC™ chromatographic system. Peptides were trapped on a 5 µm Symmetry C18 column (180 µm × 620 mm) and washed for 10 min at 5 µL/min with mobile phase A (0.1% FA). Peptides were then eluted and separated using a 200 min RP gradient at 300 nL/min (3-40% ACN over 120 min) on a 1.7 mm BEH 130 C18 NanoEase™ (75 µm × 625 cm) nanoscale LC column. The column temperature was set at 50 °C. Lock mass ([Glu1]-fibrinopeptide B, 250 fmol/mL) was constantly infused by the NanoAcquity auxiliary pump at a constant flow rate of 250 nL/min. The Q-Tof Premier™ mass spectrometer was programmed to switch between low (4 eV) and high (15-40 eV) energies in the collision cell, with a scan time of 1.5 s per function over a mass range of 50-1990 Th.
LC-MSE data were processed with ProteinLynx
GlobalServer v2.3 (Waters) and searched in the associated human protein database (UniProtKB/ SwissProt Protein Knowledge Base, Release 56.0, July 2008.)
Bioinformatic pathway analysis
Proteins identified by 2DE and LC-MSE were
combined with bibliographic references9 in a unique
dataset and uploaded into PANTHER (Protein ANalysis THrough Evolutionary Relationships) Classification System available online on the free web site http://www.pantherdb.org/, PANTHER Pathway version 2.5 released on line on January 06, 2009. This software allows to predict function using published scientific experimental evidence and evolutionary relationships. Proteins are classified by expert biologists into families and subfamilies of shared function, which are then categorized by molecular function and biological process ontology terms and detailed biochemical interactions are included in canonical pathways and can be viewed interactively15-17.
Results and discussion
Mapping platelets proteome
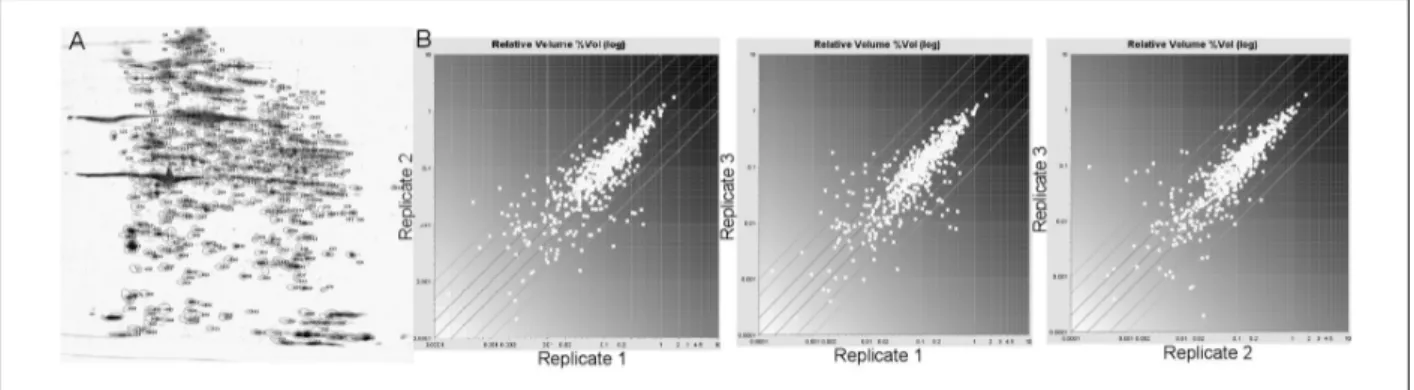
The initial analysis of platelet proteome was carried out on silver stained 2-DE maps of platelets proteins pools, solubilised under reducing condition and in the presence of urea, thiourea and CHAPS. These experimental conditions allowed effective separation and representation of platelet proteins by 2-DE over a broad range of pH gradient for the IEF steps. The 2D gels of platelet proteins were characterized also by the presence of contaminant plasma proteins, such as albumin, present in large amount, haemoglobin and some members of the apolipoprotein family. From imaging analysis by DECODON Delta 2D software, we obtained more than 1,900 distinct spots, which were compared with each other. We search for spots with a significantly high spot volume (>0.5 %Vol) and we obtained more than 500 spots matching these criteria (Figure 1A).
Regardless biological and gel-to-gel variation, the majority of these protein spots were found to be reproducible across the three gels. Binary comparison of the log ratios of the relative spot volumes gave the degree of variation among the three replicates. Deviation from the main 45-degree diagonal line reflects fold changes of spot volumes (Figure 1B).
The protein spot separation pattern of the three replicates is consistent with previously published work8,9 done under the same conditions of pI and MW
range. In order to confirm these correspondence and the related purity of our preparation, some protein spots were selected as reference points, excised from the gel, trypsin-digested and subjected to MS analysis. Comparative analysis of experimental identification
versus reference proteins identified by O'Neill et al.9
was successful, even though some of these proteins, in particular the big ones (e.g. talin), appeared in different gel position respect to the theoretical molecular weight and pI, probably because of post translational modification or sample degradation.
In order to obtain a better characterization of platelet proteome, thus overcoming the limitations of 2-DE, we decided to complement the analysis with the recently-developed nano LC-MSE.
Platelet shotgun proteomics investigation
Total protein extracts were digested and analyzed in triplicate run injections. All extracted peptides were subjected to an alternate scanning acquisition method, designed to obtain high resolution and accurate mass information for each detected precursor and any associated fragments. The acquisition mode was configured to alternate between two collision energy conditions. Low energy allows detection of eluting precursor ion peptides, while high energy allows detection of associated product ions with no precursor ion selection prior to CID. Data were collected during
the entire LC-MSE experiment as pairs of
chromatographic profiles and their associated ion mass measurements for all the detected peptides19.
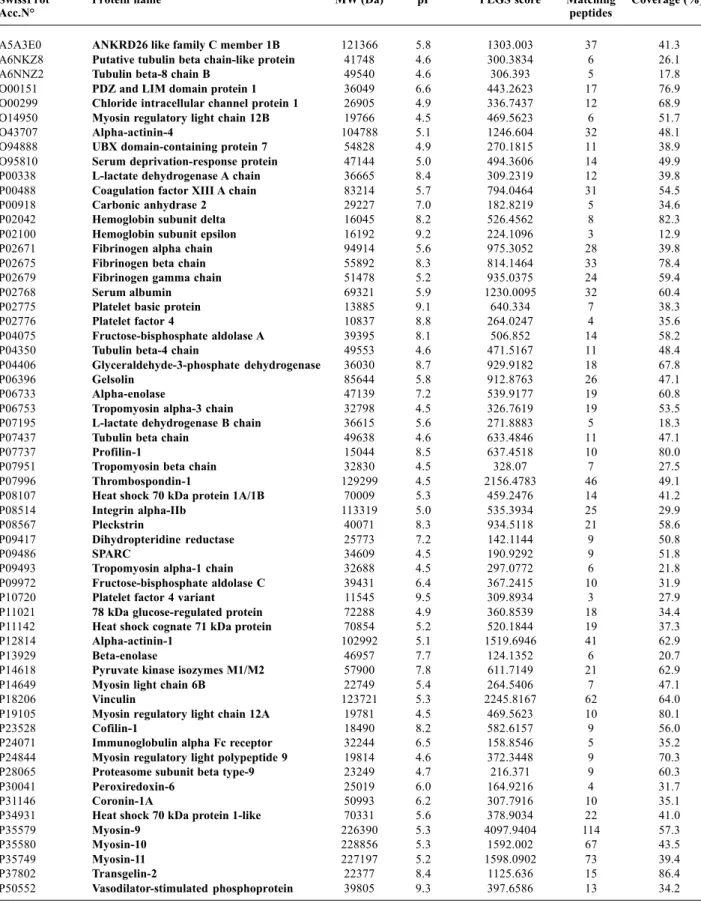
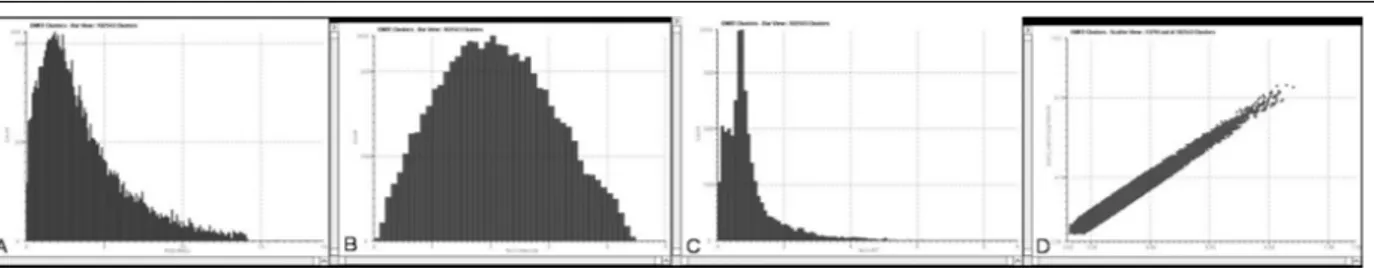
We identified a total of 114 proteins (Table I) and 102543 EMRT (Exact Mass Retention Time clusters). Quality control measures were performed on the replicates to determine the analytical reproducibility of the analysis (Figure 2). The final results from the clustering algorithm contain all mass spectrometric and chromatographic characteristics for each peptide component.
Figure 1 - 2D_E analysis of platelets proteome. (A) Representative 2-DE map of human platelets. Spots with a volume
higher than 0.5 % Vol. are enclosed in boundaries. (B) Binary comparison among the log ratios of relative spots volumes detected in the three replicate gels.
Table I - Proteins identified by LC-MSe
SwissProt Protein name MW (Da) pI PLGS score Matching Coverage (%)
Acc.N° peptides
A5A3E0 ANKRD26 like family C member 1B 121366 5.8 1303.003 37 41.3
A6NKZ8 Putative tubulin beta chain-like protein 41748 4.6 300.3834 6 26.1
A6NNZ2 Tubulin beta-8 chain B 49540 4.6 306.393 5 17.8
O00151 PDZ and LIM domain protein 1 36049 6.6 443.2623 17 76.9
O00299 Chloride intracellular channel protein 1 26905 4.9 336.7437 12 68.9
O14950 Myosin regulatory light chain 12B 19766 4.5 469.5623 6 51.7
O43707 Alpha-actinin-4 104788 5.1 1246.604 32 48.1
O94888 UBX domain-containing protein 7 54828 4.9 270.1815 11 38.9
O95810 Serum deprivation-response protein 47144 5.0 494.3606 14 49.9
P00338 L-lactate dehydrogenase A chain 36665 8.4 309.2319 12 39.8
P00488 Coagulation factor XIII A chain 83214 5.7 794.0464 31 54.5
P00918 Carbonic anhydrase 2 29227 7.0 182.8219 5 34.6
P02042 Hemoglobin subunit delta 16045 8.2 526.4562 8 82.3
P02100 Hemoglobin subunit epsilon 16192 9.2 224.1096 3 12.9
P02671 Fibrinogen alpha chain 94914 5.6 975.3052 28 39.8
P02675 Fibrinogen beta chain 55892 8.3 814.1464 33 78.4
P02679 Fibrinogen gamma chain 51478 5.2 935.0375 24 59.4
P02768 Serum albumin 69321 5.9 1230.0095 32 60.4
P02775 Platelet basic protein 13885 9.1 640.334 7 38.3
P02776 Platelet factor 4 10837 8.8 264.0247 4 35.6
P04075 Fructose-bisphosphate aldolase A 39395 8.1 506.852 14 58.2
P04350 Tubulin beta-4 chain 49553 4.6 471.5167 11 48.4
P04406 Glyceraldehyde-3-phosphate dehydrogenase 36030 8.7 929.9182 18 67.8
P06396 Gelsolin 85644 5.8 912.8763 26 47.1
P06733 Alpha-enolase 47139 7.2 539.9177 19 60.8
P06753 Tropomyosin alpha-3 chain 32798 4.5 326.7619 19 53.5
P07195 L-lactate dehydrogenase B chain 36615 5.6 271.8883 5 18.3
P07437 Tubulin beta chain 49638 4.6 633.4846 11 47.1
P07737 Profilin-1 15044 8.5 637.4518 10 80.0
P07951 Tropomyosin beta chain 32830 4.5 328.07 7 27.5
P07996 Thrombospondin-1 129299 4.5 2156.4783 46 49.1
P08107 Heat shock 70 kDa protein 1A/1B 70009 5.3 459.2476 14 41.2
P08514 Integrin alpha-IIb 113319 5.0 535.3934 25 29.9
P08567 Pleckstrin 40071 8.3 934.5118 21 58.6
P09417 Dihydropteridine reductase 25773 7.2 142.1144 9 50.8
P09486 SPARC 34609 4.5 190.9292 9 51.8
P09493 Tropomyosin alpha-1 chain 32688 4.5 297.0772 6 21.8
P09972 Fructose-bisphosphate aldolase C 39431 6.4 367.2415 10 31.9
P10720 Platelet factor 4 variant 11545 9.5 309.8934 3 27.9
P11021 78 kDa glucose-regulated protein 72288 4.9 360.8539 18 34.4
P11142 Heat shock cognate 71 kDa protein 70854 5.2 520.1844 19 37.3
P12814 Alpha-actinin-1 102992 5.1 1519.6946 41 62.9
P13929 Beta-enolase 46957 7.7 124.1352 6 20.7
P14618 Pyruvate kinase isozymes M1/M2 57900 7.8 611.7149 21 62.9
P14649 Myosin light chain 6B 22749 5.4 264.5406 7 47.1
P18206 Vinculin 123721 5.3 2245.8167 62 64.0
P19105 Myosin regulatory light chain 12A 19781 4.5 469.5623 10 80.1
P23528 Cofilin-1 18490 8.2 582.6157 9 56.0
P24071 Immunoglobulin alpha Fc receptor 32244 6.5 158.8546 5 35.2
P24844 Myosin regulatory light polypeptide 9 19814 4.6 372.3448 9 70.3
P28065 Proteasome subunit beta type-9 23249 4.7 216.371 9 60.3
P30041 Peroxiredoxin-6 25019 6.0 164.9216 4 31.7
P31146 Coronin-1A 50993 6.2 307.7916 10 35.1
P34931 Heat shock 70 kDa protein 1-like 70331 5.6 378.9034 22 41.0
P35579 Myosin-9 226390 5.3 4097.9404 114 57.3
P35580 Myosin-10 228856 5.3 1592.002 67 43.5
P35749 Myosin-11 227197 5.2 1598.0902 73 39.4
P37802 Transgelin-2 22377 8.4 1125.636 15 86.4
P50552 Vasodilator-stimulated phosphoprotein 39805 9.3 397.6586 13 34.2
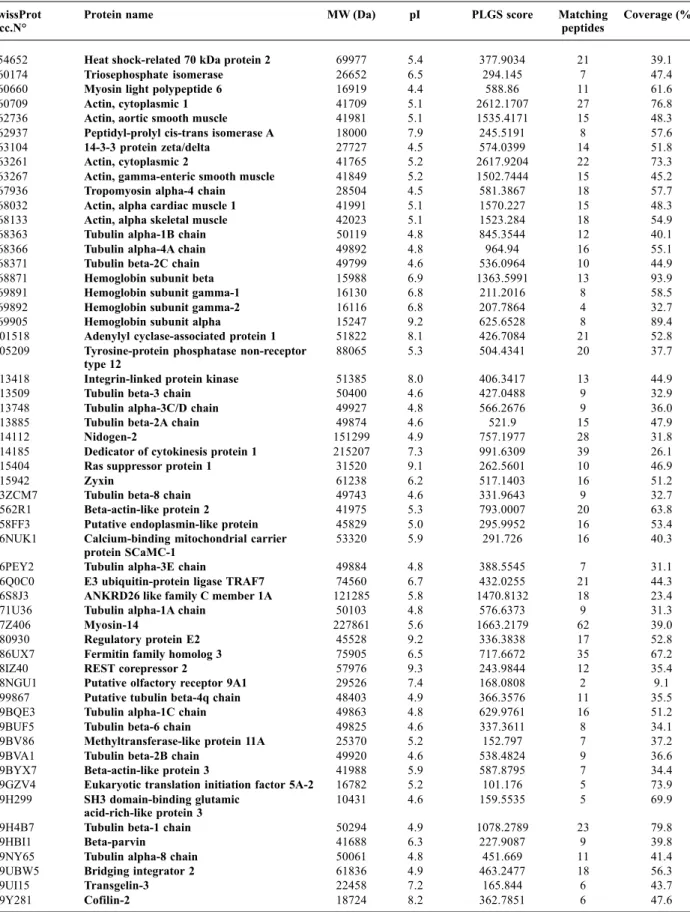
Table I - Proteins identified by LC-MSe
SwissProt Protein name MW (Da) pI PLGS score Matching Coverage (%)
Acc.N° peptides
P54652 Heat shock-related 70 kDa protein 2 69977 5.4 377.9034 21 39.1
P60174 Triosephosphate isomerase 26652 6.5 294.145 7 47.4
P60660 Myosin light polypeptide 6 16919 4.4 588.86 11 61.6
P60709 Actin, cytoplasmic 1 41709 5.1 2612.1707 27 76.8
P62736 Actin, aortic smooth muscle 41981 5.1 1535.4171 15 48.3
P62937 Peptidyl-prolyl cis-trans isomerase A 18000 7.9 245.5191 8 57.6
P63104 14-3-3 protein zeta/delta 27727 4.5 574.0399 14 51.8
P63261 Actin, cytoplasmic 2 41765 5.2 2617.9204 22 73.3
P63267 Actin, gamma-enteric smooth muscle 41849 5.2 1502.7444 15 45.2
P67936 Tropomyosin alpha-4 chain 28504 4.5 581.3867 18 57.7
P68032 Actin, alpha cardiac muscle 1 41991 5.1 1570.227 15 48.3
P68133 Actin, alpha skeletal muscle 42023 5.1 1523.284 18 54.9
P68363 Tubulin alpha-1B chain 50119 4.8 845.3544 12 40.1
P68366 Tubulin alpha-4A chain 49892 4.8 964.94 16 55.1
P68371 Tubulin beta-2C chain 49799 4.6 536.0964 10 44.9
P68871 Hemoglobin subunit beta 15988 6.9 1363.5991 13 93.9
P69891 Hemoglobin subunit gamma-1 16130 6.8 211.2016 8 58.5
P69892 Hemoglobin subunit gamma-2 16116 6.8 207.7864 4 32.7
P69905 Hemoglobin subunit alpha 15247 9.2 625.6528 8 89.4
Q01518 Adenylyl cyclase-associated protein 1 51822 8.1 426.7084 21 52.8
Q05209 Tyrosine-protein phosphatase non-receptor 88065 5.3 504.4341 20 37.7
type 12
Q13418 Integrin-linked protein kinase 51385 8.0 406.3417 13 44.9
Q13509 Tubulin beta-3 chain 50400 4.6 427.0488 9 32.9
Q13748 Tubulin alpha-3C/D chain 49927 4.8 566.2676 9 36.0
Q13885 Tubulin beta-2A chain 49874 4.6 521.9 15 47.9
Q14112 Nidogen-2 151299 4.9 757.1977 28 31.8
Q14185 Dedicator of cytokinesis protein 1 215207 7.3 991.6309 39 26.1
Q15404 Ras suppressor protein 1 31520 9.1 262.5601 10 46.9
Q15942 Zyxin 61238 6.2 517.1403 16 51.2
Q3ZCM7 Tubulin beta-8 chain 49743 4.6 331.9643 9 32.7
Q562R1 Beta-actin-like protein 2 41975 5.3 793.0007 20 63.8
Q58FF3 Putative endoplasmin-like protein 45829 5.0 295.9952 16 53.4
Q6NUK1 Calcium-binding mitochondrial carrier 53320 5.9 291.726 16 40.3
protein SCaMC-1
Q6PEY2 Tubulin alpha-3E chain 49884 4.8 388.5545 7 31.1
Q6Q0C0 E3 ubiquitin-protein ligase TRAF7 74560 6.7 432.0255 21 44.3
Q6S8J3 ANKRD26 like family C member 1A 121285 5.8 1470.8132 18 23.4
Q71U36 Tubulin alpha-1A chain 50103 4.8 576.6373 9 31.3
Q7Z406 Myosin-14 227861 5.6 1663.2179 62 39.0
Q80930 Regulatory protein E2 45528 9.2 336.3838 17 52.8
Q86UX7 Fermitin family homolog 3 75905 6.5 717.6672 35 67.2
Q8IZ40 REST corepressor 2 57976 9.3 243.9844 12 35.4
Q8NGU1 Putative olfactory receptor 9A1 29526 7.4 168.0808 2 9.1
Q99867 Putative tubulin beta-4q chain 48403 4.9 366.3576 11 35.5
Q9BQE3 Tubulin alpha-1C chain 49863 4.8 629.9761 16 51.2
Q9BUF5 Tubulin beta-6 chain 49825 4.6 337.3611 8 34.1
Q9BV86 Methyltransferase-like protein 11A 25370 5.2 152.797 7 37.2
Q9BVA1 Tubulin beta-2B chain 49920 4.6 538.4824 9 36.6
Q9BYX7 Beta-actin-like protein 3 41988 5.9 587.8795 7 34.4
Q9GZV4 Eukaryotic translation initiation factor 5A-2 16782 5.2 101.176 5 73.9
Q9H299 SH3 domain-binding glutamic 10431 4.6 159.5535 5 69.9
acid-rich-like protein 3
Q9H4B7 Tubulin beta-1 chain 50294 4.9 1078.2789 23 79.8
Q9HBI1 Beta-parvin 41688 6.3 227.9087 9 39.8
Q9NY65 Tubulin alpha-8 chain 50061 4.8 451.669 11 41.4
Q9UBW5 Bridging integrator 2 61836 4.9 463.2477 18 56.3
Q9UI15 Transgelin-3 22458 7.2 165.844 6 43.7
These were subjected to statistical calculations after the clustering process. The clustering algorithm utilized the analytical reproducibility of the mass measurement and the reproducibility of the chromatographic retention time of each peptide.
The mass precision of the extracted peptide components was within ± 5 ppm (approximately 2 ppm) of the mean mass measurement (Figure 2A). The variability of intensity among the replicate injections for these EMRT components showed an average coefficient within 1.6 and 2.3% (Figure 2B). The reproducibility of retention times for most of these clusters showed a RSD centered at 0.4% (Figure 2C). Variations in intensity were evaluated by conducting binary comparisons of the intensities of all matched peptide components from two replicate injections (Figure 2D). Under ideal conditions, the binary comparison would rely on a perfect 45-degree diagonal (ln(ratio)=0) intersecting through 0. The scatter plot showed a minimal degree of deviation of the peptide components intensity values throughout the detected range, confirming that this methods is highly reproducible. We compared datasets of identified proteins to those obtained with 2-DE experiments, in order to cluster them according to the Gene Ontology hierarchy, based on molecular functions and biological processes categories.
Gene ontology
Following 2-DE and nanoscale reversed phase LC-MSE, all the identified proteins were analyzed for
their involvement in known biological processes and their molecular function, respectively. Protein identification datasets derived both from our
experimental work and from bibliographic reference9
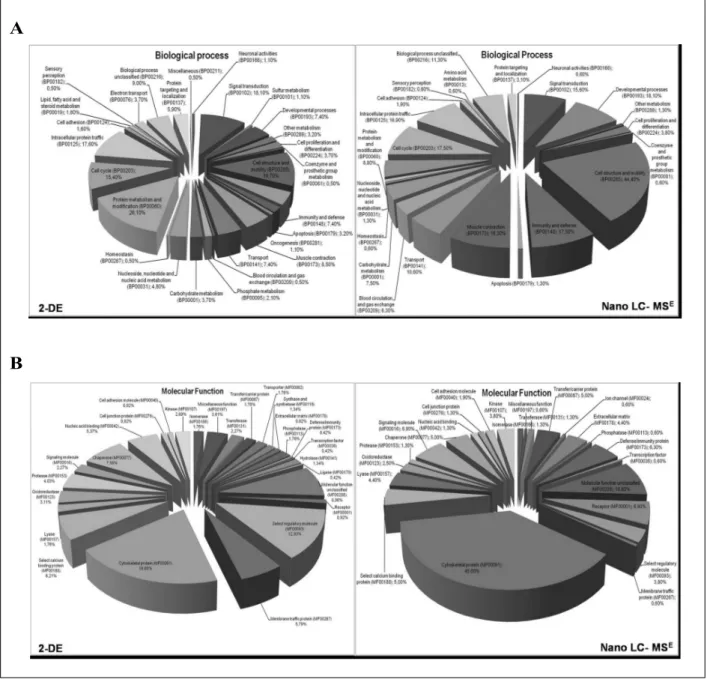
have been merged and loaded on PANTHER software. Proteins were grouped by category and compared for their ontology class. We observed differences in the functional distribution of the identified proteins between the two methods used. Using Shotgun approach, we found a major representation of proteins involved in cell structure and motility (44.40%) respect to DE (19.70%). On the contrary, using 2-DE we observed a predominance of proteins involved in cell metabolism (26.10%), respect to Shotgun analysis (8.80%). Notably, when we combined these two different but complementary proteomic tools, we were able to detect additional classes of proteins with different biological functions (Figure 3A).
Moreover, the molecular function classification revealed differences between the two proteomic approaches. In particular, we found significant differences in cytoskeletal proteins (19.65% 2-DE versus 45.60% Shotgun) and receptors (0,92% 2-DE versus 6.90% Shotgun), as expected due to the limited resolution of membrane hydrophobic proteins in the IEF first dimension. We found also differences in protein of immunity response (0.42% 2-DE versus 6.30 Shotgun) as well as in other classes of proteins (Figure 3B).
In conclusion, present results indicate that molecular profiling performed with two orthogonal proteomics analysis methodologies, enhances the possibility to obtain deeper information on the biology and pathophysiology of the systems under investigation. This becomes particularly relevant with platelets, in light of their multiple physiological functions and their involvement in a variety of human diseases.
Figure 2 - Analytical reproducibility of replicate LC-MSE experiments. (A) Relative standard deviation from all the EMRT components within ± 5 ppm of the mean mass measurement. (B) Average coefficient of variation of the measured signal intensity of the clusters. (C) Average retention time coefficient of variation was centered at 0.4%. (D) Binary comparison of the log intensity measurement obtained from the matched EMRT clusters for two replicate injections.
References
1) Brown AS, Erusalimsky JD, Martin JF, in: von Bruchhausen F, Walter U (Eds), Platelets and their Factors, Springer-Verlag, Berlin, Germany 1997, pp. 3-19.
2) Denis MM, Tolley ND, Bunting M, et al. Escaping the nuclear confines: signal-dependent pre-mRNA splicing in anucleate platelets. Cell 2005; 122(3): 379-91.
3) Macaulay IC, Carr P, Gusnanto A, et al. Platelet genomics and proteomics in human health and disease. J Clin Invest 2005; 115(12): 3370-7.
Figure 3 - Gene ontology distribution terms obtained from platelets proteome analysis. The proteins identified by 2-DE
and LC-MSE analysis were clustered based on their (A) biological process and (B) molecular functions
A
B
4) Ruggeri ZM. Platelets in atherothrombosis. Nat Med 2002; 8: 1223-1234.
5) Savage B, Cattaneo M, Ruggeri ZM. Mechanisms of platelet aggregation. Curr Opin Hematol 2001;
8: 270-276.
6) Gravel P, Sanchez JC, Walzer C, et al. Human blood platelet protein map established by two-dimensional polyacrylamide gel electrophoresis. Electrophoresis 1995; 16: 1152-1159.
7) Marcus K, Immler D, Sternberger J, Meyer HE. Identification of platelet proteins separated by two-dimensional gel electrophoresis and analyzed by matrix
Correspondence: Luisa Pieroni
IRCCS - S. Lucia Foundation Via del Fosso di Fiorano, 64/65 00143 Rome, Italy
E-mail: [email protected] assisted laser desorption/ionization-time of flight-mass
spectrometry and detection of tyrosine-phosphorylated proteins. Electrophoresis 2000; 21: 2622-2636. 8) Marcus K, Moebius J, Meyer HE. Differential analysis
of phosphorylated proteins in resting and thrombin-stimulated human platelets. Anal Bioanal Chem 2003;
376: 973-993.
9) O’Neill EE, Brock CJ, von Kriegsheim AF, et al. Towards complete analysis of the platelet proteome. Proteomics 2002; 2: 288-305.
10) Garcia A, Prabhakar S, Brock CJ, et al. Extensive analysis of the human platelet proteome by two-dimensional gel electrophoresis and mass spectrometry. Proteomics 2004; 4: 656-668.
11) Kubota K, Kosaka T, Ichikawa K. Combination of two-dimensional electrophoresis and shotgun peptide sequencing in comparative proteomics. Journal of Chromatography B (2005); 815: 3-9.
12) Thon JN, Schubert P, Duguay M, et al. Comprehensive proteomic analysis of protein changes during platelet storage requires complementary proteomic approaches. Transfusion 2008; 48(3): 425-35.
13) Dittrich M, Birschmann I, Mietner S, et al. Platelet protein interactions: map, signaling components, and phosphorylation groundstate. Arterioscler Thromb Vasc Biol 2008; 28(7): 1326-31.
14) Senzel L, Gnatenko DV, Bahou WF. The platelet proteome. Curr Opin Hematol 2009; 16(5): 329-33. 15) Thomas PD, Campbell MJ, Kejariwal A, et al.
PANTHER: a library of protein families and subfamilies indexed by function. Genome Res 2003; 13: 2129-2141.
16) Mi H, Guo N, Kejariwal A, Thomas PD. PANTHER version 6: protein sequence and function evolution data with expanded representation of biological pathways. Nucl Acids Res 2007; 35: D247-D252.
17) Thomas PD, Kejariwal A, Guo N et al. Applications for protein sequence-function evolution data: mRNA/ protein expression analysis and coding SNP scoring tools. Nucl Acids Res 2006; 34: W645-W650. 18) Shevchenko A, Wilm M, Vorm O, et al. Mass
spectrometric sequencing of proteins silver-stained polyacrylamide gels. Anal Chem 1996; 68: 850-858. 19) Silva JC, Denny R, Dorschel CA, et al. Quantitative
proteomic analysis by accurate mass retention time pairs. Anal Chem 2005; 77: 2187-2200.