Assessment of VAV2 Expression Refines Prognostic
Prediction in Adrenocortical Carcinoma
Silviu Sbiera,
1Iuliu Sbiera,
1Carmen Ruggiero,
2,3,4,5Mabrouka Doghman-Bouguerra,
2,3,4,5Esther Korpershoek,
6Ronald R. de Krijger,
6,7Hester Ettaieb,
8Harm Haak,
8,9,10Marco Volante,
11Mauro Papotti,
11Giuseppe Reimondo,
12Massimo Terzolo,
12Michaela Luconi,
13Gabriella Nesi,
13Massimo Mannelli,
13Rossella Lib ´e,
14,15,16Bruno Ragazzon,
14,15,16Guillaume Assi ´e,
14,15,16J ´er
ˆome Bertherat,
14,15,16Barbara Altieri,
1,17Guido Fadda,
18Natalie Rogowski-Lehmann,
19Martin Reincke,
19Felix Beuschlein,
19,20Martin Fassnacht,
21and Enzo Lalli
2,3,4,5 1Department of Internal Medicine I– Division of Endocrinology and Diabetes, University Hospital, University of W ¨urzburg, 97080 Wurzburg, Germany;2Universit ´e Cˆote d’Azur, Sophia Antipolis, 06560 Valbonne, France;3CNRS UMR7275, Sophia Antipolis, 06560 Valbonne, France;4NEOGENEX CNRS International Associated Laboratory, Sophia Antipolis, 06560 Valbonne, France;5Institut de Pharmacologie Mol ´eculaire et Cellulaire, Sophia Antipolis, 06560 Valbonne, France;6Department of Pathology, Erasmus MC Cancer Institute, University Medical Center, 3000 CA Rotterdam, The Netherlands;7Department of Pathology, Reinier de Graaf Hospital, 2625 AD Delft, The Netherlands;8Department of Internal Medicine, M ´axima Medical Centre, 5631 BM Eindhoven/Veldhoven, The Netherlands;9Department of Internal Medicine, Division of General Internal Medicine, Maastricht University Medical Centre+, 6202 AZ Maastricht, The Netherlands;10Maastricht University, CAPHRI School for Public Health and Primary Care, Ageing and Long-Term Care, 6200 MD Maastricht, The Netherlands;11Department of Oncology, University of Turin at San Luigi Hospital, 10043 Orbassano, Italy;12Department of Clinical and Biological Sciences, University of Turin at San Luigi Hospital, 10043 Orbassano, Italy;13Department of Experimental and Clinical Biomedical Sciences“Mario Serio,” University of Florence, 50139 Florence, Italy;14Inserm U1016, Institut Cochin, 75014 Paris, France;15CNRS UMR8104, 75014 Paris, France;16Universit ´e Paris Descartes, Sorbonne Paris Cit ´e, 75014 Paris, France;17Division of Endocrinology and Metabolic Diseases, Catholic University of the Sacred Heart, 00168 Rome, Italy;18Division of Anatomic Pathology and Histology, Catholic University of the Sacred Heart, 00168 Rome, Italy;19Medizinische Klinik and Poliklinik IV, Ludwig-Maximilians-Universit ¨at, 80336 Munich, Germany;20Klinik f ¨ur Endokrinologie, Diabetologie und Klinische Ern ¨ahrung, Universit ¨atsspital Z ¨urich, 8091 Zurich, Switzerland; and21Comprehensive Cancer Center Mainfranken, University of W ¨urzburg, 97080 Wurzburg, Germany
Context: Adrenocortical carcinoma (ACC) is a rare endocrine malignancy with overall poor prognosis. The Ki67 labeling index (LI) has a major prognostic role in localized ACC after complete resection, but its estimates may suffer from considerable intra- and interobserver variability. VAV2 overexpression in-duced by increased Steroidogenic Factor-1 dosage is an essential factor driving ACC tumor cell invasion. Objective: To assess the prognostic role of VAV2 expression in ACC by investigation of a large cohort of patients.
Design, Setting, and Participants: A total of 171 ACC cases (157 primary tumors, six local recurrences, eight metastases) from seven European Network for the Study of Adrenal Tumors centers were studied. Outcome Measurements: H-scores were generated to quantify VAV2 expression. VAV2 expression was divided into two categories: low (H-score,,2) and high (H-score, $2). The Ki67 LI retrieved from patients’ pathology records was also categorized into low (,20%) and high ($20%). Clinical and
ISSN Print 0021-972X ISSN Online 1945-7197 Printed in USA
Copyright © 2017 Endocrine Society
Received 26 April 2017. Accepted 28 June 2017. First Published Online 3 July 2017
Abbreviations: ACC, adrenocortical carcinoma; CI, confidence interval; ENS@T, European Network for the Study of Adrenal Tumors; HR, hazard ratio; LI, labeling index; OS, overall survival; PFS, progression-free survival; SD, standard deviation; SF-1, Steroidogenic Factor-1; TMA, tissue microarray.
doi: 10.1210/jc.2017-00984 J Clin Endocrinol Metab, September 2017, 102(9):3491–3498 https://academic.oup.com/jcem 3491
immunohistochemical markers were correlated with progression-free survival (PFS) and overall survival (OS).
Results: VAV2 expression and Ki67 LI were significantly correlated with each other and with PFS and OS. Heterogeneity of VAV2 expression inside the same tumor was very low. Combined assessment of VAV2 expression and Ki67 LI improved patient stratification to low-risk and high-risk groups. Conclusion: Combined assessment of Ki67 LI and VAV2 expression improves prognostic prediction in ACC. (J Clin Endocrinol Metab 102: 3491–3498, 2017)
A
drenocortical carcinoma (ACC) is a rare endocrine
malignancy with overall poor prognosis, limited
treatment options when progressed into metastatic stage,
and unsatisfactory response to polychemotherapeutic
cytotoxic regimens (1, 2). Hence the most efficient
method to eradicate the disease consists in complete
surgical resection of the primary tumor. However, risk of
recurrence is high even in this condition. Molecular
studies have identified two subclasses of ACCs with
aggressive or indolent clinical behavior (3
–6). However,
because molecular markers identified by those studies
have not yet found entrance into clinical practice, it
would be of particular importance to stratify patients
with ACC into low- or high-risk groups to adequately
monitor disease recurrence and assign them to
appro-priate therapeutic interventions. The histological Weiss
score, which is commonly used as an established
morphometric criterion for differential diagnosis in
ad-renocortical tumors, has limited value as a prognostic
indicator, especially in cases with borderline features (7,
8). Conversely, it was shown that several
immunohis-tochemical markers have a prognostic value in ACC
(9–18). Among those, the most widely used in clinical
pathology reports is the Ki67 labeling index (LI), which is
directly related to the proliferative activity of a given
tissue (14
–18). A study recently completed by the
Eu-ropean Network for the Study of Adrenal Tumors (ENS@
T) could indeed demonstrate that Ki67 LI has a major
prognostic role in localized ACC after complete resection
(18). However, Ki67 LI estimates suffer from considerable
intra- and interobserver variability, as highlighted in a
recent study (19). New prognostic markers are needed,
therefore, to further refine prognostic classification of
patients with ACC as part of a multiparametric analysis.
The transcription factor Steroidogenic Factor-1 (SF-1)
has a pivotal role in regulating adrenocortical cell
pro-liferation and differentiation (20). Its overexpression is
associated with adrenocortical tumorigenesis through
regulation of a specific set of SF-1 dosage-dependent target
genes (21, 22). One of these genes encodes VAV2, a
guanine nucleotide exchange factor for small GTPases of
the Rho family (23). We have recently shown that VAV2
overexpression induced by an increased SF-1 dosage in
ACC is an essential factor driving tumor cell invasion (24).
Herein, we present the results of a large study involving
ACC cases provided by seven European institutions aimed
to assess the prognostic value of VAV2 expression in ACC
and to compare and integrate it with the Ki67 LI.
Materials and Methods
Immunostaining on formalin-fixed,
paraffin-embedded ACC samples
We analyzed 171 adrenocortical tumor tissues from patients
with ACC provided by seven ENS@T centers (three centers in Italy,
n = 103 samples; two in The Netherlands, n = 42; one in France, n =
20; one in Germany, n = 6). A total of 145 samples were previously
assembled in seven tissue microarrays (TMAs) with two or three
cores per sample interspersed with normal human liver, kidney,
and placenta tissues; 26 samples were available as full slides.
Among the ACC samples, 157 were derived from primary tumors
(male/female, 59:98; average age
6 standard deviation [SD],
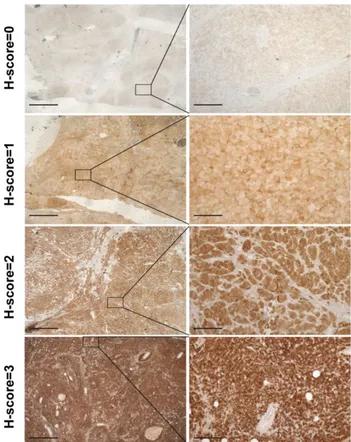
Figure 1. Examples of various intensities of VAV2 staining in ACC specimens. The H-score value is indicated for each image. Scale bar, 400mm (images in left column); 50 mm (images in right column).
48.7
6 15.2 years; average tumor size 6 SD, 11.2 6 5.4 cm;
Supplemental Table 1)
—six from local recurrences and eight
from distant metastases (liver and lung). The diagnosis of ACC
was made by established criteria based on clinical, biochemical,
and morphological data (25). All clinical data were collected
through the ENS@T database (registry.ensat.org). All patients
gave informed consent and the study was approved by ethical
committees from all participating institutions.
Immunohistochemical detection was performed on all
sam-ples using an indirect immunoperoxidase technique after
high-temperature antigen retrieval in 0.01 M citrate buffer (pH 6.5)
in a pressure cooker for 13 minutes. The primary antibody was a
rabbit monoclonal antibody against the VAV2 protein (clone
EP1067Y, catalog no. ab52640; Abcam) diluted 1:250 in 25% AB
serum in phosphate-buffered saline and incubated for 1 hour at room
temperature. Signal detection was performed with the ADVANCE
HRP detection system (Dako) and 3,3
0-diaminobenzidine
chro-mogen according to the manufacturer
’s instructions. Nuclei were
counterstained with Mayer hematoxylin for 3 minutes. As negative
control, universal rabbit negative control (Dako) was used.
Immunostaining results were analyzed using a light
micro-scope at high magnification. VAV2 staining intensity was
evaluated independently by two investigators blinded to the
clinical data (S.S. and I.S.). Cytoplasmic staining intensity was
evaluated with a grading score of 0, 1, 2, or 3, corresponding to
negative, weak, moderate, and strong intensity, respectively.
The proportion of positive tumor cells was calculated for each
specimen and set up to be scored 0, 0.1, 0.5, or 1, if 0%, 1% to
9%, 10% to 49%, or
.50% of the tumor cells were positive for
VAV2, respectively. A semiquantitative H-score was then
cal-culated by multiplying the staining intensity grade by the
proportion score (12, 24).
In all cases analyzed, the proportion of VAV2 positive cells
was always
.50%, so all intensity values were multiplied by a
factor equal to 1 to yield the H-score. The cutoff point to
separate samples in high or low VAV2 expression was between
H-scores
,2 and $2. Ki67 LI data assessed by the local
pa-thologists in each expert center were retrieved from the ENS@T
database. The Ki67 LI cutoff value used in this study to separate
low LI and high LI groups was 20%.
Statistical analysis
Correlation analyses were performed using a
x
2test for
categorical variables. The interobserver agreement for the
scoring system was evaluated using the Cohen
k coefficient and
confirmed using Pearson correlation coefficient. The cutoff for
strong agreement chosen for the
k coefficient was 0.81, and 0.75
was chosen for the Pearson coefficient (26). The comparison of
clinical and histopathological characteristics was performed on
GraphPad Prism 6.0 software using a nonparametric
Mann-Whitney test (for two groups) and Kruskal-Wallis test with
Dunn correction for multiple testing (for more than two
groups), as appropriate. A P value
,0.05 was considered to be
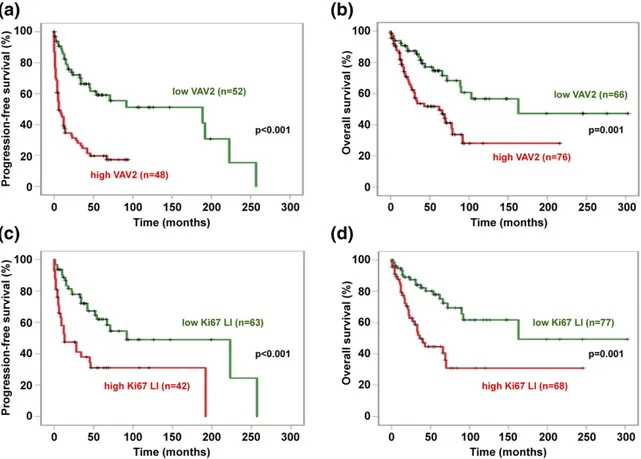
Figure 2. Correlation of VAV2 expression (H-score) and Ki67 LI with PFS and OS in our ACC series. (a) PFS (mean6 SD) in low VAV2 expression group (H-score,,2; green line), 127 6 15.9 months; high VAV2 expression group (H-score, $2; red line), 25.7 6 4.1 months (Kaplan-Meier P , 0.001). (b) OS in low VAV2 expression group (H-score,,2; green line), 180 6 22 months; high VAV2 expression group (H-score, $2; red line), 87.46 13 months (Kaplan-Meier P = 0.001). (c) PFS in low Ki67 LI group (,20%; green line), 137 6 17.9 months; high Ki67 LI group ($20%; red line), 68.56 14.3 months (Kaplan-Meier P , 0.001). (d) OS in low Ki67 LI group (,20%; green line), 187.5 6 22.9 months; high Ki67 LI group ($20%; red line), 96.2 6 17 months (Kaplan-Meier P = 0.001). The numbers of cases analyzed for each group are reported in parentheses.
statistically significant. Survival analysis for patients with ACC
was calculated as described (24) using the Kaplan-Meier
method, and differences between groups were assessed with
log-rank and Cox proportional hazards statistics, using the
SPSS software package (version 23.0.0 for Mac; IBM), after
adjustment for sex, age, and tumor stage. Progression-free
survival (PFS) was defined as time elapsed from primary
re-section of ACC to the first recurrence, locoregional or systemic.
Overall survival (OS) was defined as time elapsed from primary
resection of ACC to disease-related death or last follow-up visit.
In the group of patients with R0 resection, OS data relative to
VAV2 expression and Ki67 LI were available for 100 and 105
patients, respectively. Of those patients, 92 had both VAV2 and
Ki67 LI OS data available. Viable cell data after VAV2 knockdown
were analyzed by one-way analysis of variance with Dunnett
correction for multiple comparisons.
Results
VAV2 expression is a strong predictor of PFS and OS
in patients with ACC
Examples of different VAV2 expression patterns in
ACC are shown in Fig 1. An H-score was assigned to each
sample, which took into consideration both staining
intensity and the percentage of cells stained by the
anti-VAV2 antibody. The interobserver agreement was very
good, with the Cohen
k coefficient equal to 0.85 [95%
confidence interval (CI), 0.72 to 0.89] and Pearson
co-efficient r equal to 0.90 (95% CI, 0.86 to 0.93; P
,
0.001). In contrast to Ki67 staining, which is usually
heterogeneous throughout a tumor, VAV2 expression
was fairly equally distributed within a given tumor, with
all samples presenting
.50% stained cells. H-score
heterogeneity among different TMA tissue cores
be-longing to the same tumors was limited, with a residual
SD
s equal to 0.14 and an intraclass correlation
co-efficient
a equal to 0.95 (95% CI, 0.92 to 0.97;
Sup-plemental Fig. 1). The same homogenous distribution
was also observed when whole tumor slides were
ana-lyzed (Fig 1).
VAV2 expression in the tumor was strongly
corre-lated to both PFS [Fig 2(a)] and OS [Fig 2(b)],
con-firming the results of our previous study performed on
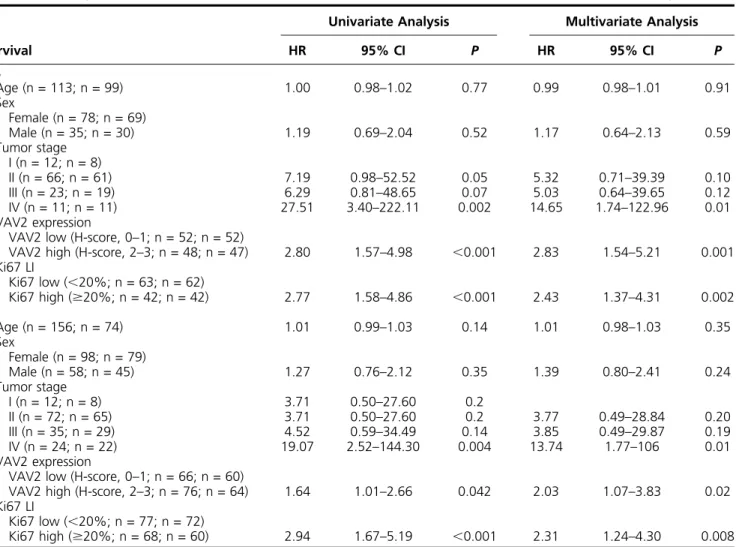
Table 1.
Analysis of Parameters Correlated With PFS and OS in Univariate and Multivariate Analyses
Survival
Univariate Analysis
Multivariate Analysis
HR
95% CI
P
HR
95% CI
P
PFS
Age (n = 113; n = 99)
1.00
0.98–1.02
0.77
0.99
0.98–1.01
0.91
Sex
Female (n = 78; n = 69)
Male (n = 35; n = 30)
1.19
0.69–2.04
0.52
1.17
0.64–2.13
0.59
Tumor stage
I (n = 12; n = 8)
II (n = 66; n = 61)
7.19
0.98–52.52
0.05
5.32
0.71–39.39
0.10
III (n = 23; n = 19)
6.29
0.81–48.65
0.07
5.03
0.64–39.65
0.12
IV (n = 11; n = 11)
27.51
3.40
–222.11
0.002
14.65
1.74
–122.96
0.01
VAV2 expression
VAV2 low (H-score, 0
–1; n = 52; n = 52)
VAV2 high (H-score, 2
–3; n = 48; n = 47)
2.80
1.57
–4.98
,0.001
2.83
1.54
–5.21
0.001
Ki67 LI
Ki67 low (,20%; n = 63; n = 62)
Ki67 high ($20%; n = 42; n = 42)
2.77
1.58–4.86
,0.001
2.43
1.37–4.31
0.002
OS
Age (n = 156; n = 74)
1.01
0.99–1.03
0.14
1.01
0.98–1.03
0.35
Sex
Female (n = 98; n = 79)
Male (n = 58; n = 45)
1.27
0.76–2.12
0.35
1.39
0.80–2.41
0.24
Tumor stage
I (n = 12; n = 8)
3.71
0.50–27.60
0.2
II (n = 72; n = 65)
3.71
0.50–27.60
0.2
3.77
0.49–28.84
0.20
III (n = 35; n = 29)
4.52
0.59–34.49
0.14
3.85
0.49–29.87
0.19
IV (n = 24; n = 22)
19.07
2.52–144.30
0.004
13.74
1.77–106
0.01
VAV2 expression
VAV2 low (H-score, 0
–1; n = 66; n = 60)
VAV2 high (H-score, 2
–3; n = 76; n = 64)
1.64
1.01
–2.66
0.042
2.03
1.07
–3.83
0.02
Ki67 LI
Ki67 low (
,20%; n = 77; n = 72)
Ki67 high ($20%; n = 68; n = 60)
2.94
1.67–5.19
,0.001
2.31
1.24–4.30
0.008
Numbers of cases taken into account for univariate and multivariate analysis, respectively, are indicated in parentheses for each variable.Abbreviation: HR, hazard ratio.
an independent smaller cohort of patients with ACC
(24). Patients with strong VAV2 expression had a
2.8-fold higher risk of experiencing a recurrence and
1.6-fold increased risk of dying.
No statistically significant difference existed for VAV2
expression in primary tumors and metastatic sites from
the same patients (P = 0.67). The Ki67 LI was also a
strong predictor of PFS [Fig 2(c)] and OS [Fig 2(d)], as
reported in previous studies (14
–18). Both VAV2
ex-pression and Ki67 LI were strongly correlated with OS
even in patients with R0 resection (Supplemental Fig. 2).
VAV2 expression and Ki67 LI had a similar strong
prognostic value for PFS and OS both in univariate and in
multivariate analyses, taking into account patients
’ age,
sex, and tumor stage (Table 1).
Combined assessment of VAV2 expression and Ki67
LI improves prognostic power
In general, a significant correlation existed between
Ki67 LI and VAV2 expression in our ACC cohort
(Supplemental Fig. 3). A strong correlation also existed
when Ki67 LI and VAV2 expression were considered as
categorical (low vs high) variables (x
2= 6.18; P = 0.01).
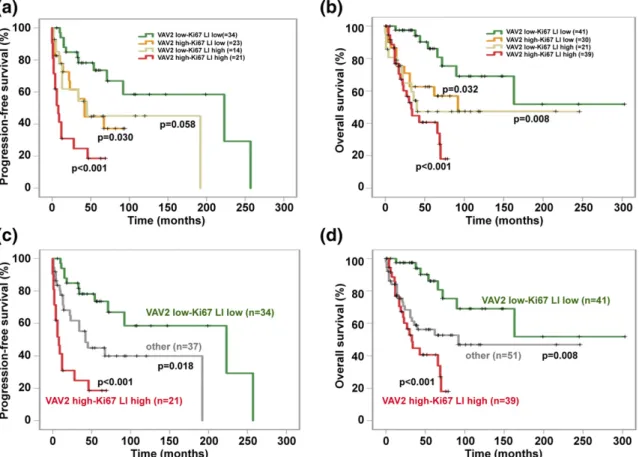
However, in several cases, these two parameters were
Figure 3. Correlation of combined VAV2 expression (H-score) and Ki67 LI with PFS and OS in our ACC series. (a) PFS (mean6 SD) in low VAV2 expression (H-score,,2) and low Ki67 LI group (,20%; green line), 159.7 6 23.2 months; high VAV2 expression (H-score, $2)-low Ki67 LI group (,20%; yellow line), 50.7 6 8.4 months; low VAV2 expression (H-score, ,2)-high Ki67 LI group ($20%; pale green line), 96.6 6 26.3 months; high VAV2 expression (H-score,$2)-high Ki67 LI group ($ 20%; red line), 20.865.8 months. Compared with the low VAV2-low Ki67 LI group: the high VAV2-low Ki67 LI hazard ratio (HR) was 2.55 (95% CI, 1.09–5.97; P = 0.030); low VAV2-high Ki67 LI HR was 2.46 (95% CI, 0.97–6.23; P = 0.058); high VAV2-high Ki67 LI HR was 6.75 (95% CI, 2.97–15.31; P , 0.001) by the Kaplan-Meier method. (b) OS (mean 6 SD) in low VAV2 expression (H-score,,2)-low Ki67 LI group (,20%; green line), 203.7 6 29.6 months; high VAV2 expression (H-score, $2)-low Ki67 LI group (,20%; yellow line), 120.4 6 20.5 months; low VAV2 expression (H-score, ,2)-high Ki67 LI group ($20%; pale green line), 126 6 26.7 months; high VAV2 expression (H-score,$2)-high Ki67 LI group ($20%; red line), 41.6 6 5.1 months. Compared with the low VAV2-low Ki67 LI group: high VAV2-VAV2-low Ki67 LI HR was 2.66 (95% CI, 1.08–6.52; P = 0.032); low VAV2-high Ki67 LI HR was 3.51 (95% CI,
1.38–8.91; P = 0.008); high VAV2-high Ki67 LI HR was 5.38 (95% CI, 2.33–12.40; P , 0.001) by the Kaplan-Meier method. (c) PFS (mean 6 SD) in low VAV2 expression (H-score,,2)-low Ki67 LI group (,20%; green line), 159.7 6 23.2 months; high VAV2 expression (H-score, $2)-high Ki67 LI group ($20%; red line), 20.8 6 5.8 months; all other patients with dissociated VAV2 expression-Ki67 LI group (gray line), 90.3 6 15.7 months. Compared with the low VAV2-low Ki67 LI group: other HR was 2.51 (95% CI, 1.17–5.39; P = 0.018); high VAV2-high Ki67 LI group HR was 6.75 (95% CI, 2.97–15.31; P , 0.001) by the Kaplan-Meier method. (d) OS (mean 6 SD) in low VAV2 expression (H-score, ,2)-low Ki67 LI group (,20%; green line), 203.7 6 29.6 months; high VAV2 expression (H-score, $2)-high Ki67 LI group ($20%; red line), 41.6 6 5.1 months; all other patients with dissociated VAV2 expression-Ki67 LI group (gray line), 130.36 18.1 months. Compared with the low VAV2-low Ki67 LI group: other HR was 2.99 (95% CI, 1.32–6.73; P = 0.008); high VAV2-high Ki67 LI group HR was 5.38 (95% CI, 2.33–12.40; P , 0.001) by the Kaplan-Meier method. The numbers of cases analyzed for each group are reported in parentheses.
dissociated, with one value being elevated and the other
low in the same tumor. Remarkably, in those patients,
PFS and OS were intermediate between the high-risk
(high VAV2 expression and high Ki67 LI) and the
low-risk groups [low VAV2 expression and low Ki67 LI; Fig
3(a) and 3(b)].
Merging the groups with high VAV2/low Ki67 LI and
low VAV2/high Ki67 LI and comparing them with the
high VAV2/high Ki67 LI and low VAV2/low Ki67 LI
groups identified three classes of patients with very
dif-ferent PFS (mean
6 SD: 159.7 6 23.2, 90.3 6 15.7, and
20.8
6 5.8 months, respectively) and OS [mean 6 SD:
203.7
6 29.6, 130.3 6 29.6, and 41.6 6 5.1 months,
respectively; Fig 3(c) and 3(d)]. This type of stratification
maintained a strong prognostic value even in R0 patients
(Supplemental Fig. 4). Remarkably, when considering the
high-risk group apart from all other patients with ACC, a
very strong correlation existed with OS in the whole
cohort [Fig 4(a)] and with both PFS and OS in R0 patients
[Fig 4(b) and 4(c)]. Furthermore, isolated high VAV2
expression or high Ki67 LI showed a prediction value for
worse PFS and OS that was slightly lower compared with
the combination of both high VAV2 expression and high
Ki67 LI [PFS: 22 months, hazard ratio (HR), 0.67 for
VAV2, and 28 months, HR, 0.66 for Ki67 LI vs 9 months
for the combination; OS: 66 months, HR, 0.73 for VAV2,
and 40 months, HR, 0.82 for Ki67 LI vs 33 months for
the combination].
Discussion
The prognosis of patients with ACC is variable and
poorly predictable. A recent, large multicenter ENS@T
study has shown that the KI67 LI is the most powerful
parameter predicting disease recurrence and survival in
patients with ACC after complete tumor resection (18).
The Ki67 LI has been integrated with the combined
evaluation of morphological parameters (i.e., number of
mitoses/presence of necrosis) in the newly introduced
Helsinki score, which reportedly more accurately
pre-dicts recurrence in ACC (8, 27). However, even if Ki67
LI assessment is routinely performed in diagnostic
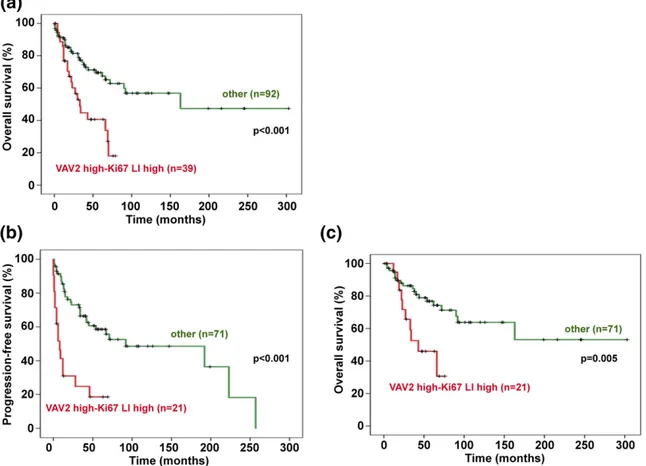
Figure 4. Prognosis of the high-risk group (high VAV2 expression-high Ki67 LI)vs other patients with ACC. (a) OS (mean 6 SD) in the whole cohort of patients with ACC for the high VAV2 expression (H-score,$2)-high Ki67 LI group ($20%; red line) was 41.565 months; for all other patients (green line), OS was 175.56 19.8 months (Kaplan-Meier P , 0.001). (b) PFS (mean 6 SD) in R0 patients for the high VAV2 expression (H-score,$2)-high Ki67 LI group ($20%; red line), 20.8 6 5.8 months; for all other patients (green line), PFS was 127.3 6 15.7 months (Kaplan-MeierP , 0.001). (c) OS (mean 6 SD) in R0 patients for the high VAV2 expression (H-score, $2)-high Ki67 LI group ($20%; red line) was 47.566 months; OS all other patients (green line) was 194.8 6 21.7 months (Kaplan-Meier P = 0.005). The number of cases analyzed for each group are reported in parentheses.
pathology laboratories for many neoplastic disorders, its
standardization and reproducibility have been
ques-tioned for many tumor types, including ACC (19). It is
important, therefore, to identify other molecular markers
that can complement the Ki67 LI to obtain a more
ac-curate stratification of the risk of recurrence in patients
with ACC. In this perspective, molecular prognostic
in-dicators derived from genomic studies are very promising
(3, 28, 29), but for routine implementation, they suffer
from the important drawback that, at least at the present
state of technology, frozen tumor material is required. On
the other hand, prognostic value of circulating markers of
malignancy awaits validation in large cohorts of patients
with ACC (30
–33).
We have recently shown that VAV2 overexpression is
an essential driver of cell invasion in conditions of
in-creased SF-1 dosage through its guanine nucleotide
ex-change factor activity for the small GTPases Rac1 and
Cdc42 (24). Those data directly link VAV2 with the
potential mechanism of malignancy consisting of
in-creased cellular invasiveness. In the current study, we
extended the previous study to a large European cohort of
patients with ACC and show that the tumor VAV2
H-score is significantly correlated to PFS and OS. The
combined assessment of VAV2 expression and Ki67 LI
improves patient risk stratification, with cases presenting
high Ki67 LI but low VAV2 expression having
signifi-cantly longer PFS and OS compared with patients with
concordant high-risk parameters. In our study, VAV2
H-score assessment, which was mainly performed on TMA
tissue cores, was associated with an excellent
intra-tumoral reproducibility and is, in principle, less prone to
intra- and interobserver variability, although further
work is needed to specifically address this question on an
even larger number of cases. These results show that
immunohistochemical assessment of VAV2 expression
may usefully complement the measurement of the Ki67 LI
for prognostic stratification of patients with ACC.
Acknowledgments
Address all correspondence and requests for reprints to: Enzo
Lalli, MD, Institut de Pharmacologie Mol´eculaire et Cellulaire
CNRS UMR7275, 660 route des Lucioles - Sophia Antipolis,
06560 Valbonne, France. E-mail:
[email protected]
or Silviu
Sbiera, PhD, Medizinische Klinik und Poliklinik I - University
of W ¨urzburg Endokrinologie Forschung ZIM, A4.-3.949
Oberd ¨urrbacherstrasse 6 97080 W ¨urzburg, Germany. E-mail:
[email protected]
.
This work was supported by the Else Kr
¨oner-Fresenius-Stiftung Grant 2016_A96 and by a fellowship from the
“Novartis-Stiftung f ¨ur theraputische Forschung” to S.S.;
Italian Association for Cancer Research Grants IG/14820/2013
(to M.P.), 14411 (to M.T.), and IG/17691/2015 (to M.L.);
ERA-NET
“E-Rare” Grant 01GM1407B (to M.F.); French
National Research Agency (ANR) through the LOCALDO
(Grant ANR-15-CE14-0017-01) and
“Investments for the
Future” Labex SIGNALIFE (Grant ANR-11-LABX-0028-01)
(to E.L.). C.R. was a recipient of Ville de Nice and Fondation de
France (Grant 00057927) postdoctoral fellowships.
Disclosure Summary: The authors have nothing to disclose.
References
1. Else T, Kim AC, Sabolch A, Raymond VM, Kandathil A, Caoili EM, Jolly S, Miller BS, Giordano TJ, Hammer GD. Adrenocortical carcinoma. Endocr Rev. 2014;35(2):282–326.
2. Ronchi CL, Kroiss M, Sbiera S, Deutschbein T, Fassnacht M. EJE prize 2014: current and evolving treatment options in adreno-cortical carcinoma: where do we stand and where do we want to go? Eur J Endocrinol. 2014;171(1):R1–R11.
3. de Reyni`es A, Assi´e G, Rickman DS, Tissier F, Groussin L, Ren´e-Corail F, Dousset B, Bertagna X, Clauser E, Bertherat J. Gene expression profiling reveals a new classification of adrenocortical tumors and identifies molecular predictors of malignancy and survival. J Clin Oncol. 2009;27(7):1108–1115.
4. Giordano TJ, Kuick R, Else T, Gauger PG, Vinco M, Bauersfeld J, Sanders D, Thomas DG, Doherty G, Hammer G. Molecular classification and prognostication of adrenocortical tumors by transcriptome profiling. Clin Cancer Res. 2009;15(2):668–676. 5. Assi´e G, Letouz´e E, Fassnacht M, Jouinot A, Luscap W, Barreau O,
Omeiri H, Rodriguez S, Perlemoine K, Ren´e-Corail F, Elarouci N, Sbiera S, Kroiss M, Allolio B, Waldmann J, Quinkler M, Mannelli M, Mantero F, Papathomas T, De Krijger R, Tabarin A, Kerlan V, Baudin E, Tissier F, Dousset B, Groussin L, Amar L, Clauser E, Bertagna X, Ragazzon B, Beuschlein F, Lib´e R, de Reyni`es A, Bertherat J. Integrated genomic characterization of adrenocortical carcinoma. Nat Genet. 2014;46(6):607–612.
6. Zheng S, Cherniack AD, Dewal N, Moffitt RA, Danilova L, Murray BA, Lerario AM, Else T, M TA, Ciriello G, Kim S, Assie G, Morozova O, Akbani R, Shih J, Hoadley KA, Choueiri TK, Waldmann J, Mete O, Robertson AG, Wu HT, Raphael BJ, Shao L, Meyerson M, Demeure MJ, Beuschlein F, Gill AJ, Sidhu SB, Almeida MQ, Fragoso MC, Cope LM, Kebebew E, Habra MA, Whitsett TG, Bussey KJ, Rainey WE, Asa SL, Bertherat J, Fassnacht M, Wheeler DA, Hammer GD, Giordano TJ, Verhaak RG; Cancer Genome Atlas Research Network. Comprehensive pan-genomic characterization of adrenocortical carcinoma [published correction appears in Cancer Cell. 2016;30(2):363. Cancer Cell. 2016;29(5): 723–736.
7. Papotti M, Lib`e R, Duregon E, Volante M, Bertherat J, Tissier F. The Weiss score and beyond–histopathology for adrenocortical carcinoma. Horm Cancer. 2011;2(6):333–340.
8. Pennanen M, Heiskanen I, Sane T, Remes S, Mustonen H, Haglund C, Arola J. Helsinki score-a novel model for prediction of metas-tases in adrenocortical carcinomas. Hum Pathol. 2015;46(3): 404–410.
9. Volante M, Sperone P, Bollito E, Frangipane E, Rosas R, Daffara F, Terzolo M, Berruti A, Papotti M. Matrix metalloproteinase type 2 expression in malignant adrenocortical tumors: diagnostic and prognostic significance in a series of 50 adrenocortical carcinomas. Mod Pathol. 2006;19(12):1563–1569.
10. Ronchi CL, Sbiera S, Kraus L, Wortmann S, Johanssen S, Adam P, Willenberg HS, Hahner S, Allolio B, Fassnacht M. Expression of excision repair cross complementing group 1 and prognosis in adrenocortical carcinoma patients treated with platinum-based chemotherapy. Endocr Relat Cancer. 2009;16(3):907–918. 11. Fenske W, V ¨olker HU, Adam P, Hahner S, Johanssen S, Wortmann S,
Schmidt M, Morcos M, M ¨uller-Hermelink HK, Allolio B, Fassnacht M. Glucose transporter GLUT1 expression is an stage-independent
predictor of clinical outcome in adrenocortical carcinoma. Endocr Relat Cancer. 2009;16(3):919–928.
12. Sbiera S, Schmull S, Assie G, Voelker HU, Kraus L, Beyer M, Ragazzon B, Beuschlein F, Willenberg HS, Hahner S, Saeger W, Bertherat J, Allolio B, Fassnacht M. High diagnostic and prognostic value of steroidogenic factor-1 expression in adrenal tumors. J Clin Endocrinol Metab. 2010;95(10):E161–E171.
13. Volante M, Terzolo M, Fassnacht M, Rapa I, Germano A, Sbiera S, Daffara F, Sperone P, Scagliotti G, Allolio B, Papotti M, Berruti A. Ribonucleotide reductase large subunit (RRM1) gene expression may predict efficacy of adjuvant mitotane in adrenocortical cancer. Clin Cancer Res. 2012;18(12):3452–3461.
14. McNicol AM, Struthers AL, Nolan CE, Hermans J, Haak HR. Proliferation in adrenocortical tumors: correlation with clinical outcome and p53 status. Endocr Pathol. 1997;8(1):29–36. 15. Terzolo M, Boccuzzi A, Bovio S, Cappia S, De Giuli P, Al`ı A,
Paccotti P, Porpiglia F, Fontana D, Angeli A. Immunohistochemical assessment of Ki-67 in the differential diagnosis of adrenocortical tumors. Urology. 2001;57(1):176–182.
16. Morimoto R, Satoh F, Murakami O, Suzuki T, Abe T, Tanemoto M, Abe M, Uruno A, Ishidoya S, Arai Y, Takahashi K, Sasano H, Ito S. Immunohistochemistry of a proliferation marker Ki67/MIB1 in adrenocortical carcinomas: Ki67/MIB1 labeling index is a pre-dictor for recurrence of adrenocortical carcinomas. Endocr J. 2008; 55(1):49–55.
17. Duregon E, Molinaro L, Volante M, Ventura L, Righi L, Bolla S, Terzolo M, Sapino A, Papotti MG. Comparative diagnostic and prognostic performances of the hematoxylin-eosin and phospho-histone H3 mitotic count and Ki-67 index in adrenocortical car-cinoma. Mod Pathol. 2014;27(9):1246–1254.
18. Beuschlein F, Weigel J, Saeger W, Kroiss M, Wild V, Daffara F, Lib´e R, Ardito A, Al Ghuzlan A, Quinkler M, Oßwald A, Ronchi CL, de Krijger R, Feelders RA, Waldmann J, Willenberg HS, Deutschbein T, Stell A, Reincke M, Papotti M, Baudin E, Tissier F, Haak HR, Loli P, Terzolo M, Allolio B, M ¨uller HH, Fassnacht M. Major prognostic role of Ki67 in localized adrenocortical carcinoma after complete resection. J Clin Endocrinol Metab. 2015;100(3): 841–849.
19. Papathomas TG, Pucci E, Giordano TJ, Lu H, Duregon E, Volante M, Papotti M, Lloyd RV, Tischler AS, van Nederveen FH, Nose V, Erickson L, Mete O, Asa SL, Turchini J, Gill AJ, Matias-Guiu X, Skordilis K, Stephenson TJ, Tissier F, Feelders RA, Smid M, Nigg A, Korpershoek E, van der Spek PJ, Dinjens WN, Stubbs AP, de Krijger RR. An international Ki67 reproducibility study in adrenal cortical carcinoma. Am J Surg Pathol. 2016;40(4):569–576.
20. Lalli E. Adrenocortical development and cancer: focus on SF-1. J Mol Endocrinol. 2010;44(6):301–307.
21. Doghman M, Karpova T, Rodrigues GA, Arhatte M, De Moura J, Cavalli LR, Virolle V, Barbry P, Zambetti GP, Figueiredo BC, Heckert LL, Lalli E. Increased steroidogenic factor-1 dosage trig-gers adrenocortical cell proliferation and cancer. Mol Endocrinol. 2007;21(12):2968–2987.
22. Doghman M, Figueiredo BC, Volante M, Papotti M, Lalli E. In-tegrative analysis of SF-1 transcription factor dosage impact on genome-wide binding and gene expression regulation. Nucleic Acids Res. 2013;41(19):8896–8907.
23. Bustelo XR. Vav family exchange factors: an integrated regulatory and functional view. Small GTPases. 2014;5(2):9.
24. Ruggiero C, Doghman-Bouguerra M, Sbiera S, Sbiera I, Parsons M, Ragazzon B, Morin A, Robidel R, Favier J, Bertherat J, Fassnacht M, Lalli E. Dosage-dependent regulation of VAV2 expression by steroidogenic factor-1 drives adrenocortical carcinoma cell in-vasion. Sci Signal. 2017;10(469).
25. Fassnacht M, Kroiss M, Allolio B. Update in adrenocortical car-cinoma. J Clin Endocrinol Metab. 2013;98(12):4551–4564. 26. Landis JR, Koch GG. The measurement of observer agreement for
categorical data. Biometrics. 1977;33(1):159–174.
27. Duregon E, Cappellesso R, Maffeis V, Zaggia B, Ventura L, Berruti A, Terzolo M, Fassina A, Volante M, Papotti M. Validation of the prognostic role of the“Helsinki Score” in 225 cases of adreno-cortical carcinoma. Hum Pathol. 2017;62:1–7.
28. Fragoso MC, Almeida MQ, Mazzuco TL, Mariani BM, Brito LP, Gonçalves TC, Alencar GA, Lima LdeO, Faria AM, Bourdeau I, Lucon AM, Freire DS, Latronico AC, Mendonca BB, Lacroix A, Lerario AM. Combined expression of BUB1B, DLGAP5, and PINK1 as predictors of poor outcome in adrenocortical tumors: validation in a Brazilian cohort of adult and pediatric patients. Eur J Endocrinol. 2012;166(1):61–67.
29. Jouinot A, Assie G, Libe R, Fassnacht M, Papathomas T, Barreau O, de la Villeon B, Faillot S, Hamzaoui N, Neou M, Perlemoine K, Rene-Corail F, Rodriguez S, Sibony M, Tissier F, Dousset B, Sbiera S, Ronchi C, Kroiss M, Korpershoek E, de Krijger R, Waldmann J, K D, Bartsch, Quinkler M, Haissaguerre M, Tabarin A, Chabre O, Sturm N, Luconi M, Mantero F, Mannelli M, Cohen R, Kerlan V, Touraine P, Barrande G, Groussin L, Bertagna X, Baudin E, Amar L, Beuschlein F, Clauser E, Coste J, Bertherat J. DNA methylation is an independent prognostic marker of survival in adrenocortical cancer. J Clin Endocrinol Metab. 2017;102(3):923–932. 30. Chabre O, Lib´e R, Assie G, Barreau O, Bertherat J, Bertagna X,
Feige JJ, Cherradi N. Serum miR-483-5p and miR-195 are pre-dictive of recurrence risk in adrenocortical cancer patients. Endocr Relat Cancer. 2013;20(4):579–594.
31. Patel D, Boufraqech M, Jain M, Zhang L, He M, Gesuwan K, Gulati N, Nilubol N, Fojo T, Kebebew E. MiR-34a and miR-483-5p are candidate serum biomarkers for adrenocortical tumors. Surgery. 2013;154(6):1224–1228, discussion 1229.
32. Szab ´o DR, Luconi M, Szab ´o PM, T ´oth M, Sz ¨ucs N, Hor ´anyi J, Nagy Z, Mannelli M, Pat ´ocs A, R ´acz K, Igaz P. Analysis of cir-culating microRNAs in adrenocortical tumors. Lab Invest. 2014; 94(3):331–339.
33. Liu-Chittenden Y, Patel D, Gaskins K, Giordano TJ, Assie G, Bertherat J, Kebebew E. Serum RARRES2 Is a prognostic marker in patients with adrenocortical carcinoma. J Clin Endocrinol Metab. 2016;101(9):3345–3352.