UNIVERSITÀ DEGLI STUDI DI CATANIA “AGRICULTURAL, FOOD AND ENVIRONMENTAL SCIENCE”
XXX CYCLE
ESTIMATION OF DICARBONYL COMPOUNDS INTAKE IN ITALY AND THEIR POTENTIAL ROLE
AGAINST FOOD SPOILAGE/PATHOGENIC BACTERIA
Selina Brighina
Advisor: Prof. Biagio Fallico Coordinator: Prof. Cherubino Leonardi
Acknowledgements
It is not easy to thank, in a few lines, all the people who participated in producing my Ph.D. Somebody helped me with constant collaboration and moral or material support, some else with advice, suggestions and words of encouragement.
I would like to thank my family for supporting me my Ph.D. studies, this experience would have been more difficult without their support and understanding.
I would like to express my sincere gratitude to my tutor, Professor Biagio Fallico, and the research team, Dr. Elena Arena and Dr. Cristina Restuccia, for the continuous support during my Ph.D. study and related research. Their guidance helped me in all the time of research and writing activity of this thesis.
I would like to thank all the Master's candidate followed in these years that allow me to grow from the working and personal point of view.
Further, I would like to thank to all my friends for their support and for all the experience that we had in the last three years.
To my Dad,
forever and ever Your Sparrow
Table of contents
1 Abstract 1
2 Sommario 3
3 Introduction 5
3.1 Degradation of sugar and Maillard reaction 5 3.2 Glyoxal, methylglyoxal and 3-deoxyglucosone 15
3.3 State of the art 19
3.3.1 1,2-dicarbonyl compounds in food 19 3.3.2 Total diet study (TDS) approach 22 3.3.3 Effect of 1,2-dicarbonyl compounds in vitro and in
vivo 26
3.3.4 Antimicrobial activity of 1,2-dicarbonyl compounds 27 3.4 Objectives of the thesis work 29
4 Materials and methods 31
4.1 Chemical 31
4.2 Microorganisms and culture conditions 31
4.3 Statistical analysis 32
4.4 Sampling of Italian foods 32 4.4.1 Sample preparation and 1,2-dicabonyl compounds
extraction 35
4.4.2 Derivatisation and HPLC analysis 36 4.4.3 Assessment of the dietary theoretical intake 40 4.5 Study of formation/degradation of dicarbonyl
4.6 Antimicrobial assay and determination of minimum inhibitory concentrations (MIC) 46 4.7 Influence of media and nutrients on the levels of
1,2-dicarbonyl compounds 47
5 Results 49
5.1 1,2-dicarbonyl compounds in Italian food 49 5.2 Dietary theoretical intake 53 5.3 Study of formation/degradation of dicarbonyl
compounds using food model systems 60 5.4 Antimicrobial assays and determination of minimum
inhibitory concentrations (MIC) 68 5.5 Influence of media and nutrients on the levels of
1,2-dicarbonyl compounds 71
6 Discussion 83
6.1 1,2-dicarbonyl compounds in Italian food 83 6.2 Dietary theoretical intake 85 6.3 Study of formation/degradation of dicarbonyl
compounds using food model systems 87 6.4 Antimicrobial assay and determination of minimum
inhibitory concentrations (MIC) 88 6.5 Influence of media and nutrients on the levels of
1,2-dicarbonyl compounds 89
7 Conclusion 90
1
1 Abstract
Foods, from the earliest times, are subjected to man-made modifications to ensure microbiological safety, enzymatic inactivation, destruction of toxic substances, and optimization of storage time. An undisputable role in making the food softer, tasty and preservable over time is exerted by heat treatment. It is during this phase that a series of chain reactions, known like Maillard's reaction, are triggered. During this reaction, products that affect the flavor, color and aroma of foods are formed. Among these, glyoxal, methylglyoxal and 3-deoxyglucosone are of particular importance.
These compounds are present in food, have antimicrobial activity, are promoters of advanced glycation end products formationand also have toxic effects in in vitro and in vivo studies.
Research activity carried out during Ph.D. study had a common thread: increasing knowledge on 1,2-dicarbonyl compounds.
In this field, the overall aims of this thesis work were: assessment of the content of dicarbonyl compounds in Italian food; assessment of their dietary intake; study of formation/degradation of dicarbonyl compounds using food model systems; evaluation of antimicrobial activity of the main dicarbonyl compounds; study of the interaction between the dicarbonyl compounds and the nutrients present in the microbiological culture media, both in the presence and absence of the microorganism.
The results obtained by the survey on Italian food show that the concentration is variable and the predominant
1,2-2
dicarbonyl compounds is 3-deoxyglucosone.
The estimation on dietary intake with a Total Diet Study-like investigation, have brought new evidence to assert that the ingestion with foods is high especially for infants (0-2 years) and children (3-9 years).
The results obtained with the model systems show that time, temperature and ingredients have a strong influence on the formation of the compounds and that it is possible to reduce the level of 1,2-dicarbonyl compounds.
The results of antimicrobial assays lead us to conclude that dicarbonyl compounds, especially GO and MGO, could have a role in the microbial stability of foods, although food composition may strongly influence their availability to act as antimicrobials.
The results obtained by the study of the interaction between the dicarbonyl compounds and the nutrients present in the culture media allow us to assert that the 1,2-dicarbonyl compounds are degraded very quickly when they come into contact with bacteria.
The results obtained outline a framework of knowledge that is a prelude to subsequent important developments.
3
2 Sommario
Gli alimenti, sin dai tempi più remoti, vengono sottoposti dall’uomo a una serie di modificazioni al fine di garantire un'adeguata sicurezza microbiologica, l’inattivazione enzimatica, la distruzione di sostanze tossiche e l’ottimizzazione del tempo di conservazione. Un ruolo indiscusso, nel rendere gli alimenti conservabili nel tempo, viene esercitato dal trattamento termico. È proprio durante questa fase che si innescano una serie di reazioni a catena, note con il nome di reazione di Maillard. Durante questa reazione si formano dei prodotti che influenzano il sapore, il colore e l’aroma degli alimenti. Tra questi prodotti di particolare importanza sono il gliossale, il metilgliossale e il 3-deossiglucosone.
Questi composti si ritrovano negli alimenti, hanno attività antimicrobica, sono precursori dei prodotti finale della glicosilazione avanzata ed inoltre hanno effetti tossici sia in studi in vitro che in vivo.
L’attività di ricerca svolta nel triennio di dottorato ha avuto un filo conduttore: l’ampliamento della conoscenza sui composti 1,2-dicarbonilici.
Il lavoro svolto durante il dottorato di ricerca, descritto nella presente tesi si propone di valutare il contenuto dei composti 1,2 dicarbonilici negli alimenti e la loro assunzione da parte del consumatore, studiare la formazione/degradazione di questi composti utilizzando sistemi modello, valutare la loro attività antimicrobica e studiare l’interazione di questi composti con i nutrienti presenti nei mezzi di coltura.
4
italiani ci permette di dire che la concentrazione è variabile e che il composto 1,2-dicarbonilico predominante è il 3-deossiglucosone.
La valutazione dell’assunzione tramite la dieta, effettuata con il “Total diet study like investigation”, ci permettere di asserire che l’ingestione tramite gli alimenti è alta specialmente per gli infanti (0-2 anni) e i bambini (3-9) anni.
I risultati ottenuti con i sistemi modello dimostrano che il tempo, la temperatura e gli ingredienti hanno una forte influenza sulla formazione di questi composti e che è possibile ridurne i livelli.
I risultati ottenuti dall’attività antimicrobica mostrano che i composti dicarbonilici, in particolare gliossale e metilgliossale, potrebbero avere un ruolo nella stabilità microbica degli alimenti, anche se la composizione dell’alimento può influenzare fortemente la loro disponibilità di agire come antimicrobici.
I risultati ottenuti dallo studio dell’interazione tra i composti dicarbonilici e i nutrienti presenti nei mezzi culturali di crescita dimostrano come i composti vengano degradati velocemente nel momento in cui interagiscono con il microrganismo.
I risultati ottenuti delineano un quadro di conoscenze che preludono importanti successivi sviluppi.
5
3 Introduction
3.1 Degradation of sugar and Maillard reaction
1,2-dicarbonyl compounds are reactive intermediates that are mainly formed from hexoses both during the acid-catalyzed dehydration of hexoses (pH < 3) and, if amino compounds are involved, during the early stage of Maillard reaction, as a degradation product of the Amadori compounds (pH range 4-7) (Yaylayan 1997; Thornalley et
al., 1999; Belitz et al., 2009).
Monosaccharides can react both in the presence and in the absence of amino acids. In a basic medium, enolizations with subsequent retro-aldol reactions and secondary reactions of the fragments predominate. In an acid medium enolizations and subsequent elimination of water with retention of the C-chain predominate (Belitz et al., 2009). For example, glucose can yield via enolitation and dehydration 3-deoxyglucosone (3-DG) and subsequently via C-C-cleavage yield methylglyoxal (MGO) (Figure 1). Instead fructose can yield glyceraldehydes and dihydroxyacetone that, after dehydration yield MGO (Figure 2).
6
Fig. 1: Enolitation, dehydration and C-C-cleavage of glucose.
7 When monosaccharides react in the presence of amino acidsthese reactions are called Maillard reaction.
Louis-Camille Maillard was first reported in 1912 of this reaction that is the result of a several pathway of chemical reactions.
This reaction is produced at medium/low water activity (aw) and basic pH.
Several factor affect the reaction:
Substrates: The main substrates involved are an α-hydroxy carbonyl moiety of a reducing sugar and an amino group. During the reaction there is a greater loss of sugar instead of the amino acid, as parallel chemical reactions occur such as caramelization. The sugars involved are mainly glucose, fructose, maltose, lactose and, to a smaller extent, reducing pentoses. For the amino component a primary amino group are more important than those with a secondary because their concentration in foods is usually higher. Exceptions are, e. g., malt and corn products that have a high proline content (Belitz et al., 2009); pH: The initial pH of foods and their buffering
capacity plays an important role in the type and intensity of the Maillard reaction. At pH<3 the rate of browning is low and then increases as the pH raise up to a maximum of 10 (Delgado-Andrade and Rufián-Henares, 2009);
Temperature: At high temperature the Maillard reaction will be more intense that at low temperatures but, the key factor is also the time
8 applied. The same degree of browning is obtained if a product is heated at a high temperature for a short time period or if it is heated at a lower temperature for a longer time.
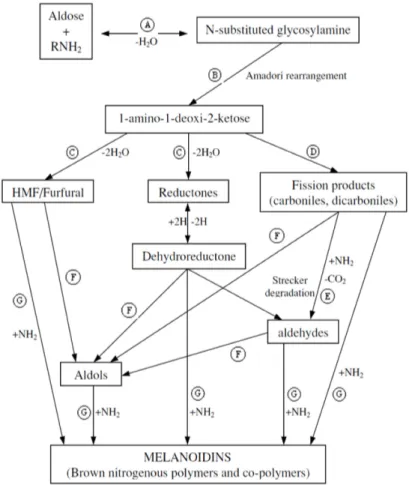
The general scheme of the Maillard reaction is shown in Figure 3.
9
Fig. 3: General scheme of the Maillard reaction (Rufián-Henares et al., 2009).
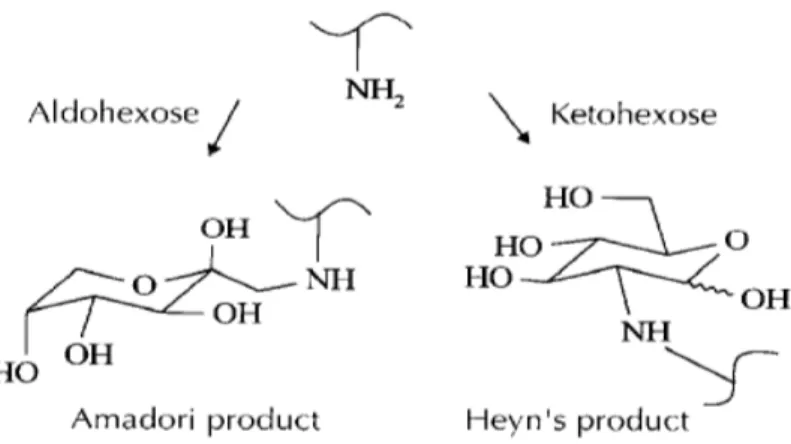
10 This reaction starts between an amino group and an α-hydroxy carbonyl moiety of a reducing sugar. In this step nucleophilic compounds like amino acids or amines easily add to the carbonyl function of reducing carbohydrates with the formation of imines (Schiff bases). (Belitz et al., 2009). The imines can rearrange via the 1,2-eneaminols corresponding to the 1,2-enediol.
This initial phase produces two intermediate: Amadori product from aldohexose or Heyn’s product from ketohexose (Figure 4).
11 The Amadori compounds are degraded to 1-, 3-, and 4-deoxydicarbonyl compounds (α-dicarbonyl compounds) in the pH range 4–7 (Figure 5) (Belitz et al., 2009).
These intermediate products can also be produced by autoxidation of glucose or by peroxidation of lipids (glyoxal and methylglyoxal) and yield many secondary products like 5-hydroxymethylfurfural, furfural, pyrrole or pyridine derivatives, compounds with a pyranone structure, maltoxazine, norfuraneol, acetylformoin, maltol, β-galactosyl-isomaltol, β-hydroxypropionic acid, lactic acid ester, furosine, pyrrole and pyridinium betaine (Belitz et al., 2009).
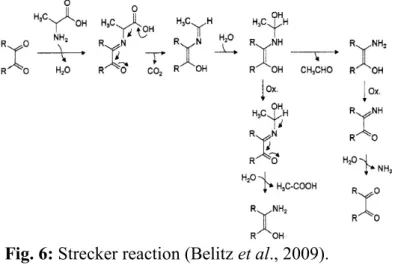
Furthermore, α-dicarbonyl compounds can react with amino acids lead to the formation aldehydes (like methional, phenylacetaldehyde, 3- and 2-methylbutanal and methylpropanal), CO2 and α-aminoketones. This reaction is
the Strecker reaction (Figure 6.) and occurs in foods at higher concentrations of free amino acids and at higher temperatures or under pressure (Belitz et al., 2009).
Subsequently, a range of reactions like cyclisations, dehydrations, retroaldolisations, rearrangements, isomerisations and further condensations lead to the formation melanoidins (Martins et al., 2001).
12
Fig. 5: Degradation of the Amadori compounds (Belitz et
13
Fig. 6: Strecker reaction (Belitz et al., 2009).
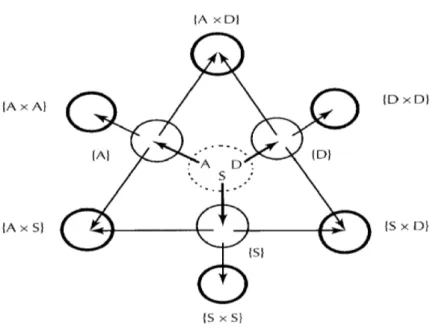
Yaylayan (1997), described a conceptual representation of the processes occurring during the Maillard reaction.
The main precursors of Maillard's reaction are sugars (S), amino acids (A) and Amadori and Heyn’s compounds (D) (Yaylayan, 1997), from which several intermediate products are formed. Under specific conditions, the nature and relative relationship of these precursors or "parent pool” determines the course of the Maillard reaction.
Each of these three major precursors can:
1. interact with each other to form three ‘self-interaction pools’ (Figure 7) (Yaylayan, 1997);
2. interact with components of other fragmentation pools to form three ‘secondary interaction pools’ (Figure 7) (Yaylayan, 1997);
14 3. The components of all the pools can interact with each other to form complex ‘multiple-interaction pools’ (Figure 7) (Yaylayan, 1997).
Fig. 7: Primary fragmentation groups of Maillard's reaction (Yaylayan, 1997).
15 3.2 Glyoxal, methylglyoxal and 3-deoxyglucosone
GO, MGO and 3-DG are the main reactive dicarbonyl compounds that can be derived from Maillard reaction and from oxidative glucose degradation.
MGO and 3-DG can be formed by glucose (as reported above in Figure 1).
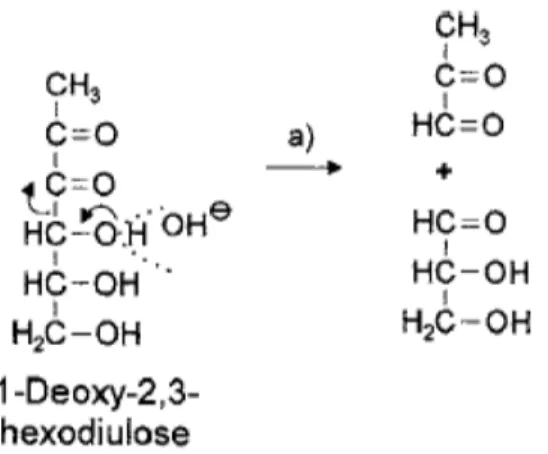
MGO can be derived by fructose (as reported in above in Figure 2) and starting from 1-deoxy-2,3-hexodiulose, after
retro-aldol reactions (Figure 8) (Belitz et al., 2009).
Fig. 8: Formation of MGO starting from 1-deoxy-2,3-hexodiulose by retro-aldol reactions (Belitz et al., 2009).
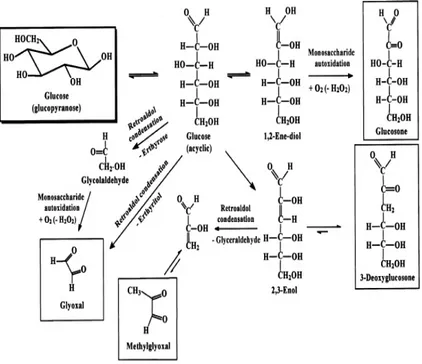
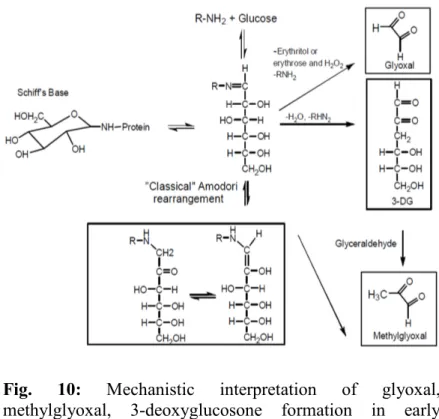
16 Thornalley et al., (2009), reported a mechanistic interpretation of glyoxal, methylglyoxal, 3-deoxyglucosone and glucosone formation in glucose degradation (Figure 9) and in the early glycation (Figure 10).
In their study the authors claim that glyoxal may be formed in the degradation of glucose by retroaldol condensation reactions activated by deprotonation of the 2- or 3-hydroxy groups (Thornalley et al., 2009). The formation of glyoxal is also stimulate by autoxidation of glycoaldehyde to glyoxal, and glucose to glucosone. 3-DG formation occur by a 2,3-enolization. Methylglyoxal may be formed by fragmentation of 3-DG (Figure 9).
Furthermore, they propose that the formation of dicarbonyl compounds in early glycation is mechanistically similarly to that of glucose degradation except for the presence of the the aldimine Schiff's base of the 1,2-dicarbonyl compounds (Figure 10). The presence of the aldimine group accelerates the formation of GO, MGO and 3-DG.
The 1,2-dicarbonyl compounds can be formed from the degradation of fructosyl-lysine.
17
Fig. 9: Mechanistic interpretation of glyoxal, methylglyoxal, 3-deoxyglucosone formation in glucose degradation (Thornalley et al., 2009).
18
Fig. 10: Mechanistic interpretation of glyoxal, methylglyoxal, 3-deoxyglucosone formation in early glication (Thornalley et al., 2009).
19
3.3 State of the art
3.3.1 1,2-dicarbonyl compounds in food
GO, MGO and the 3-DG are the main 1,2-dicarbonyl compounds generally identified in foods and beverages, particularly in those rich in sugar, with a wide range of concentration and distribution.
Few studies reported levels of α-dicarbonyl in foods. Weigel et al., (2004), for the first time, investigated the amounts of α-dicarbonyl compounds in commercial multifloral honeys and during storage; Marceau and Yaylayan (2009), identified the profile of α-dicarbonyl compounds in honeys of different botanical origins. The presence of 3-DG has also been reported in soy sauce as an indicator of the non-enzymatic browning reaction (Kato et
al., 1961; Kim and Lee 2008), in carbonated beverages (Lo et al., 2008) and in beer during aging (Bravo et al.,2008).
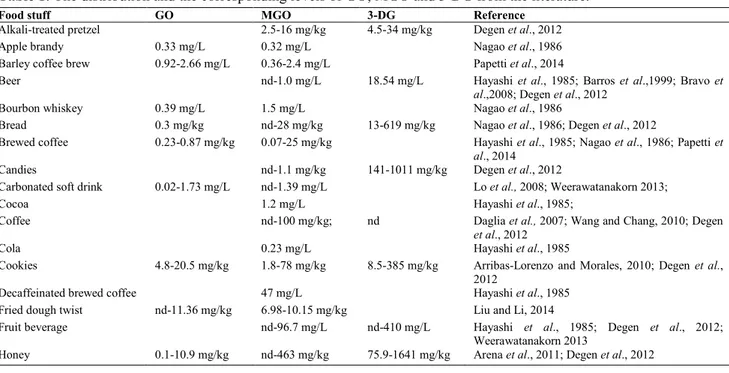
The distribution of 1,2-dicarbonyl in foods is reported in table 1.
20
Table 1: The distribution and the corresponding levels of GO, MGO and 3-DG from the literature.
Food stuff GO MGO 3-DG Reference
Alkali-treated pretzel 2.5-16 mg/kg 4.5-34 mg/kg Degen et al., 2012
Apple brandy 0.33 mg/L 0.32 mg/L Nagao et al., 1986
Barley coffee brew 0.92-2.66 mg/L 0.36-2.4 mg/L Papetti et al., 2014
Beer nd-1.0 mg/L 18.54 mg/L Hayashi et al., 1985; Barros et al.,1999; Bravo et
al.,2008; Degen et al., 2012
Bourbon whiskey 0.39 mg/L 1.5 mg/L Nagao et al., 1986
Bread 0.3 mg/kg nd-28 mg/kg 13-619 mg/kg Nagao et al., 1986; Degen et al., 2012
Brewed coffee 0.23-0.87 mg/kg 0.07-25 mg/kg Hayashi et al., 1985; Nagao et al., 1986; Papetti et
al., 2014
Candies nd-1.1 mg/kg 141-1011 mg/kg Degen et al., 2012
Carbonated soft drink 0.02-1.73 mg/L nd-1.39 mg/L Lo et al., 2008; Weerawatanakorn 2013;
Cocoa 1.2 mg/L Hayashi et al., 1985;
Coffee nd-100 mg/kg; nd Daglia et al., 2007; Wang and Chang, 2010; Degen
et al., 2012
Cola 0.23 mg/L Hayashi et al., 1985
Cookies 4.8-20.5 mg/kg 1.8-78 mg/kg 8.5-385 mg/kg Arribas-Lorenzo and Morales, 2010; Degen et al., 2012
Decaffeinated brewed coffee 47 mg/L Hayashi et al., 1985
Fried dough twist nd-11.36 mg/kg 6.98-10.15 mg/kg Liu and Li, 2014
Fruit beverage nd-96.7 mg/L nd-410 mg/L Hayashi et al., 1985; Degen et al., 2012;
Weerawatanakorn 2013
21
Instant coffee 0.34 mg/L 1.6-23 mg/L Hayashi et al., 1985; Nagao et al., 1986 Jam, jellies, sweeteners nd-3.9 mg/kg 1.7-1061 mg/kg Degen et al., 2012
Japanase sake 0.29 mg/L Nagao et al., 1986
Liquid
condiments/seasonings nd-3.9 mg/L nd-212 mg/L Degen et al., 2012
Malt beer tr.-1.0 mg/L 19-136 mg/L Degen et al., 2012
Manuka honey 139–700 mg/kg Mavric et al, 2008; Adams et al., 2008; Atrott et
al., 2012
Maple syrup 2.5 mg/L Hayashi et al., 1985
Nonfat dry milk 1.4 mg/L Hayashi et al., 1985
Pasta (cooked) nd nd-8.8 mg/L Degen et al., 2012
Potatoes (cooked/fries) nd-tr nd-18 mg/kg Degen et al., 2012
Rice, millet, mustard 2.2-5.4 mg/kg Nemet et al., 2006
Soft drink nd nd-1.4 mg/L nd-28 mg/L Nagao et al., 1986; Degen et al., 2012
Soy sauce 0.62-4.9 mg/L nd-12 mg/L 32-832 mg/L Kato et al., 1961; Hayashi et al., 1985; Nagao et
al., 1986; Nagao et al., 1986a; Kim and Lee 2008;
Degen et al., 2012; Papetti et al 2014
Tea beverage 0.02 mg/L 0.05-253 mg/L Hayashi et al., 1985; Nagao et al., 1986;
Weerawatanakorn, 2013
Vinegars 1.7-53 mg/L 4.6-2622 mg/L Degen et al., 2012
Wine 0.97 mg/L nd-4.5 mg/L 2.2-95 mg/L Hayashi et al., 1985; Nagao et al., 1986; Barros et
al.,1999; Degen et al., 2012
22 There are less information concerning the levels of 1,2-dicarbonyl compounds on Italian food. Arena et al., (2011), reports the level of 1,2-dicarbonyl compounds in 40 commercial honey from different floral origins. The concentration of 3-DG ranged from about 76 to 800 mg/kg, values for GO e MGO were 0.1-10.9 and 0.2-2.9 mg/kg, respectively. Moreover, pH and total phenols are the main chemical characteristics that most influenced the levels of 1,2-dicarbonyl compounds in honey.
3.3.2 Total diet study (TDS) approach
Estimation of food intakes is necessary for risk evaluation, and to determine relationships between adverse effects observed in humans and exposure to particular substances (FAO/WHO 1985). These exposure assessments can be used for regulation of nutritional or chemical products and for safety of food products.
The Total Diet Study (TDS) (EFSA, 2011) is one method used in many countries to address this issue.
TDS is a selection of foods represent a typical diet, whose based on food consumption data that will allow us to estimate population exposure to these substances.
A TDS differs from other chemical monitoring or monitoring programs because it always focuses on chemicals through total diet, food is transformed as actually consumed by the population (cooked or otherwise), so it is believed that the impact of food preparation and cooking on the chemical substance under consideration gives a realistic estimate of exposure and also only the edible part of the
23 food is analyzed (EFSA, 2011).
The first step is the selection of chemical substances to be analysed. They may influence the food selection, pooling and sampling process. The criteria are:
chemical substances for which their presence and level in food are uncertain;
use of health data;
chemical substances that are recognised as potential health risk to the population, political or socio-economic reasons;
budgetary issues.
The TDS survey will provide background information on harmful and beneficial chemical substance levels in the general food supply across the diet, while monitoring and surveillance activities can capture more highly contaminated individual food items. Their complementarities will allow the identification of the relative importance of individual sources of chemical substances in relation to their contribution in the whole diet.
Steps characterizing a TDS include the selection of foods based on food consumption data to represent as best as possible a typical diet, their preparation to food as consumed and the subsequent pooling of related foods before analysis. The central part of the TDS design is a food list.
The composition of the food list will also be determined by the objective(s) of the study, the allocated funds and available food consumption data.
24 (e.g. different age and gender groups, ethnic groups or special groups such as vegetarians), more foods need to be analysed individually (because their consumption is different among the population groups), as compared to one population group, e.g. general population, per capita, per adult equivalent.
Once the foods are selected, it-s necessary to determine if it is an international, national or regional/local food. National foods are considered to have a similar distribution for the levels of chemicals throughout the country (e.g. brand name foods produced in a central factory), while regional foods may have different levels depending on the region and/or season (e.g. fruits and vegetables, tap water etc.).
After selecting the foods, it is necessary establish the pooling (creating a unique food sample for analysis by combining various individual food items). To create pooling two types of approach can be considered:
1. individual food approach in which different form of the same food or the food cooking whit different methods merged into one food sample;
2. mixed food approach in which several different foods from the same food group merged into one food sample.
After calculating the concentration in foods of the chemical substanceschosen, it is necessary to calculate the dietary exposure. Population exposure using TDS results is calculated as any other dietary exposure assessment.
The Codex Alimentarius Commission’s (CAC) Procedural Manual (FAO/WHO, 2008a) defines exposure assessment
25 as “the qualitative and/or quantitative evaluation of the likely intake of biological, chemical, and physical agents via food as well as exposures from other sources if relevant”. The general equation for both acute and chronic dietary exposure (FAO/WHO 2009) is:
Dietary exposure=Σ(𝑐𝑐𝑐𝑐𝑐𝑐𝑐𝑐𝑐𝑐𝑐𝑐𝑐𝑐𝑐𝑐𝑐𝑐𝑐𝑐𝑐𝑐𝑐𝑐𝑐𝑐 𝑐𝑐𝑜𝑜 𝑐𝑐ℎ𝑐𝑐𝑒𝑒𝑐𝑐𝑐𝑐𝑐𝑐𝑒𝑒 𝑐𝑐𝑐𝑐 𝑜𝑜𝑐𝑐𝑐𝑐𝑓𝑓×𝑜𝑜𝑐𝑐𝑐𝑐𝑓𝑓 𝑐𝑐𝑐𝑐𝑐𝑐𝑐𝑐𝑐𝑐𝑒𝑒𝑐𝑐𝑐𝑐𝑐𝑐𝑐𝑐𝑐𝑐) 𝐵𝐵𝑐𝑐𝑓𝑓𝐵𝐵𝐵𝐵𝑐𝑐𝑐𝑐𝐵𝐵ℎ𝑐𝑐 (𝐾𝐾𝐵𝐵)
To calculate exposure two approaches can be used: the deterministic/point estimates of dietary exposure and the probabilistic distributional analyses.
The first one is a single value that describes some parameter of consumer exposure. For concentration data, the point estimate typically consists of the mean, the median, a high percentile of all observed values point. For food consumption data, the point estimate typically consists of the mean or a high percentile of all the consumption values of a considered food in a population of interest.
In the probabilistic distributional analyses instead of a single value, at least one variable is represented by a distribution function. In this way the model sample from each distribution is a distribution of potential dietary exposures. Exposure can be expressed as a quantity of ingested chemical substances per capita, by day, by week or by month. Nevertheless, many health-based guidance values for food chemical substances are usually expressed as a quantity of ingested chemical substance per kg of body weight and per period of time. If available, the body weight of each subject should be used for individual exposure. If not, the
26 international default of a mean weight of 60 kg for adults and 15 kg for children should be used (FAO/WHO, 2009). For nutrients, intakes are expressed per individual per day and compared with reference values also expressed in the same unit.
The exposure can be calculated for the mean as well as for different percentiles for the population.
Sometimes, the chemical substances chosen are only present in particular food groups.
When the TDS approach is used whit only particular food groups known to be major contributors to exposure for the considered chemical substances, these study studies are classified as TDS-like investigations.
3.3.3 Effect of 1,2-dicarbonyl compounds in vitro and in vivo
1,2-dicarbonyl compounds have toxic effects in in vitro and
in vivo studies. These compounds have cytotoxicity
properties (Yang et al., 2011), inhibit the replication of DNA (Murata-Kamiya and Kamiya, 2001), bind to DNA and form mutations (Kasai et al., 1998), promoting tumor growth in the small intestine in Min mice model (Svendsen
et al., 2016). In vivo studies these compounds have tumor
promoting activity (Takahashi et al., 1989), increase DNA breaks (Furihata et al., 1989; Ueno et al., 1991), cause insulin resistance in mice and in muscle cells (Nigro et al. 2014; Riboulet-Chavey et al., 2006), concur to dysfunction of adipose tissue (Matafome et al., 2012), cause microvascular damage and other diabetes-like complications (Berlanga et al., 2005).
27 Furthermore, GO, MGO and 3-DG in physiological systems mediating dicarbonyl stress (Rabbani and Thornalley, 2015) and promote Advanced Glycation End-products (AGEs) (Nagai et al., 2012).
However, high level of plasmatic MGO can be derived from exogenous sources, such as food. The effects arising from the assumption of these compounds with food have not yet investigated.
3.3.4 Antimicrobial activity of 1,2-dicarbonyl compounds
Recent studies have also attributed to 1,2-dicarbonyl compounds antimicrobial activity on various microorganisms, including Listeria monocytogenes,
Staphylococcus aureus, Escherichia coli, Staphylococcus epidermidis, Pseudomonas aeruginosa, Proteus mirabilis
and Streptococcus mutans (Daglia et al., 2007a, Mavric et
al., 2008). In particular, MGO was identified as the
dominant antibacterial component of manuka honey, where it is produced non-enzymatically from dihydroxyacetone (DHA) present in manuka nectar. Although it has been known that MGO has antibacterial activity against Gram-positive bacteria, including methicillin-resistant S. aureus and vancomycin-resistant Enterococcus, less information is available with regard to its activity against Gram-negative bacteria. Hayashi et al., (2014), reported the effect of methylglyoxal against multidrug-resistant P. aeruginosa (MDRP) using 53 clinically isolated strains. They also assessed the effect of deleting the five multidrug efflux systems in P. aeruginosa, as well as the efflux systems in E.
28 MICs of methylglyoxal. The results indicated that MGO inhibits the growth of MDRP at concentrations of 128–512 μg/ml (1.7–7.1 mM) and is not recognized by drug efflux systems. However, MGO possesses instability in air and strong enzyme induced degradation that limit its application. To circumvent this emerging problem, Ghosh et al., (2014) have developed a green strategy of using multivalent, biodegradable polymers such as chitosan, and dendrimers for the facile preparation of conjugated nanoformulations (NMG and DMG) of MGO as an antimicrobial agent against resistant bacteria. Interestingly, nanoformulated MGO selectively interferes with the bacterial pathogens while remaining biocompatible to the mammalian cells as reflected in therapeutic index. The functional group, cationic charge and nanosize of MGO allows them to attach to and insert into membrane bilayers of bacteria and could be the defining mechanisms of antimicrobial activity.
Glyoxal, together with methylglyoxal, and diacetyl compounds formed during the roasting process are the main agents responsible for the antibacterial activity of brewed coffee against S. aureus and S. mutans (Daglia et al., 2007a).
Hrynets et al., (2016) studied glucosamine browning at 50 °C, with (GlcN/Fe2+) or without iron (GlcN), over time from
0 to 48 h. Generation of α-dicarbonyls (MGO, GO and 3-DG) was evaluated, as well as their antimicrobial activity. The presence of iron significantly increased the concentration of α-dicarbonyls at an early incubation time (3 h). GlcN/ Fe2+ (48 h) exhibited a MIC50 against highly
heat-resistant E. coli AW 1.7 at pH 5, but not at pH 7. Among α-dicarbonyls, MGO was the most effective
29 followed by diacetyl (DA), GO, 3-DG, and glucosone (G). The MIC50 at pH 5 was 0.05 (MGO), 0.1 (DA), 0.4 (GO), 1.0 (3-DG), and 23.5 g/L (G). Increasing the pH caused an increase in MIC50 by 4.3, 3.0, 2.0, 1.7, and 1.3 times for MGO, DA, GO, 3-DG, and G, respectively. GlcN caramel solutions have, therefore, the potential to serve as both flavoring compounds and antimicrobial agents in formulated food systems.
Further to be present in the foods, 1,2-dicarbonyl compounds have antimicrobial activity.
However, the mechanism of action of these molecules has not yet been investigated.
3.4 Objectives of the thesis work
The aim of this Ph.D. project is to clarify the safety of the main dicarbonyl compounds generally present in food (glyoxal, methylglyoxal and the 3-deoxyglucosone) and their antimicrobial activity, with the purpose to suggest a possible use of this substances as preservatives.
Within the overall objective mentioned above, this Ph.D. thesis project can be subdivided into the following activities: Assessment of the content of dicarbonyl compounds in Italian food with the purpose of acquiring a complete picture of the distribution of these compounds in food;
Assessment of the dietary theoretical intake;
Evaluation of formation/degradation of dicarbonyl compounds using food model systems;
30 Evaluation of antimicrobial activity against food
spoilage and human-pathogenic bacterial strains; Assessment of the interference of microbiological
culture media and nutrients on the levels of 1,2-dicarbonyl compounds.
31
4 Materials and methods
4.1 Chemical
High purity (P >98%) sucrose, fructose, glucose, o-phenylenediamine (OPD) and glyoxal (GO) and methylglyoxal (MGO) solutions were purchased from Sigma-Aldrich (St. Louis, Mo., USA). 3-deoxyglucosone (3-DG) was purchased from Santa Cruz Biotechnology, Inc. (Santa Cruz, CA, USA). Methanol, acetic acid and water were of HPLC grade and obtained from JT Baker (Deventer, Holland). Gemini NX C18 (150 mm × 4.6 mm, 5 μm) columns were obtained from Phenomenex (Torrance, CA, USA). Syringe filters (0.45 μm) were supplied by Albet. Tryptone Soya Agar, Tryptone Soya Broth were purchased from Oxoid (Basingstoke, UK).
4.2 Microorganisms and culture conditions
The bacterial strains used in this study were five reference strains and three clinical strains. The clinical isolates, provided by the Laboratory of Microbiology of Azienda Ospedaliero-Universitaria "Policlinico-Vittorio Emanuele" (Catania, Italy), were Escherichia coli, Bacillus cereus and
Staphylococcus aureus. These strains were isolated from
human faeces and blood.
The reference strains, provided by DSMZ (Deutsche Sammlung von Mikroorganismen und Zellkulturen, Braunschweig, Germany), were: Escherichia coli 10198,
Pseudomonas fluorescens 50091, Staphylococcus aureus
1104, Listeria innocua 20649 and Salmonella typhimurium 14028.
32 Bacterial strains were stored at 4°C on Petri dishes containing on Tryptone Soya Agar.
4.3 Statistical analysis
Data were analyzed separately by using the Statistical software (Minitab 16 Statistical Software Minitab Inc., State College, Pennsylvania, USA). The arithmetic means were calculated and analyzed by using one-way analysis of variance
(ANOVA) submitted to evaluate the significant differences (p < 0.05) according to Fisher’s method.
4.4 Sampling of Italian foods
A total of 53 food items belonging to different food categories was selected (Table 2). Food samples were purchased in different local supermarkets. Wheat bread and durum wheat bread samples were both from local industrial and artisanal bakery.
Table 2: Sampling food.
Sample Code Type of product Producer
(n>1)
Biscuit 1 No butter and eggs A
Biscuit 2 No butter and eggs B
Biscuit 3 No butter and eggs C
Shortcake 4 With butter and eggs A
Shortcake 5 With butter and eggs D
Shortcake 6 With butter and eggs E
White bread 7 White flour F
White bread 8 White flour G
White bread 9 White flour H
33
Durum wheat bread 11 Semolina J
Durum wheat bread 12 Semolina K
Durum wheat bread 13 Semolina M
Industrial durum wheat bread 14 Semolina N
Industrial durum wheat bread 15 Semolina N
Industrial durum wheat bread 16 Semolina O
Pasta 17 Spaghetti P
Pasta 18 Spaghetti P
Pasta 19 Spaghetti P
Fruit juice 20 Grapefruit Q
Fruit juice 21 Orange Q
Fruit juice 22 Pineapple R
Fruit juice 23 Grapefruit R
Fruit juice based drink 24 Pear S
Fruit juice based drink 25 Peach S
Fruit juice based drink 26 Pear S
Fruit juice based drink 27 Pear T
Fruit juice based drink 28 Pear Q
Fruit juice based drink 29 Peach R
Fruit juice 30 Pineapple Q
Fruit juice based drink 31 Peach R
Fruit juice based drink 32 Pear R
(n=1)
Jam 33 Strawberry U
Jam 36 Peach U
Jam 37 Williams pear U
Jam 38 Cherry U Jam 39 Apricot U Marmalade 40 Orange U Honey 41 Multifloral V Honey 42 Multifloral w Honey 43 Multifloral X Honey 44 Multifloral Y Honey 45 Eucalyptus Z Honey 46 Eucalyptus X Honey 47 Thistle X
34
Coffee 48 Arabica AA
Coffee 49 Arabica AA
Coffee 50 Arabica AA
Whole Milk UHT 51 BB
Whole Milk UHT 52 BB
Whole Milk UHT 53 CC
35
4.4.1 Sample preparation and 1,2-dicabonyl compounds extraction
Pasta: Preparation of pasta was carried out following the instructions given by the manufacturer on the packaging. 100 g of pasta were cooked into a suitable Pyrex glass container with boiling water (1 L) and 7 g of salt. After 8 minutes recommended, the sample was placed in a sieve to remove the cooking water and immediately cooled with cold tap water.
Coffee: Coffee samples were prepared with a moka coffee maker. To obtain coffee, 180 mL of distilled water was placed into the boiler and 18.68 g of coffee powder was placed into the filter dispenser. The moka was placed on a hot plate and the coffee was obtained in 5 minutes and 44 seconds.
Bread, shortcake and biscuits: All the samples were ground in a home grinder (La Moulinette, Moulinex, 2002).
Jam and marmalade: All the samples were mechanically homogenized in water by Ultra-Turrax and then diluted. After samples preparation, 1,2dicarbonyl compounds were extracted and derivatized as follow.
5 g of the ground or liquid sample (except for fruit juices, fruit juices based drinks and milk) was transferred into a volumetric flask (50 ml), and 25 ml of water was added (JT. Baker, Deventer, Holland). The solution was stirred for 10 min, and then the sample was diluted up to 50 ml with distilled water (JT. Baker, Deventer, Holland) and centrifuged for 45 min at 5000 rpm.
16 mL of fruit juices, fruit juices based drinks and milk, after centrifugation for 20 min at 5000 rpm, was transferred
36 into a volumetric flask and diluted up to 10 ml with distilled water. The solution was stirred for 10 min.
The remaining samples did not need preliminary preparations.
4.4.2 Derivatisation and HPLC analysis
An aliquot of the supernatant was filtered through a 0.45 μm filter (Albet). An aliquot (1 mL) of the filtered supernatant was mixed with a 0.2% (w/v) aqueous solution of OPD and were allowed to react at room temperature for 12 h in the absence of light. After 12 h the derivatised mixture was analyzed by measuring their corresponding quinoxalines according to Arena et al., (2011).
The samples were injected into an HPLC (Spectra System) equipped with a diode array detector (DAD – UV 6000 LP) and an autosampler (AS 3000) (Thermo Electron, San Jose, Calif., USA). The HPLC column used was a Phenomenex NX C18 (250 mm× 4.6 mm, 5 μm).
The detector wavelength was set to 312 nm and HPLC conditions were: eluent A was 0.1% (v/v) acetic acid in water and eluent B was methanol; flow rate, 0.7 mL/min; injection volume, 20 μL. The gradient program was: t0 85% A and 15% B; t10 65% A and 35% B; t15 35% A and 65% B; t25 100% B; t30 85% A and 15% B.
All compounds were identified by comparing retention times and UV spectra with those of standards and by splitting each sample with standards. Quantification of each compounds was performed using external calibration curves.
37 compounds, was validated by the determination of linearity, limits of detection (LODs), limits of quantification (LOQs) and precision. Linearity was checked for 3-DG between 3.25 and 40.62 mg/kg; for GO between 1.66 and 25.2 mg/Kg and for MGO between 0.83 and 36.00 mg/kg. Good linearity of the HPLC method was established over 2 orders of magnitude (R2 = 0.999–1.000) for all 1,2-dicarbonyl
compounds. Figure 11, 12 and 13 reported the calibration curve for 3-DG, GO, and MGO, respectively.
LOD and LOQ were calculated as 3σ/slope and 10σ/slope, respectively. The precision of the method was expressed as the repeatability relative standard deviation (RSDr).
The extraction procedure and the analyses were performed in duplicate for each sample, the reported concentration of each dicarbonyl compound was therefore the average of four values. The results were expressed as mg of dicarbonyl compound/kg.
38
Fig. 11: Calibration curve of 3-DG.
39
40
4.4.3 Assessment of the dietary theoretical intake
A TDS-like investigations was applied because only some food groups are known to be major contributors to exposure for the 1,2-dicarbonyl compounds and not the total diet. In order to evaluate the intake of 1,2-dicarbonyl compounds whit food, the average values obtained were correlated whit the average consumption expressed in mg/kg body weight/day for each food categories, and for the whole food intake. The average value obtained has been multiplied for 2 and 3 times standard deviation and then was correlated with the high percentiles (95th, 99th) respectively.
The theoretical intake was evaluated also for age for total population and for age for south & islands.
Table 3 and 4 reports mean, median, high percentiles (95th,
99th) of individual consumption (g/kg body weight/day) by
food category and age for total population and for south & islands respectively.
For consumption data, survey on food consumption in Italy (INRAN SCAI 2005-06) was utilize. The food samples were regrouped into the category showed in table 5.
41 Table 3: Mean, high percentiles (95th, 99th) of individual consumption (g/kg body weight/day) by food category and age for total population.
Sample Age category Mean 95th 99th
Biscuits
Total Population
0.26 1.13 2.48
Bread 1.66 3.99 6.01
Fruit and vegetable juices 0.78 3.92 10.98
Jam 0.05 0.31 0.61 Honey 0.27 0.73 1.21 Coffee 2.03 5.48 9.75 Milk 2.73 7.20 20.83 Biscuits Infants (0–2 years) 1.34 3.64 4.01 Bread 1.46 7.04 7.88
Fruit and vegetable juices 5.45 22.11 28.57
Jam 0.03 0.29 0.80 Honey 0.50 2.28 3.05 Coffee 1.12 9.86 19.23 Milk 40.25 183.33 280.00 Biscuits Children (3–9 years) 0.80 2.91 4.50 Bread 2.95 7.63 13.18
Fruit and vegetable juices 3.46 12.3 21.33
Jam 0.08 0.55 0.88 Honey 0.42 1.46 3.00 Coffee 1.45 7.81 21.88 Milk 8.53 20.26 35.78 Biscuits Teenagers (10–17 years) 0.46 1.54 3.16 Bread 1.97 4.80 6.60
Fruit and vegetable juices 1.75 8.17 12.24
Jam 0.04 0.26 0.43 Honey 0.24 0.73 1.15 Coffee 1.29 5.56 9.44 Milk 3.07 6.77 10.44 Biscuits Adults (18–64 years) 0.19 0.78 1.44 Bread 1.52 3.57 4.80
Fruit and vegetable juices 0.45 2.56 4.75
Jam 0.05 0.30 0.57
Honey 0.26 0.69 1.07
Coffee 2.05 5.33 9.22
Milk 1.55 4.35 5.56
42
Bread Elderly
(65 years and above)
1.68 3.84 5.17
Fruit and vegetable juices 0.33 2.30 4.40
Jam 0.05 0.33 0.59
Honey 0.26 0.69 0.98
Coffee 1.91 5.40 7.69
Milk 1.88 5.00 6.12
43 Table 4: Mean, median, high percentiles (95th, 99th) of individual consumption (g/kg body weight/day) by food category and age for south & islands.
Sample Age category Mean 95th 99th
Biscuits
Total Population
0.19 0.81 1.79
Bread 1.67 4.00 6.21
Fruit and vegetable juices 0.76 4.18 11.86
Jam 0.03 0.20 0.51 Honey 0.22 0.61 0.95 Coffee 1.92 5.48 9.75 Milk 3.07 8.20 25.64 Biscuits Infants (0–2 years) 0.99 2.46 2.56 Bread 1.19 5.62 7.04
Fruit and vegetable juices 5.53 20.83 28.57
Jam 0.06 0.37 0.80 Honey 0.44 1.00 30.5 Coffee 0.47 3.13 6.67 Milk 49.72 256.67 280.00 Biscuits Children (3–9 years) 0.54 2.00 3.54 Bread 3.24 9.17 16.47
Fruit and vegetable juices 3.83 14.81 22.22
Jam 0.06 0.44 0.73 Honey 0.38 0.8 3.00 Coffee 0.91 5.96 21.88 Milk 9.29 18.67 59.10 Biscuits Teenagers (10–17 years) 0.33 1.23 3.16 Bread 2.09 4.93 7.57
Fruit and vegetable juices 1.90 9.13 14.63
Jam 0.04 0.21 0.43 Honey 0.18 0.68 1.21 Coffee 0.49 2.02 7.14 Milk 3.36 6.78 10.44 Biscuits Adults (18–64 years) 0.13 0.52 1.13 Bread 1.47 3.40 4.49
Fruit and vegetable juices 0.30 2.00 3.92
Jam 0.03 0.20 0.49
44
Adapted from INRAN-SCAI 2005-06 appendices 1-B4, 8-B4, 14-B4, 11-B4
Table 5:Food categories used.
Food categories Single food items
Cereals, cereal products and substitutes
Bread Wheat bread, durum
wheat bread, industrial and artisanal durum
wheat bread
Pasta Industrial pasta
Biscuits Biscuits and shortcake
Water and other non-alcoholic beverages
Fruit, fresh and processed Fruit juice and fruit juice based drink
Coffee, tea, herbal tea and substitutes Coffee Sweet products and substitutes
Candies, jam and other sweet products Jam and marmalade
Sugar, fructose, honey and other
nutritious sweeteners Honey and Honey of Sicilian black bee Milk, milk products and substitutes Milk
Coffee 1.44 3.43 5.73 Milk 1.46 4.17 5.55 Biscuits Elderly (65 years and above) 0.12 0.46 1.05 Bread 1.71 3.50 4.63
Fruit and vegetable juices 0.15 1.09 2.22
Jam 0.01 0.16 0.28
Honey 0.19 0.58 0.83
Coffee 1.28 3.46 3.87
45
4.5 Study of formation/degradation of dicarbonyl compounds using food model systems
Five recipes were prepared by varying the types of fat and sugar. All ingredients were purchased from local supermarkets. Model biscuits were prepared according to a recipe described in the American Association of Cereal Chemists (AACC) Method 10-54 (American Association of Cereal Chemists (AACC) International, 2000) with some modifications. The recipe for the control biscuits was as follows: 240 g of wheat flour (100 units), 100.8 g of sugar (sucrose, fructose or glucose, 42 units), 96 g of butter (40 units), 3 g of salt (1.3 units), 2.4 g of sodium bicarbonate (1.0 units), 1.2 g of ammonium bicarbonate (0.5 units) and 52.8 mL of deionised water (22 units). According to recipe, all of the ingredients were thoroughly mixed using a dough mixer (model 1596, Ariete, Italy) for 7 min. Afterwards, the dough was laminated three times using a manual laminator (Imperia, Lusso, sp 150 model, Bologna, Italy) and was formed into discs with a diameter of 5 cm and a thickness of 0.2 cm. Seventy-five biscuits were obtained from each batch of dough. The biscuits were baked in a laboratory oven (Thermo Scientific, Heratherm oven, Italy) at three different temperatures, 150°C, 170°C and 190°C, for different time (5, 10, 15, 20 and 25 min) to monitor chemical changes in biscuits composition in terms of GO, MGO, and 3-DG. Baking temperatures used in this study were in the range suggested for short doughs (Manley, 2001). Fifteen biscuits were sampled for each time point. They were immediately cooled in a fridge at 4°C for 2 h and then ground in a home
46 grinder (La Moulinette, Moulinex, France) before chemical analyses.
An aliquot of the milled sample (1 g) was transferred to a volumetric flask (10 mL) and 5 mL of deionised water was added. The solution was stirred for 10 min, then the sample was diluted to 10 mL with deionised water and centrifuged at 10°C for 15 min at 8500 rpm (ALC 4128, Italy).
The derivatization and the HPLC analyses were conducted as reported on section 4.4.2.
The extraction procedure and the analyses were performed in duplicate, the reported concentration of each dicarbonyl compound was therefore the average of four values. The results were expressed as mg of dicarbonyl compound/kg of biscuit dry matter.
4.6 Antimicrobial assay and determination of minimum inhibitory concentrations (MIC)
Twenty-four-hour bacterial cultures grown on TSA at 37°C were suspended in sterile physiologic solution (0.9% NaCl). The suspensions were adjusted to 107 cells/mL. One mL was
placed into a sterile Petri dish and then 20 mL of sterilised melted TSA (~45°C) was poured into the plate and mixed gently and thoroughly. After solidification, wells that were 10 mm in diameter were bored into the medium, and 0.4 mL of the 1,2-dicarbonyl compound solutions were placed into the wells. The ranges for GO, MGO and 3-DG were 126 to 3060 mg/kg, 66 to 3488 mg/kg and 400 to 10000 mg/kg, respectively.
The plates were incubated at 37°C until there was evidence of antimicrobial activity (24-72h). The antimicrobial effect
47 was considered positive when a clear zone of inhibition surrounded the well. The minimum inhibitory concentrations (MIC) corresponds to the lowest concentration for which a zone of inhibition zone was detected. The assays were performed in triplicate.
4.7 Influence of media and nutrients on the levels of 1,2-dicarbonyl compounds
Twenty-four-hour bacterial cultures of two target microorganism (S. aureus DSMZ 1104 and E. coli DSMZ 10198) were suspended in sterile physiologic saline solution and in Tryptic Soy Broth (TSB). The suspensions were adjusted to 5×10⁸ cells/mL and then 100 μL of the
1,2-dicarbonyl compounds at three different concentrations [MIC (Minimum Inhibitory Concentration), 1/2 and 1/4 MIC], were placed into the test tubes.
As control, test tubes containing bacterial cultures without 1,2-dicarbonyl compounds solution were used. The test tubes were incubated at 37°C. The bacterial growth (CFU/mL) into the test tubes was analyzed every 10 minutes up to one hour. One hundred μL of each tube solution were plated onto TSA using a spiral Plater Eddy Jet. The means of colonies growth (log10 CFU/mL) was evaluated after 24 h
at 37°C. After this preliminary test, the next step was to determine the stability and interaction between the dicarbonyl compounds and the nutrients present in the culture media.
GO and MGO, were chosen, at three different starting concentrations [MIC (Minimum Inhibitory Concentration), 1/2 and 2 MIC], in the following culture conditions:
48 1. Distilled water;
2. TSB;
3. TSB+ E. coli DSMZ 10198 4. TSB+ E. coli clinical strain; 5. TSB+ S. aureus DSMZ 1104; 6. TSB+ S. aureus clinical strain.
The following reaction times (minutes) were selected: T0, T30, T60, T90, T150, T210, T240, T250, and T270.
For 3-DG, experiments were designed to evaluate the residual concentration up to 24 h after it was placed in the culture conditions reported above, with the following concentrations: 537 mg/kg, 1240 mg/kg and 1930 mg/kg. The two target microorganism were S. aureus DSMZ 1104 and E. coli DSMZ 10198.
Test tubes containing bacterial strains and dicarbonyl compounds were centrifuged at 9000 rpm for 5 minutes. The derivatization and the HPLC analyses of samples were conducted as reported on section 4.4.2.
49
5 Results
5.1 1,2-dicarbonyl compounds in Italian food
An HPLC method was used to quantify 3-DG, GO, and MGO, by measuring their quinoxaline derivatives, which were obtained after derivatization with OPD (ortho-phenylenediamine).
LOD values were 0.03, 0.01, and 0.04 mg/kg, while LOQ values were 0.08, 0.03, and 0.12 mg/kg for 3-DG, GO, and MGO, respectively. The precision of the method, calculated as RSDr, was 0.09, 0.12, and 0.13 for 3-DG, GO, and MGO, respectively (Table 6).
Table 6: Limits of detection (LODs), limits of quantitation (LOQs), and
repeatability relative standard deviations (RSDr) for 1,2-dicarbonyl compounds. LODs (mg/kg)a (mg/kg)LOQs b RDSr (%) 3-DG 0.01 0.02 0.07 GO 0.03 0.01 0.09 MGO 0.008 0.009 0.09
a Calculated as 3σ/slope of the calibration curve. b Calculated as 10σ/slope of the calibration curve.
50 As shown in Table 7, all sample showed high 3-DG levels, ranging from 4.10 to 703.12 mg/kg. The honeys sample had the highest 3-DG levels. Bread and fruit juice and fruit based drink samples had the lowest mean 3-DG contents (approximately 28.84 and 29.87 mg/kg respectively); average value for biscuit, jam and marmalade samples was about 35.82 mg/kg and 48.33 mg/kg respectively, instead the average value for honey samples was about 320.2 mg/kg.
GO was present at low concentrations in all samples ranging from 3.36 to 23.38 mg/kg.
Honey samples had the lowest mean value for GO (4.27±0.63 mg/kg), while jam and marmalade samples had the highest average value (9.62±1.72 mg/kg).
MGO was predominant in marmalade with concentration up to 195.38 mg/kg, for the other samples the MGO levels ranging from about 1.07 to 76.98 mg/kg.
Pasta, coffee and milk samples had a content of 1,2-dicarbonyl compounds lower than the limit of detection.
51
Table 7: Distributions (mg/kg±s. d.) of 1,2-dicarbonyl compounds in
the food items.
Sample 3-DG GO MGO Biscuit 1 nd 6.61±0.44 19.16±1.77 2 57.38±8.87 13.76±0.99 12.54±2.22 3 113.83±5.15 7.12±0.25 39.64±2.74 4 nd nd nd 5 nd 4.74±0.21 76.98±7.33 6 43.72±1.62 5.01±0.91 2.26±0.04 Mean value 35.82±43.73 6.21±4.29 25.1±27.90 Bread 7 11.26±2.62 3.52±0.05 2.74±0.42 8 24.86±1.96 3.67±0.12 1.07±0.04 9 12.81±0.76 3.73±0.01 1.26±0.03 10 24.83±2.40 4.42±0.19 5.11±1.45 11 nd 4.46±0.13 1.98±0.07 12 18.53±1.72 5.10±0.07 4.54±0.62 13 4.10±2.77 6.93±1.62 4.06±0.71 14 39.02±3.27 12.24±2.33 11.50±0.81 15 26.03±0.71 15.31±1.06 9.34±0.66 16 56.95±8.76 23.38±1.63 17.82±2.04 Mean value 21.84±16.60 8.28±6.53 5.94±5.29 Pasta 17 18 nd nd nd nd nd nd 19 nd nd nd Fruit juice and fruit juice based drink 20 36.65±1.21 6.95±0.01 19.17±0.39 21 26.17±1.48 6.89±0.23 24.42±0.89 22 39.25±0.42 3.36±0.23 13.20±0.32 23 37.76±0.02 7.70±0.01 21.60±0.01 24 34.94±0.65 5.22±0.04 12.62±0.47 25 25.49±0.03 4.58±0.37 10.52±1.82 26 49.23±1.63 7.28±0.19 17.19±0.32 27 13.16±1.05 6.71±0.72 7.74±0.65 28 20.42±3.79 5.35±0.69 26.29±2.13 29 17.15±2.28 5.03±0.19 9.01±1.39
52 30 19.57±2.79 5.73±0.28 13.02±0.13 31 33.80±2.39 6.88±0.56 13.93±1.22 32 33.40±0.61 7.51±0.40 13.74±0.33 Mean value 29.77±10.26 6.09±1.32 15.57±5.72 Jam and Marmala de 33 40.69±5.14 8.80±0.40 4.97±0.19 36 47.45±2.48 10.57±0.23 9.64±1.74 37 39.01±3.12 6.70±0.90 8.82±0.32 38 86.94±2.29 10.74±0.48 8.80±0.28 39 47.01±2.00 11.52±0.39 6.91±0.21 40 28.86±5.50 9.41±1.04 195.38±13.85 Mean value 48.33±19.35 9.62±1.72 39.11±73.13 Honey 41 394.05±44.12 4.84±0.18 4.62±0.24 42 158.28±3.84 3.74±0.16 5.58±0.25 43 331.46±23.13 4.02±0.09 5.25±0.56 44 156.65±5.89 3.94±0.02 3.85±0.07 45 703.12±33.57 4.93±0.23 5.19±0.08 46 421.60±25.58 5.05±0.14 7.61±0.60 47 76.18±2.32 3.39±0.02 3.98±0.11 Mean value 320.19±203.02 4.27±0.63 5.15±1.29 Coffee 48 49 nd nd nd nd nd nd 50 nd nd nd Milk 51 52 nd nd nd nd nd nd 53 nd nd nd nd: non detectable
53
5.2 Dietary theoretical intake
Table 8 reports the medium and the high percentiles (95th,
99th) intake (mg/kg body weight/day) for GO, MGO and
3-DG for food category and age for total Italian population. Table 9 reports the medium and the high percentiles (95th,
99th) intake (mg/kg body weight/day) for GO, MGO and
3-DG for food category and age for south & islands Italian population.
The medium intake for total population was of 0.022 mg/kg body weight/day, for 95th was of 0.144 mg/kg body
weight/day and for 99th was of 0.341 mg/kg body
weight/day of GO.
About the intake by age, data show that the category who ingest more GO with the diet are the infants (0-2 years) and the children (3-9 years). The intake for 99th was of 0.615 and
0.699 mg/kg body weight/day respectively.
Teenagers category (10–17 years) assumes with diet 0.031 mg/kg body weight/day of GO.
The medium intake for adults (18–64 years) and elderly (65 years and above) was of 0.018 mg/kg body weight/day of GO.
The medium intake of MGO for total population was very low (0.032 mg/kg body weight/day), instead the intake for 99th was very high (0.929 mg/kg body weight/day).
Infants (0-2 years) category assumes the highest level of MGO for medium and both high percentiles.
The intake for this category was of 0.132 mg/kg body weight/day for medium, 1.079 mg/kg body weight/day for 95th and 1.777 mg/kg body weight/day for 99th.
54 As concerns 3-DG the medium intake for total population was of 0.156 mg/kg body weight/day and the intake for 99th
was of 2.699 mg/Kg body weight/day.
Even in the case of 3-DG the categories that assumes the highest level of 3-DG were infants (0-2 years) and children (3–9 years).
The medium intake for teenagers (10-17 years) was of 0.190 mg/kg body weight/day, for adults (18–64 years) and elderly (65 years and above) was of 0.138 mg/kg body weight/day. The medium intake for total population of south & islands was of 0.021 mg/kg body weight/day, for 95th was of 0.140
mg/kg body weight/day and for 99th was of 0.340 mg/kg
body weight/day of GO.
About the intake by age, data show that the category who ingest more GO with the diet are the children (3-9 years) and the infants (0-2 years). The intake for 99th was of 0.78
and 0.733 mg/kg body weight/day respectively. Teenagers category (10–17 years) assumes whit diet 0.032 mg/kg body weight/day of GO. The medium intake for adults (18–64 years) and elderly (65 years and above) was of 0.016 mg/kg body weight/day of GO.
The medium intake of MGO for total population of south & islands was of 0.029 mg/kg body weight/day, and the intake for 99th was of 0.859 mg/kg body weight/day.
Infants (0-2 years) category assumes the highest level of MGO for medium and both high percentiles.
The intake for this category was of 0.122 mg/kg body weight/day for medium, 0.932 mg/kg body weight/day for 95th and 1.844 mg/kg body weight/day for 99th.
55 Also the children have a high intake both for medium and high percentiles (0.097, 0.801 and 1.687 mg/kg body weight/day respectively).
The lowest intake was for adults (18–64 years) and elderly (65 years and above).
The medium intake of 3-DG for total population was of 0.138 mg/kg body weight/day and the intake for 99th was of
2.399 mg/kg body weight/day.
Even in the case of 3-DG the category that assumes the highest level of 3-DG was infants (0-2 years) specially for 99th (31.089 mg/kg body weight/day).
The medium intake for children (3–9 years) was of 0.329 mg/kg body weight/day.
The medium intake for teenagers (10-17 years) was of 0.175 mg/kg body weight/day, for adults (18–64 years) and elderly (65 years and above) was about of 0.110 mg/kg body weight/day.
56 Table 8: Intake of GO, MGO and 3-DG (medium, high percentiles 95th, 99th) for food category and age of total Italian population.
Sample/dicarbonyl
compound GOa MGOa 3-DGa
Total population
Medium 95th 99th Medium 95th 99th Medium 95th 99th
Biscuits 0.002 0.017 0.047 0.007 0.091 0.270 0.009 0.139 0.414
Bread 0.014 0.085 0.167 0.010 0.066 0.131 0.036 0.220 0.431
Fruit and vegetable juices 0.005 0.034 0.110 0.012 0.106 0.359 0.023 0.197 0.665
Jam 0.000 0.004 0.009 0.002 0.057 0.158 0.002 0.027 0.065
Honey 0.001 0.004 0.008 0.001 0.006 0.011 0.086 0.530 1.124
∑ Intake 0.022 0.144 0.341 0.032 0.326 0.929 0.156 1.113 2.699
Infants (0-2 years)
Medium 95th 99th Medium 95th 99th Medium 95th 99th
Biscuits 0.008 0.054 0.077 0.034 0.295 0.436 0.048 0.449 0.670
Bread 0.012 0.150 0.220 0.009 0.116 0.172 0.032 0.387 0.564
Fruit and vegetable juices 0.033 0.193 0.287 0.085 0.597 0.935 0.162 1.112 1.729
Jam 0.000 0.004 0.012 0.001 0.054 0.207 0.001 0.025 0.085
Honey 0.002 0.013 0.019 0.003 0.017 0.027 0.160 1.656 2.834
∑ Intake 0.055 0.414 0.615 0.132 1.079 1.777 0.403 3.629 5.882
Children (3–9 years)
Medium 95th 99th Medium 95th 99th Medium 95th 99th
Biscuits 0.005 0.449 0.086 0.020 0.235 0.490 0.029 0.359 0.751
Bread 0.024 0.387 0.367 0.018 0.126 0.287 0.064 0.420 0.944
Fruit and vegetable juices 0.021 0.107 0.214 0.054 0.332 0.698 0.103 0.618 1.291
Jam 0.001 0.007 0.013 0.003 0.102 0.227 0.004 0.048 0.094
Honey 0.002 0.008 0.019 0.002 0.011 0.027 0.134 1.060 2.788
57 Teenagers (10–17 years)
Medium 95th 99th Medium 95th 99th Medium 95th 99th
Biscuits 0.003 0.023 0.060 0.012 0.125 0.344 0.016 0.190 0.528
Bread 0.016 0.102 0.184 0.012 0.079 0.144 0.043 0.264 0.473
Fruit and vegetable juices 0.011 0.071 0.123 0.027 0.221 0.401 0.052 0.411 0.741
Jam 0.000 0.003 0.006 0.002 0.048 0.111 0.002 0.023 0.046
Honey 0.001 0.004 0.007 0.001 0.006 0.010 0.077 0.530 1.069
∑ Intake 0.031 0.203 0.380 0.054 0.479 1.010 0.190 1.418 2.857
Adults (18–64 years)
Medium 95th 99th Medium 95th 99th Medium 95th 99th
Biscuits 0.001 0.012 0.027 0.005 0.063 0.157 0.007 0.096 0.240
Bread 0.013 0.076 0.134 0.009 0.059 0.105 0.033 0.196 0.344
Fruit and vegetable juices 0.003 0.022 0.048 0.007 0.069 0.155 0.013 0.129 0.288
Jam 0.000 0.004 0.008 0.002 0.056 0.147 0.002 0.026 0.061
Honey 0.001 0.004 0.007 0.001 0.005 0.009 0.083 0.501 0.994
∑ Intake 0.018 0.118 0.224 0.024 0.252 0.573 0.138 0.948 1.927
Elderly (65 years and above)
Medium 95th 99th Medium 95th 99th Medium 95th 99th
Biscuits 0.001 0.011 0.022 0.005 0.059 0.127 0.006 0.090 0.195
Bread 0.014 0.082 0.144 0.010 0.063 0.113 0.037 0.211 0.370
Fruit and vegetable juices 0.002 0.020 00.044 0.005 0.062 0.144 0.010 0.116 0.266
Jam 0.000 0.004 0.009 0.002 0.061 0.153 0.002 0.029 0.063
Honey 0.001 0.004 0.006 0.001 0.005 0.009 0.083 0.501 0.911
∑ Intake 0.018 0.121 0.225 0.023 0.250 0.546 0.138 0.947 1.805
58 Table 9: Intake of GO, MGO and 3-DG (medium, high percentiles 95th, 99th) for food category and age for south & islands.
Sample/dicarbonyl
compound GOa MGOa 3-DGa
Total population
Medium 95th 99th Medium 95th 99th Medium 95th 99th
Biscuits 0.001 0.012 0.034 0.005 0.066 0.195 0.007 0.100 0.299
Bread 0.014 0.085 0.173 0.010 0.066 0.135 0.036 0.220 0.445
Fruit and vegetable juices 0.005 0.036 0.119 0.012 0.113 0.388 0.023 0.210 0.718
Jam 0.000 0.003 0.008 0.001 0.037 0.132 0.001 0.017; 0.054
Honey 0.001 0.003 0.006 0.001 0.005 0.008 0.070 0.443 0.883
∑ Intake 0.021 0.140 0.340 0.029 0.286 0.859 0.138 0.991 2.399
Infants (0-2 years)
Medium 95th 99th Medium 95th 99th Medium 95th 99th
Biscuits 0.006 0.036; 0.049 0.025 0.199 0.279 0.035 0.303 0.428
Bread 0.010 0.120 0.196 0.007 0.093 0.153 0.026 0.309 0.504
Fruit and vegetable juices 0.034 0.182 0.287 0.086 0.563 0.935 0.165 1.047 1.729
Jam 0.001 0.005 0.012 0.002 0.069 0.207 0.003 0.032 0.085
Honey 0.002 0.006 0.189 0.002 0.008 0.270 0.141 0.726 28.343
∑ Intake 0.053 0.349 0.733 0.122 0.932 1.844 0.370 2.417 31.089
Children (3–9 years)
Medium 95th 99th Medium 95th 99th Medium 95th 99th
Biscuits 0.003 0.030 0.068 0.014 0.162 0.385 0.019 0.247 0.591
Bread 0.027 0.196 0.459 0.019 0.151 0.359 0.071 0.505 1.180
Fruit and vegetable juices 0.023 0.129 0.223 0.060 0.400 0.727 0.114 0.745 1.345
Jam 0.001 0.006 0.011 0.002 0.082 0.189 0.003 0.038 0.078
Honey 0.002 0.004 0.019 0.002 0.006 0.027 0.122 0.581 2.788