DIPARTIMENTO DI SCIENZE CHIMICHE
International Doctorate in Chemical Sciences
XXIX cycle
Alessio Paternò
Multivariate design of sustainable
and efficient ionic liquids
Ph.D Thesis
Tutor Prof. G. Musumarra
Coordinator Prof. S. Sortino
Index
2
1. Introduction
3
1.1
ILs descriptors
4
1.2
ILs properties and toxicities
5
1.3
Purposes of this Ph.D thesis
8
2. Methods
8
2.1
Computational methods
12
2.2
Experimental
12
2.2.1 Materials, synthesis and characterization of ILs
14
2.2.2 E
NRmeasurements
14
2.2.3 Heat capacity measurements
15
3. Results and Discussion
15
3.1
ILs in silico descriptors
15
3.1.1 ILs VolSurf+ descriptors
15
3.1.2 ILs Principal properties
16
I.
Principal properties for cations (PP+)
21
II.
Principal properties for anions (PP-)
24
3.2
A glance at ILs structures influence on their toxicity
24
3.2.1 Overall toxicity model
26
3.2.2 Aquatic ecotoxicity
28
3.2.3 Toxicity towards fungi and bacteria
28
3.2.4 Imidazolium cations toxicity model
35
3.2.5 Relationships between diferent toxicities
37
3.3
QSPR models analyzing ILs structures influence on their toxicity
37
3.3.1 Aquatic toxicity PLS model
41
3.3.2 IPC-81 cytotoxicity PLS model
46
3.3.3 AChE inhibition PLS model
50
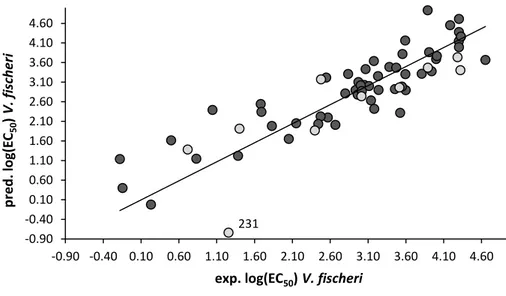
3.3.4 Vibrio fischeri PLS model
57
3.4
QSPR model analyzing ILs structures influence on their physico-chemical
properties
57
3.4.1 E
NRPLS model
64
3.4.2 C
pPLS model
70
3.4.3 Other ILs physico-chemical properties PLS models
71
I.
Viscosity
76
II.
Density
78
III.
Decomposition temperature
80
IV.
Conductivity
82
V.
Glass transition temperature and Melting point
83
4. Conclusions
85
5. References
90
6. Appendix
90
6.1
A-Figures
104
6.2
A-Tables: models statistical parameters
109
6.3
B-Tables: objects, descriptors, properties and predictions
1.
Introduction
Inductive and deductive approaches are different ways to explore the world around us, and
philosophers, or people in general, differently adopt them to explain the principles of their thoughts
and opinions. In scientific research both deductive and inductive approaches may be used. Deductive
reasoning is a “top-down” approach aimed at testing a hypothesis initially postulated, and then trying
to find experimental evidences to support or disprove it. On the contrary, inductive reasoning is a
“bottom-up” approach, based on learning from observations; explanatory hypotheses are eventually
formulated at the end of the process.
The computer age had an enormous impact on chemical research. Nowadays hundreds molecular
modeling softwares adopting different investigational approaches are available in different areas of
chemistry. Among them, (as reported in Fig. 1, going from the left to the right) quantum chemistry,
which considers mainly problems related to quantum phenomena; theoretical chemistry, traditionally
associated to the formulation of new theories and/or approximations; computational chemistry, a
branch of theoretical chemistry, whose objective is to build a mathematical model to calculate
molecular properties (energy, dipole moments, vibrational frequencies etc.); cheminformatics, which
uses computational and chemometric tools to investigate different chemical and biological issues. The
term chemometrics was proposed in 1974 by Bruce Kovalski (Seattle, USA) and Svante Wold (Umea,
Sweden) and since then several successful chemometric applications have been reported in
pharmaceutical, food and analytical chemistry. Although chemometric competence is sought in industry
and applied in R&D, chemometrics, probably due to its highly empirical character, which implies
adoption of data-driven “soft” models, is still not very popular among organic chemists.
Fig. 1
Hard and soft modelling fields of application.
In a recent paper Martens
1points out the gap between the mathematics-statistics culture, focusing on
formal accuracy, and other sciences cultures producing lots of good raw data, which often treat them
using limited and uninformed mathematics and statistics. He states that “chemometrics has a lot to
learn from other disciplines, mathematics and statistics [...] but on the other hand chemometrics has a
He also points out that in the past forty years science witnessed a big data explosion paralleled by an
increasing computer capacity in respect to storage space, memory and CPU, but unfortunately unless
we can also interpret these data we are overwhelmed by them. In this context Martens states that
chemometrics, in contrast with “black box” approaches, developed a pragmatic science culture
attempting to approach the real world letting the data talk to us but at the same time trying to interpret
the results in light of prior chemical knowledge and the laws of physics.
The reason for chemometrics being not applied in organic chemistry might be due to the fact that in the
past two decades many Universities have not focused on education in physical organic chemistry which
led organic chemists to delegate these studies to theoreticians (whose aim is to provide a unique model
of high complexity able to fit all the data) and to statisticians (whose cultural background emphasizes
the importance of high correlation and predictivity, expressed as R
2and Q
2values respectively, which in
cases such as biological and physical measurements on ionic liquids are difficult to achieve) both
believed to be more suited to the job. In the field of ionic liquids, low melting point salts, formed of an
organic cation and an inorganic or organic anion, covering a huge experimental space difficult to be
explored, multivariate approaches leading to soft models of local validity might be useful for their
applicative potentialities.
Ionic liquids (ILs) exhibited an unprecedented efficiency at a molecular level and showed promising
characteristics for the development of green and sustainable technologies. It is important to stress that
the characteristics of both cations and anions determine the physico-chemical properties and the
process performances of the resulting IL as well as its toxicity. Predicting the efficiency and sustainability
of ILs could be presently considered a major issue for the scientific community.
1.1
ILs Descriptors
In theory a suitable IL could be designed for a specific use relating its structural properties to a given
application by a quantitative structure-property relationship (QSPR) approach, but in practice
experimentally determined physico-chemical properties in the case of ILs are very few, measured under
different conditions and scattered in the literature. Since it is hardly possible to experimentally explore
such a huge chemical space, available data often cover only a fraction of it. Moreover, synthetic and
experimental screening efforts are in general expensive and time-consuming even for relatively small
subspaces of ILs structures, and their purity can dramatically affect the experimental determination of
their properties.
2Hence there is a need of in silico descriptors for as many ILs as possible, in order to
derive QSPR models allowing properties prediction for yet unknown ILs before planning their synthesis
and/or carrying out efficiency tests.
or stereo-isomeric ratios, etc.) by simultaneous variation of experimental conditions, which may be
continuous (temperature, time, concentrations, etc.) or discrete (solvent, catalyst, etc.) variables. The
latter variables need parameterization by means of intrinsic properties suitable for experimental design,
i.e. orthogonal to each other. The above requirement led to the derivation of principal properties (PPs),
which are intrinsic properties representative of experimentally observable macroscopic descriptors. PPs
are calculated as the principal component analysis (PCA) scores using experimentally measured
properties, and are already available for solvents,
3,4aldehydes and ketones,
5amines,
6Lewis acids,
7lanthanide triflates,
8aromatic substituents
9and amino acids.
10-13First and second-generation PPs for
heteroaromatic moieties, based on aromaticity
14and on 3D-GRID structural parameters
15respectively,
were reported. In addition to statistical orthogonality, PPs derived by PCA models have the advantage
of being less influenced by measurement errors and system-specific variations than single descriptors.
A typical example of the potentialities of PPs used for optimization purposes was provided by the results
of a multivariate experimental design based on the PPs of Lewis acid catalysts and solvents. This
approach gave a better understanding of the effects of the above parameters on the isomeric
distribution in the reaction of phenylhydrazones derived from unsymmetrical ketones (the Fischer
indole synthesis). Multivariate optimization achieved not only regiospecific synthesis of single indole
regio-isomers,
16but almost quantitative yields in a single step reaction.
17It is worth noting that the
above result was achieved for a reaction, the Fischer indole synthesis,
18,19known for more than a
century. Furthermore PPs resulted to be suitable for design in quantitative structure-activity
relationships (QSARs),
9especially for the design of biologically active peptides.
10,11Dedicated PPs for
amino acids were then derived for peptides QSARs,
12for quantitative sequence-activity modelling
20and
more recently, using MIF (Molecular Interaction Fields) descriptors, for GRID-based description of
molecular similarity and ligand-based virtual screening.
13,21PPs are particularly suited to describe
compounds that are the sum of finite building blocks such as ionic liquids (anions and cations as anionic
and cationic building blocks).
In spite of the potentialities exhibited in multivariate design of synthetic procedures and in the discovery
of novel biologically active compounds, the use of PPs has received little attention in the past decade.
1.2
ILs properties and toxicities
Ionic liquids represent an innovation in the industrial scenario due to their very interesting
physico-chemical properties relevant either in academic or industrial fields. They attracted much attention as
green solvents as compared to common volatile organic solvents due to their low vapour pressure,
resulting in lower air emission, low flammability and non-explosiveness, even though these features are
not sufficient to justify their “greenness”. The interest in ILs is highlighted by an exponential increase in
publications, which demonstrates that this field has developed beyond the concept of new solvents. A
wide variety of ILs applications are examined by recent papers and reviews on their use as reaction
media,
22-25lubricants,
26surfactants,
27anticorrosion agents,
28,29in separation
30-33and more in general in
analytical chemistry,
34in the cyclization of allenes,
35on their role in catalysis
36as well as in major societal
issues such as energy, materials and medicine.
37The widespread use of ILs makes the study of their impact on human’s health and environment an
unavoidable priority.
38In fact, release of ILs from industrial processes into aquatic environments may
lead to water pollution due to their high solubility and their high stability in water which might render
them persistent pollutants in wastewaters. For this reason it is necessary to determine the
environmental risk in aquatic ecosystems first of all, to comply with the terms of the European Union
regulation for the Registration, Evaluation, Authorization and Restriction of Chemicals (REACH) requiring
a comprehensive knowledge of the properties and hazards of ILs.
39Such an ambitious task is particularly
hard to achieve due to the difficulties in developing procedures for collecting and assessing this kind of
information. Predicting the efficiency and sustainability of ILs is presently a major issue for the scientific
community.
However, the assessment of eco-toxicity of ILs is quite complicated due to the fact that different
biological “sensors” could be considered as representative of their hazard and often these data are
available for a numerically limited numbers of ILs.
40The term “toxicity” refers to a general concept
including different biological tests such as cytotoxicity, toxicity towards invertebrates, vertebrates, fungi
and bacteria, phytotoxicity, impact on enzymatic activity and protein stability. ILs experimental toxicity
data for many ionic liquids in different biological test systems were reported in the UFT-Merck Ionic
Liquids Biological Effects Database.
41Unlikely, this database is no longer operative and, even when it
was accessible, single toxicity tests were not available for many ILs. In conclusion, there is a need to
accelerate the discovery of biocompatible ILs by identifying safe, non-toxic, environmental friendly ionic
liquids by thorough ecotoxicological testing,
42but this goal is not easy to achieve since, quoting Sir
Richard Livingstone, ‘danger is not too few, but too many options [...] to be puzzled by innumerable
alternatives’. In this context, adoption of multivariate approaches can help to simplify the overall toxicity
picture.
1.3
Purposes of this Ph.D thesis
Ionic liquids appeared in the scientific literature in 1914 thanks to the work of Paul Walden
43who
noticed their chemo-physical properties and envisaged their possible catalytic effects. Nevertheless, the
scientific community has really appreciated their values since 2000, with an exponential increase of
ways, little explored topic for my Ph.D thesis. My interest for ILs arises from their usefulness, and it is
due not only to academic purposes but also to the social impact that the potential results of my study
could have for the development of sustainable industrial applications.
Given the huge number of cation/anion combinations, a large variety of solvent systems having different
properties can be obtained. This may simultaneously represent an advantage and a detriment. Although
a wide range of solvents would be in principle available for the same process, the lack of knowledge of
solvent properties and the efforts required to perform experimental investigations makes the selection
of a suitable solvent for a given process or reaction a hard task. Moreover, the increasing number of
industrial applications boosts the knowledge of their potential toxicological and environmental
properties, as required by the EU regulation (REACH). In this context priorities have to be established by
selecting reliable and representative toxicity tests on a limited number of informative ILs. Hence the
need to predict solvents properties by quantitative structure-property relationship (QSPR) models
based on in silico structural descriptors.
Such in silico descriptors can be calculated adopting a cheminformatic tool called VolSurf+.
44,45It allows
to explore the physicochemical space of a molecule from the 3D maps of interaction energy between
the molecule and chemical probes (GRID-based Molecular Interaction Fields, or MIFs
46-49) deriving the
resulting physicochemical and ADME molecular descriptors (128 descriptors). The VolSurf+ procedure
has been already successfully applied to study structure–permeation relationships,
44to predict
antitumour activities,
50-55and more recently for modelling phospholipidosis induction,
56,57representing
a fundamental tool for the purposes of this thesis.
This approach would allow to gain a better knowledge on the relationships between in silico structural
physico-chemical properties and toxicity on different biological targets. However, as a huge number of
descriptors cannot be easily handled, we intended to revive interest on principal properties (originally
intrinsic properties representative of experimentally observable macroscopic descriptors) by
compacting the VolSurf+ parameters into few properties for heterocyclic cations and inorganic or
organic anions. These new structural descriptors could be adopted for the selection or the design of ILs
for specific green processes or products as well as for the assessment of the toxicity for more than 8000
ILs. The choice between adoption of the entire set of VolSurf+ descriptors, with a higher degree of
information, or compacted ILs PPs, with a lower information content but easier to handle, will be
data-driven following the ancient motto “Frustra fit per plura quod fieri potest per pauciora” (It is vain to do
with many what can be done with few).
Having this in mind, the aim of my research has been to achieve a better and deeper knowledge about
the environmental and scientific impact of ILs, in particular exploiting the potentialities of multivariate
statistics. These approaches are the best tools to analyze many variables and conditions simultaneously,
with the purpose either to extract the most relevant information describing a dataset structure or to
optimize a process, trying in both cases to recognize an eventual “systematic” pattern in the data.
Several cheminformatic tools have been developed to achieve this goal, and herein presented and used
two ones (PCA and PLS) considered to be the most appropriate for the purposes of this thesis, suitable
to deal with many data and variables, resulting basically simple to use and to interpret, little
time-consuming and, last but not least, not expensive at all.
2.
Methods
2.1
Computational methods
VolSurf+ is a powerful cheminformatic tool aimed at producing and exploring the physico-chemical
property space of a library of molecules starting from 3D maps of interaction energies between the
molecule and chemical probes.
The interaction of molecules with biological membranes is mediated by surface properties such as
shape, electrostatic forces, H-bonds and hydrophobicity. Therefore, the GRID
46force field can be chosen
to characterize potential polar and hydrophobic interaction sites around target molecules by the water
(OH2), the hydrophobic (DRY), the carbonyl oxygen (O) and amide nitrogen (N1) probes. The
information contained in the resulting MIFs (molecular interaction fields) is translated into a
quantitative scale by calculating the volume or the surface of the interaction contours. In fact, in
VolSurf+ 3D structures generation is automatically performed generating a bunch of minimized 3D
structures of molecules in water and apolar solvents from which the best energy minima conformers
are selected. All the remaining structures are used to derive conformational dependent descriptors,
such as flexibility parameters, LogP, partition coefficient in non-water solvent, amphiphilic moments.
The VolSurf+ procedure can be summarized as in Fig. 2. In the first step, a three-dimensional map (3D
map), is generated from the interactions of the OH2, DRY, O and N1 probes with a target molecule. In
this 3D map each pixel contains information about a chemical property. The amount of information
contained in a 3D map is related to the interacting molecular partners. The second step consists in the
calculation of descriptors from the 3D maps obtained in the first step.
Fig. 2
Scheme showing the sequence of steps in VolSurf+.
The molecular descriptors calculated by means of VolSurf+ refer to molecular size and shape, to
hydrophilic and hydrophobic regions and to the balance between them, to molecular diffusion, to
partition coefficient in different solvents, to pH-dependent water solubility and molecular flexibility in
some descriptors on some relevant ADME properties. The definition of all 128 VolSurf+ descriptors is
given in case studies
44,53-60with the previous versions of VolSurf+ and reported in detail in Table C1 (in
the Appendix section).
The SIMCA (Soft Independent Modelling of Class Analogy ) package
61was then used to derive PCA
models as in section 3.2 and PLS models correlating cations and anions VolSurf+ descriptors or PPs to
ILs physico-chemical properties or toxicities as below reported.
PCA (Principal Component Analysis)
62is an extremely useful technique to compact the most relevant
information present in a data matrix (containing objects and related variables) into a simplified and
more understandable form. Data are pre-processed by autoscaling all variables to unitary variance, i.e.
by multiplying the variables by appropriate weights (usually the reciprocal of the variable standard
deviation) to give them unit variance (i.e. the same importance) after subtracting the mean value.
PCA
works by decomposing the matrix as the product of two smaller matrices (as eq. 1 expresses in a
simplified version), the loading and score matrices. The loading matrix (P) contains information about
the variables: it is composed of few vectors (Principal Components, PCs) which are linear combinations
of the original variables. The score matrix (T) contains information about the objects: each object is
described in terms of its projections onto the PCs, representing the scores, instead of the original
variables. The information not contained in these matrices remains as "unexplained X-variance" in a
residual matrix (E).
X = TP + E
(eq. 1)
The PCs, among many others, have two interesting properties: they are extracted in decreasing order
of importance: the first PC always containing more information than the second, the second more than
the third and so on. Moreover they are orthogonal to each other: there is no correlation between the
information contained in different PCs.
In PCA, each new extracted PC increases the amount of information (the variance, expressed by the R
2parameter indicating the goodness of fit) explained by the model. However, usually the first four of five
PCs explain more than 90% of the variance. There is no simple or unique criterion to decide how many
PCs should be considered as significant. From a theoretical point of view, it is possible to use
cross-validation techniques to decide the number of significant PCs evaluating the predictability of variation
(Q
2) of each component and all together (see below).
The Partial Least Squares Projections to Latent Variables (PLS)
63analysis is a regression technique whose
goal is to explain one or more dependent variables (Y's) in terms of a number of explanatory variables
(X's, contained in the X-matrix) according to equation 2.
Y = f(X) + E
(eq. 2)
It is possible to build many different models that fulfill the above equation. Different methods produce
models that "fit" the Y's more or less accurately. Among them, the best one will be able to calculate Y
(or learning) set. Consequently, this model becomes "predictive" and can be used to calculate reliable
estimations of Y values for new molecules, prior to their availability. It is important to note that the Y
variables, like any other experimental variable, contain an error. The models will try to fit the Y as much
as possible (increasing R
2parameter) but trying to improve too much the fitting, the model will include
also some noise. This phenomenon, called overfitting, is very dangerous because overfitted models
appear to be statistically very significant (having high R
2) but often prove to be useless in prediction for
Y's of objects not included in the learning set (low or negative Q
2). An interesting example on overfitting
is given in section 3.4.3-III. Even if the 3D-QSPR models are approximate and are not able to explain the
activity values to a full extent, they are extremely valuable to identify the X-variables that contribute
most to the activity.
In 3D-QSPR often the X-matrix contains much fewer objects (molecules) than variables. In these
situations, the classical regression technique, Multiple Linear Regression (MLR) is not a suitable
statistical approach. There are many reasons, but, among others: i) MLR was developed to deal with
situations in which the number of objects is three times at least larger than the number of variables.
This inconvenience can be overcome by using stepwise MLR, but then there is a high probability of
obtaining relationships just by chance. ii) MLR assumes that the X-variables are "independent" and not
correlated to each other. It is known that variables do not often fulfill these requirements, especially in
real biological or chemical fields. In fact, the only regression method than can deal with the kind of
X-matrices used in 3D-QSPR is PLS. It works on pre-treated data, decomposing the X-matrix as the product
of two smaller matrices, much like PCA does. The weight (concept similar to the PCA loadings, and often
so called) matrix contains information about the variables. It contains few vectors (Latent Variables, LVs)
which are linear combinations of the original X-variables. The concept of LV is quite equivalent to the
PC in PCA. The score matrix (T) contains information about the objects. Each object is described in terms
of the LVs, as in PCA. The main difference is that PCA obtains the PCs that represent at best the structure
of the X-matrix and PLS obtains the LVs under the following constraints: they have to represent the
structure of the X-matrix and Y-matrix and maximizing the correlation between the X's and the Y's.
The LVs share some important properties with the PCs: they are extracted in decreasing order of
importance and each LV is orthogonal to each other. For the purposes of the present work, no
distinction will be made between PCs and LVs, and they will be indistinctly named as principal
components (PCs) hereinafter.
In PLS selecting the correct dimensionality is of critical importance. When too many PCs are included a
serious overfitting danger will result and the model will have little or no validity (high R
2but low or
negative Q
2). To check how many PCs to include it is strictly necessary to test the predictive ability of
of the main reliable CV process works building reduced models (models for which some of the objects
were removed) and using them to predict the Y-variables of the held-out objects. Then the predicted Y
is compared with the experimental Y, and for each model the following dimensionality indexes are
computed:
-SDEP or Standard Deviation of Errors of Prediction:
SDEP = √∑
(𝑌−𝑌𝑁′)2-Q
2as Predictive correlation coefficient (referring to the model predictability as the fraction of the total
variation of the Y’s predicted by each or all PLS components):
Q
2= 1 -
∑(Y−Y′)2∑(Y−Ý)2
(Y : Experimental value; Y' : Predicted value; Ý: Average value ; N: Number of objects).
The CV technique is very valuable because it performs an "internal validation" of the model and obtains
an estimation of the predictive ability without the help of external datasets. This is particularly important
in QSAR studies, where the number of objects available is usually small, and it is not affordable to
remove objects from the learning dataset. One of the main inconveniences of CV is that there is not a
general agreement on how to build the reduced groups and on the criterion to decide how many objects
to keep. SIMCA, by default, divides dataset into n (often 7) groups, each one containing an equal (or
nearly equal) number of objects. Then models are built keeping one of these groups out of the analysis
until all of the objects are kept out once. The procedure should be repeated many times, in order to
obtain stable results. For this procedure the Standard Deviation of SDEP gives an estimate of the
dispersion of the SDEP values obtained from different runs.
Another or complementary way to evaluate the predictive ability of the model is to use an external
prediction set. In this approach the objects in the original dataset are split up into two groups from the
very beginning of the analysis. The first one, the learning set, will be used to build the PLS model. The
other, the prediction (or validation) set, will be used to compare their experimental Y-values with the
predictions made by the PLS model. There is no doubt that this technique is more realistic to test the
predictive ability. However it can be argued that the results depend critically upon how many and which
objects are assigned to each group. Also, datasets in QSAR often contain too few objects and it is not
possible to remove objects from the analysis without a loss of information.
The OPLS (Orthogonal PLS),
64-66a modification of the PLS method,
67separates the systematic X-variation
in two parts, one that is linearly related to Y and one that is unrelated (orthogonal) to Y. This partitioning
of the X-data facilitates model interpretation and improves model predictivity.
64-66The OPLS model
comprises two modelled variations, the Y-predictive (TPPp T) and the Y-orthogonal (TOPO T)
components. Only the Y-predictive variation is used for the modelling of Y (TPCP T).
(E and F are the residual matrices of X and Y, respectively).
The statistical results obtained by the PLS or OPLS method are able to detect what variables in the
X-block are relevant to determine the dependent variables (Y-X-block) by means of the VIP (Variables
Importance for the Projection) values. The VIP values reflect, in fact, the importance of terms in the
model both with respect to Y, i.e. its correlation to all the responses, and with respect to X, i. e. in
explaining X-variation. The VIP values are calculated for each X-variable by summing the squares of the
PLS loading weights multiplied by the amount of sum of squares explained in each model component.
61In PLS, Q
2assesses the predictive power of the model and a permutation plot is a further cheminformatic
tool (available in SIMCA
61) useful to check the significance of a PLS model and the reliability of its
Y-predictions. In fact, the purpose of this validation tool is to compare the goodness of the original model
fit (R
2and Q
2) with the goodness of fit of several models based on data where the order of the
Y-observations has been randomly permuted, while the X-matrix has been kept intact. The permutation
plot shows R
2and Q
2values on the vertical axis: far to the right the parental PLS model parameters,
while the Y-permuted models ones are on the left. The horizontal axis shows the correlation between
the permuted Y-vectors and the original Y-vectors. The original parameters have correlation 1 with
themselves. In order to have a valid plot
61-all Q
2-values on the left should be lower than the original points to the right.
or
-the regression line of the Q
2-points should intersect the vertical axis (on the left) at or below zero.
The R
2-values provide often an optimistic estimate, but when the R
2-values on the left are lower than
the original point to the right, this supports the validity of the original model.
For the models presented herein, 50 permutated models were derived for each PLS correlation model.
2.2
Experimental
2.2.1
Materials, synthesis and characterization of ILs
Commercially available compounds were used directly without any preliminary treatment.
methylimidazolium tetrafluoroborate (IM14 BF4) was purchased from Sigma-Aldrich.
1-Butyl-3-methylimidazolium tricyanomethanide (IM14 C(CN)3), 1-butyl-3-1-Butyl-3-methylimidazolium dimethylphosphate
(IM14 (1O)2PO2), methylpyridinium tricyanomethanide (Py4-4Me C(CN)3),
1-butyl-4-methylpyridinium chloride (Py4-4Me Cl) and 1-hexyl-3-methylimidazolium chloride (IM16 Cl) were
purchased from Io.Li.Tec. Solvents, HBF
4solution (50/50, w/w) and Amberlite IRA-400 resin were used
as purchased without further purification.
The general procedure for the synthesis of 1-butyl-3-methylimidazolium acetate and trifluoroacetate
(IM14 1COO, IM14 CF3COO) and 1-hexyl-3-methylimidazolium salts (tetrafluoroborate, acetate and
trifluoroacetate, or IM16 BF4, IM16 1COO, IM16 CF3COO respectively) from the corresponding halides
is reported below. All ionic liquids were dried on a vacuum line at 60 °C for at least 2 h before use, then
stored in a dryer under argon and over calcium chloride. In all cases, the silver nitrate test, performed
to verify the presence of residual halide anion, gave a negative result.
The Amberlite resin IRA-400 (16 g) was converted from chloride form to hydroxide form by eluting an
aqueous solution of NaOH (10 mL, 10% w/v) within a column. Subsequently the resin was washed with
water until the eluate was neutral. The halide salt(s) (10 mmol), dissolved in methanol/water (70/30,
v/v), was eluted, and the eluate collected into a flask containing a solution of the corresponding acid in
stoichiometric amount, until neutralization. The resulting solution was concentrated in vacuo, then
treated with activated charcoal in ethanol. Filtration and removal of the solvent afforded the ionic
liquids as viscous oils in high to quantitative yields. The products structures were confirmed by NMR
spectra and are in agreement with literature data.
68-721-Hexyl-3-methylimidazolium tetrafluoroborate (IM16 BF4). Pale yellow oil. Yield: 100%.
1H NMR (300
MHz, CDCl
3): δ=8.70 (s, 1 H), 7.21 (d, J=14 Hz, 2 H), 4.17 (t, J=6 Hz, 2 H), 3.94 (s, 3 H), 1.87 (m, 2 H), 1.31
(m, 6 H), 0.87 (t, J=6 Hz, 3 H) ppm.
13C NMR (300 MHz, CDCl
3
): δ= 135.8, 123.4, 121.9, 50.0, 36.2, 31.1,
29.0, 25.9, 22.3, 13.8 ppm.
1-Hexyl-3-methylimidazolium acetate (IM16 1COO). Pale yellow oil. Yield: 99%.
1H NMR (300 MHz, d
6-DMSO): δ=9.44 (s, 1 H), 7.74 (d, J=24 Hz, 2 H), 4.15 (t, J=7 Hz, 2 H), 3.85 (s, 3 H), 1.77 (quint, J=6.8 Hz 2
H), 1.56 (s, 3 H), 1.26 (m, 6 H), 0.85 (t, J=7 Hz, 3 H) ppm.
13C NMR (300 MHz, d
6
-DMSO) δ= 173.8, 137.9,
124.1, 122.0, 49.0, 36.0, 31.1, 30.2, 29.8, 25.9, 24.6, 22.4 ppm.
1-Hexyl-3-methylimidazolium trifluoroacetate (IM16 CF3COO). Pale yellow oil. Yield: 96%.
1H NMR (300
MHz, d
6-DMSO): δ=9.15 (s, 1 H), 7.74 (d, J=26 Hz, 2 H), 4.13 (t, J=8 Hz, 2 H), 3.82 (s, 3 H), 1.73 (quint, J=8
Hz, 2 H), 1.25 (m, 6 H), 0.85 (t, J=7 Hz, 3 H) ppm.
13C NMR (300 MHz, d
6
-DMSO): δ= 158.0, 137.2, 124.1,
122.1, 49.24, 36.1, 30.9, 30.2, 29.9, 25.6, 22.3, 14.2 ppm.
1-Butyl-3-methylimidazolium trifluoroacetate (IM14 CF3COO). Pale yellow oil. Yield: 94%.
1H NMR (300
MHz, d
6-DMSO): δ=9.34 (s, 1 H), 7.91 (d, J=24 Hz, 2 H), 4.33 (t, J=8 Hz, 2 H), 4.01 (s, 3H), 1.93 (quint,
J=7.6 Hz, 2 H), 1.40 (quint, J=7.6 Hz, 2 H), 1.07 (t, J=7.6 Hz, 3 H) ppm.
13C NMR (300 MHz, d
6
-DMSO): δ=
158.0, 139.4, 125.3, 122.1, 50.4, 37.1, 30.9, 30.2, 22.4, 17.6 ppm.
1-Butyl-3-methylimidazolium acetate. (IM14 1COO). Pale yellow oil. Yield: 99%.
1H NMR (300 MHz, d
6-DMSO): δ=9.73 (s, 1 H), 7.88 (d, J=21 Hz, 2 H), 4.24 (t, J= 7.6 Hz, 2 H), 3.92 (s, 3 H), 1.82 (quint, J=7.5 Hz,
2 H), 1.64 (s, 3 H), 1.29 (quint, J=7 Hz, 2 H), 0.95 (t, J=7 Hz, 3 H) ppm.
13C NMR (300 MHz, d
6
-DMSO) δ=
172.9, 137.4, 123.7, 122.4, 59.2, 48.5, 35.7, 25.9, 18.9, 13.4 ppm.
1-butyl-4-methylpyridinium tetrafluoroborate (Py4-4Me BF4) requested a different synthetic procedure.
24h. The suspension was filtered and washed with anhydrous dichloromethane to remove the
precipitated sodium chloride salt, then the organic phase was filtered on alumina and charcoal (to
remove residual impurities) and washed with small volumes of water. The absence of residual halides
was verified by silver nitrate test. The solvent was removed in vacuo and no further treatments were
needed. The organic salt was recovered as a pale yellow oil with 80.8 % of yield, and the structure
confirmed by the NMR spectra in agreement with literature data.
681
H NMR (500 MHz, DMSO): δ=8.87 (d, J=6.5 Hz, 2 H), 7.95 (d, J=6.5 Hz, 2 H), 4.50 (t, J=7.5 Hz, 3 H),
2.59 (s, 3 H), 1.86 (m, J=7.5 Hz, 2 H), 1.26(m, J=7.5 Hz, 2 H), 0.90 (t, J=7.5 Hz, 3 H) ppm.
13C NMR (500
MHz, DMSO): δ=159.3, 144.1, 128.8, 60.2, 32.9, 21.8, 19.2, 13.7 ppm.
2.2.2
E
NRmeasurements
The determination of the polarity parameter E
NR73was carried out by mixing into a quartz cuvette
(optical path 0.2 cm), 500 µL of IL and 75 µL of a concentrated solution of the solvatochromic probe
(Nile Red, NR) in 1,4-dioxane. The concentration of the probe was equal to 2.0 10
-4M. The obtained
solution was thermostated at 298 K.
2.2.3
Heat capacity measurements
The heat capacities (C
p) were measured by means of DSC analysis carrying out experiments on a Linseis
STA PT 1600 instrument at atmospheric pressure over the temperature ranging from 303 to 353 K.
Samples (20.0 ± 0.1 mg) were heated in a platinum sample boat up. In accordance with Chiu
74a method
was created to hold isothermally at the desired starting temperature (298 K) for 10 min, then heating
at 5 K/min up to 353 K, then holding at this temperature for 10 min. The purge gas used was nitrogen
with a flow rate of 50 cc/min. Water was used as standard to check the heat capacity measurements
according to the method reported by Chiu.
743.
Results and Discussion
3.1
ILs in silico descriptors
3.1.1
ILs VolSurf+ descriptors
128 cationic in silico descriptors (Table C1)
75were calculated by importing the corresponding SMILES
codes in VolSurf+ and using the aforementioned steps. Derivation of the anions descriptors required a
slightly different procedure as compared to that adopted for organic ILs cations.
It is well known that small negative ions like halides do not exist in solution as free compounds. Rather
they are complexed by water molecules producing hydrated complexes.
76Therefore halides (Cl
-/Br
-/I
-)
were initially imported in Sybyl
77where a solvation shell was created within 3 Å sphere by using three
water molecules selected around the ions. Next, the hydrated ions have been processed (as .kout files)
using the GRID force field to produce the corresponding MIFs. All the other ions, including ions
containing metals or phosphorus, were directly imported by means of their SMILES codes in GRID force
fields without hydration shell. Finally VolSurf+ was used to convert the MIFs into molecular descriptors.
It is noteworthy that, due to the different information embedded in the file format, a large number of
VolSurf+ anionic descriptors results not to be generated. Thus, only 48 non-zero variables (see Table C2)
were extracted as anions descriptors.
753.1.2
ILs Principal properties
VolSurf+ allowed to derive reliable descriptors for a large number of compounds, either when
physico-chemical characteristics are scattered in literature and can be hard collected or organic structures result
not synthesized and therefore their properties are not available. Nevertehless, handling hundreds
descriptors, especially for very big data matrices, could be very difficult. Reducing ILs descriptors was a
prerogative in our studies. Furthermore, it was necessary to make simpler our QSPR studies limiting ILs
descriptors but not losing relevant information. A solution could be the parameterization of variables
into few intrinsic properties (the so-called Principal Properties, or PPs) by means of the PCA algorithm
summarizing many parameters into few ones, more easy to use and to interpret. VolSurf+ in silico
descriptors are related to molecular properties such as hydrophobic/hydrophilic balance, solubility,
organic solvent/water partition coefficients, H-bonding ability both as donor and acceptor, as well as
flexibility and skin permeability. Consequently PPs were expected to have a great potential for modelling
biological activities and physico-chemical properties for a large number of ILs.
PPs depend on the number of objects selected as learning set and on their "structural" features. The
Principal Component Analysis approach is an “open” statistical procedure leaving the choice of the data
matrix to the user, who has to decide which is an optimal balance between model (and therefore PPs)
generality and prediction ability. In our case the generality of cationic structures was privileged by
including as objects 218 different heterocyclic aromatic and non-aromatic cationic cores (imidazolium,
pyridinium, quinolinium, piperidinium, pyrrolidinium, morpholinium) for the derivation of cationic PPs.
Cation structures were imported in VolSurf+ by using their SMILES codes (Table B1
78in Appendix
section). Then, a PCA model was carried out on a data matrix containing 218 cations. A 5 PCs (Principal
Components) model explains 77.5 % of variance (see Table A1
78in Appendix section). All 5 PCs can be
considered significant for the above PLS model. Therefore, the scores for the 218 cations can be selected
as cationic PPs (Table B1).
78In the above model, the 1
stand the 2
ndPC explain 54.3% of total variance. In the corresponding loadings
plot (Fig. 3)
78variables referring to hydrophobic interactions ( and
on the plot, or 13-20 and 49-56
in Table C1)
78are located in the bottom left quadrant, whereas those related to hydrophilic interactions
( ,
and
or 5-12, 21-32 and 37-44 respectively) are in the upper right one. In the same upper
right quadrant but closer to zero for p[2] (i.e. providing lower information) we find descriptors related
to the unbalance of hydrophilic and hydrophobic regions with respect to the molecular barycenter (
and
, and 33-36 and 45-48 variables). In the bottom right quadrant there are solubility in water
descriptors ( and , or 98-108), while on the opposite quadrant (upper left) organic solvent/water
partition coefficients (
and or 67;68 and 73-79) together with molecular weight ( , 62), flexibility
( , 63-64), molecular volume and surface (
,
, 1-2), and skin permeability ( , 112). Descriptors
related to H-bonding ability ( and 21-26 as donor; and 27-32 as acceptor) are in the upper right
quadrant. Comparison of the loadings plot with the scores plot, reported in Fig. 4
78(see Fig. A1
78for a
simplified plot in Appendix section), evidences the descriptors influence on the structural features of
cations. In the bottom left quadrant are present cations characterized by long alkyl chains increasing
hydrophobic interactions, while, on decreasing the alkyl chain length, cations move towards the right
part of the scores plot driven by an increasing importance of solubility descriptors (see above). Finally,
cations having oxygenated chains (such as O-ether) and poly-oxygenated ones (such as O-ester or
carboxylic) move upward along the 2
ndPC (t[2]) due to their increasing ability to give H-bonds (Fig. A1).
78Moreover the 1
stPC (t[1]) discriminates morpholinium and piperidinium cations, exhibiting positive t[1]
p[1]
p
[2]
t[1]
t[2]
Fig. 3
p[1]-p[2] loadings plot reporting cations model descriptors.
W1-W8;
D1-D8;
WO1-WO6;
WN1-WN6;
IW1-IW4;
CW1-CW8;
ID-ID4;
CD1-CD8;
HL1, HL2;
MW;
Flex, Flex_RB;
LogP org. solv./water;
LgD5-LgD10;
S;
V;
%FU4-%FU10;
SOLY;
LgS3-LgS11;
DIFF;
CACO2;
SKIN;
lgBB;
MetStab;
others. See Table C1 for descriptors code explanation.
Fig. 4
t[1]-t[2] scores plot reporting the 218 cations coloured on the basis of their scaffolds:
imidazoliums;
pyridiniums;
quinoliniums;
pyrrolidiniums;
morpholiniums;
piperidiniums; diaza bicyclooctanium. See Fig. A1 for a more simplified scores plot.
p[3]
p
[4
]
t[3]
t[
4
]
Fig. 5
p[3]-p[4] loadings plot reporting cations model descriptors.
W1-W8;
D1-D8;
WO1-WO6;
WN1-WN6;
IW1-IW4;
CW1-CW8;
ID-ID4;
CD1-CD8;
HL1, HL2;
%FU4-%FU10;
SOLY;
LgS3-LgS11;
LogP org. solv./water ;
CACO2;
SKIN;
lgBB;
others. See Table C1 for descriptors code explanation.
Fig. 6
t[3]-t[4] scores plot reporting the 218 cations coloured on the basis of their scaffolds:
N,N-substituted imidazoliums;
N-alkyloxymethyl substituted imidazoliums;
N-alkyl substituted imidazoliums;
cat. 144 in Table B1;
N-substituted
pyridiniums;
unsubstituted pyridinium; quinoliniums;
pyrrolidiniums;
The 3
rdPC evidences the difference between more amphiphilic ILs from those with a higher hydrophobic
character. On the upper left quadrant of the p[3]-p[4] loadings plot (Fig. 5)
78we find few descriptors
such as skin permeability ( , 112), and hydrophilic/hydrophobic ratio (
, 57-58) . On the bottom left
quadrant there are variables describing permeability into CACO2 cells (
, 111), blood-brain barrier
permeation (
, 113), ability to form H-bonds as donor ( , 21-26) and, moving from zero to highly
negative p[3] and p[4],
loading
values descriptors related to percentage of unionized species at different
pH in the range 4-10 (
, 81-87). In the corresponding bottom left scores plot quadrant (Fig. 6)
78a clear
clustering of imidazolium scaffolds with endocyclic NH groups (
N-alkylimidazoliums and
N-alkyloxymethyl-imidazoliums) capable of bonding donation can be observed, together with other
H-bond donors such as unsubstituted pyridinium (
) and imidazolium with an ethanol substituent ( ).
Furthermore mono alkyloxy substituted imidazoliums (
) appear to be superimposable to the
blood-brain barrier permeation descriptor in the corresponding loadings plot, suggesting that these cations
possess a high ability to cross the blood brain membrane. It is worth mentioning that all the above
cations exhibit pK
avalues below 7, and consequently lose their cationic character on increasing pH; this
finding is in agreement with the position of the descriptors related to the percentage of unionized
species (
in Fig. 5,
78%FU4 - %FU10 from the right to the left in the bottom left quadrant) in the lower
left region of the loadings plot. In Fig. 6
78cations with morpholinium, pyrrolidinium, and piperidinium
scaffolds are all in the upper left quadrant, while pyridinium and quinolinium cations exhibit positive
t[3] score values. Moving on the diagonal from the upper left to the bottom right of the loadings plot
(Fig. 5),
78we find solubility ( and , 98-108) interaction with water ( and
, 5-12 and 37-44) and
H-bond acceptor descriptors ( , 27-32), and then hydrophobic interaction ones ( and
, 13-20 and
49-56). Moving along the same direction in the corresponding scores plot (Fig. 6)
78we find imidazolium
and pyridinium cations bearing substituents which increase hydrophobic interactions capability.
The 5
thPC is mainly required to discriminate H-bond donor descriptors ( , 21-24) exhibiting high p[5]
loading values from H-bond acceptor descriptors ( ,
,
and
,
or 32, 12, 44 and 91, 94) having
highly negative p[5] loading values (Fig. 7).
78Consequently in the corresponding scores plot (Fig. 8)
78cations with H-bond donor OH groups are in the upper part of the plot and cations with strong H-bond
acceptor capability exhibiting t[5] score values below -7.5 due to the presence of six carbonyl or ether
oxygen atoms (see cations evidenced in Fig. 8).
78p[4]
p
[5
]
t[4]
t[
5
]
Fig. 7
p[4]-p[5] loadings plot reporting cations model descriptors.
WO1-WO4;
WN6;
DRACAC;
ACACAC;
W8;
CW8;
others. See Table C1 for descriptors code
explanation.
Fig. 8
t[4]-t[5] scores plot reporting cations.
imidazoliums;
pyridiniums;
quinoliniums;
pyrrolidiniums; morpholiniums; piperidiniums; diaza bicyclooctanium. See Table B1
for evidenced cations labels.
II.
Principal properties for anions (PP-).
VolSurf+ was also used to derive a PCA model on a data matrix containign 38 ILs anions as objects (anions
list and corresponding SMILES codes in Table B2)
78and 48 variables (reported in Table C2).
75This model
gave four significant principal components that altogether explained 73.5% of the variance, with the 1
stPC describing alone the 27.5% of the variance (Table A2).
78Looking at the p[1]-p[2] loadings plot (Fig. 9),
78the 1
stcomponent discriminates anions according to
their hydrophobicity/hydrophilicity. Indeed, the main hydrophobic descriptors D1-D8 and CD1-CD8 (
and
on the plot, or 13-20 and 49-56 in Table C1
75respectively) are all located on the left, while the
corresponding hydrophilic descriptors W1-W8 and CW1-CW8 ( and
on the plot or 5-12 and 37-44
respectively) are found in the opposite region of the plot. Also HL1 and HL2 (
, or 57,58) variables are
located on the right in the plot, in agreement with the high hydrophilicity explained. The analysis of the
corresponding t[1]-t[2] scores plot (Fig. 10)
78indicates that the 1
stcomponent mainly distinguish two
anions (tetracyanoborate and tricyanomethanide, 4 and 7 in Table B2
78respectively) among the other
objects in the matrix. Tetracyanoborate and tricyanomethanide are hydrophobic anions, used to
generate hydrophobic ILs
79and also used to prepare dye-sensitive solar cells. The two anions also seem
to share similar behavior when used to prepare ionic liquids. Moreover, a low viscosity is associated to
the use of these anions.
80,81In the p[3]-p[4] loadings plot (Fig. 11),
78the PC [3] has high positive loadings for four VolSurf+ descriptors
related to the size/shape of the anions: V, S, R and G (
,
,
,
, 1-4). Furthermore, among the
W1-W8 ( , 5-12) descriptors, only W1-W5 rely in the right region of the plot, while W6-W8 are
oppositely located on the left side. In VolSurf+, the W1-W4 descriptors are related to hydrophilicity due
to polarizability, while W5-W8 are related to hydrophilicity due to the ability of an object to form
H-bonds as donor or acceptor. The variables IW1-IW4 ( , 33-36) are also located in the upper-left region
of the plot. Based on these considerations, in the corresponding scores plot (Fig. 12)
78highly polarizable
anions having large and globular size should be situated on the right along the t[3], while small
hydrophilic anions more suitable to give H-bond interactions and with the polar features well localized
in a portion of the anions should rely in the upper-left side of the t[3]-t[4] scores plot.
Indeed,
large
and
bulky
anions
such
as
tris(trifluoromethylsulfonyl)methide,
tris(pentafluoroethyl)trifluorophosphate and tris(heptafluoropropyl)trifluorophosphate (8, 32, 33 in
Table B2)
78are disposed on the right region of the plot, while acetate, (S)-hydroxypropanoate and,
2-(R)-hydroxypropanoate (15-17 in Table B2),
78all bearing a carboxylate moiety able to give H-bonds as
acceptors and responsible for a localization of the charge in a portion of the anions, are located in the
upper left region.
p[1]
p
[2]
t[1]
t[2]
Fig. 9
p[1]-p[2] loadings plot reporting anions model descriptors.
W1-W8;
D1-D8;
IW1-IW4;
CW1-CW8;
CD1-CD8;
CP;
HL1, HL2;
others. See Table C1 for
descriptors code explanation.
Figure 11
p[3]-p[4] loadings plot reporting anions model descriptors.
W1-W8;
D1-D8;
IW1-IW4;
CW1-CW8;
ID-ID4;
CD1-CD8;
A;
G;
R;
S;
V;
others.
See Table C1 for descriptors code explanation.
Figure 12
t[3]-t[4] scores plot reporting the 38 anions. Object labels reported in Table B2.
Tables C1, C2 were derived from an article published in SAR and QSAR in Environmental Research on 04 January 2016, available online: http//dx.doi.org/10.1080/1062936X.2015.1120778 (ref. 75).
Figures 3-12, A1 and Tables B1, B2, A1, A2 were derived from an article published in SAR and QSAR in Environmental Research on 08 March
p[3]
p
[4
]
t[3]
t[
4
]
3.2
A glance at ILs structures influence on their toxicity
Ionic liquids toxicological data were collected by consulting the UFT-Merck Ionic Liquids Biological
Effects Database
41(nowadays no longer available) where data were taken from different scientific
works, or performed by Merck laboratories. The UFT data can be summarized in a Table including 592
structures and 288 measurements (258 biological and 30 degradation tests). In the case of data from
different literature sources, values deriving from a higher number of replicates were selected. The
present investigation was limited to structures having an organic heterocyclic cationic scaffold (based
on imidazolium, pyridinium, quinolinium, piperidinium, pyrroldinium and morpholinium cation). The
resulting multivariate data matrix included 451 ILs and 258 biological plus 30 degradation tests.
However a high number of missing data were here present, therefore the corresponding rows and
columns were excluded from the matrix. The remaining data matrix contained 403 ILs and 35 variables
which included biological tests defined as ecotoxicity in the UFT-Merck database herein sub-classified
into: aquatic ecotoxicity (e.g. sensitivity to: Scenedesmus vacuolatus, Vibrio fischeri, Lemna minor),
toxicity towards fungi and bacteria (e.g. sensitivity to Gram-positive and Gram-negative bacteria and
fungi) and toxicity tests at a higher level of biological complexity: IPC-81 rat cell line cytotoxicity and
acetylcholinesterase (AChE) enzyme inhibition. The biological data originally reported as EC
50or IC
50(the
concentration at which half of the test organisms or test systems show a specific effect), MIC (Minimum
Inhibitory Concentration) and MBC (Minimum Bactericidal Concentration) were converted into a
positive log scale. These data were analysed by using PCA as discussed below.
3.2.1
Overall toxicity model
A PCA model from a 403x35 data matrix (ILs in Table B3 and variables in Table B4)
82provided a 3 PCs
model explaining 85.5% of total variance, with a predictability of 0.668, where 2 PCs already explaining
77% of variance (Q
2= 0.587).
82The scores plot showed in Fig. 13,
82represents the projection of the 403
ILs from 35 down to 2 dimensions, i.e. a plane maintaining the most relevant information (in the present
case 77%) of the dataset. In this plot no clustering according to the cation can be evidenced. In the
corresponding loadings plot (Fig. 14)
82all toxicity variables are in the right part of the plot, indicating
that the 1
stPC is an index of overall toxicity. As shown in Fig. 13,
82one can note that non aromatic rings
such as pyrrolidinium, piperidinium and morpholinium appear to be less toxic than aromatic ones
(imidazolium, pyridinium, quinolinium). In agreement with several previous studies,
40a toxicity increase
can be observed on increasing alkyl side chain length (i.e. hydrophobicity), while the presence of oxygen
in the side chain results in lower toxicity for long side chains. No clear cut anion effect can be evidenced
in this plot.
Fig. 13
t[1]-t[2] scores plot in the overall toxicity model.
Fig. 14
p[1]-p[2] loadings plot in the overall toxicity model.
Ca 2: Candida albicans ATCC 10231 (growth inhib.) 48h;Ca 5:Candida albicans ATCC 10231 (death) 5d; Eh 24: Enterococcus hirae ATCC 10541 (growth inhib.)24h; Eh 48: Enterococcus hirae ATCC 10541 (death) 48h; Ec 24: Escherichia coli ATCC 25922 (growth inhib.) 24h; Ec 48: Escherichia coli ATCC 25922 (death) 48h;
Kp 24: Klebsiella pneumoniae ATCC 4352 (growth inhib.) 24h; Kp 48: Klebsiella pneumoniae ATCC 4352 (death) 48h; Lm fa 7: Lemna minor (frond area) 7d;
Lm fn 7: Lemna minor (frond number) 7d;
Ml 24: Micrococcus luteus ATCC 9341 (growth inhib.) 24h; Ml 48: Micrococcus luteus ATCC 9341 (death) 48h; Pv 24: Proteus vulgaris NCTC 4635 (growth inhib.) 24h; Pv 48: Proteus vulgaris NCTC 4635 (death) 48h;
Pa A 24: Pseudomonas aeruginosa ATCC 27853 (growth inhib.) 24h; Pa A 48: Pseudomonas aeruginosa ATCC 27853 (death) 48h; Pa N 24: Pseudomonas aeruginosa NCTC 6749 (growth inhib.)24h;
Rr 5: Rhodotorula rubraPhB (death) 5d; Sv 24: Scenedesmus vacuolatus (cell count) 24h; Sm 24: Serratia marcescens ATCC 8100 (growth inhib.) 24h; Sm 48: Serratia marcescens ATCC 8100 (death) 48h; Sa A 24: Staphylococcus aureus ATCC 6538 (growth inhib.) 24h; Sa A 48: Staphylococcus aureus ATCC 6538 (death) 48h; Sa M 24: Staphylococcus aureus (MRSA) (growth inhib.) 24h; Sa M 48: Staphylococcus aureus (MRSA) (death) 48h; Sa N 24: Staphylococcus aureus NCTC 4163 (growth inhib.) 24h; Se 24: Staphylococcus epidermidis ATCC 12228 (growth inhib.) 24h; Se 48: Staphylococcus epidermidis ATCC 12228 (death) 48h; Vf 5’: Vibrio fischeri 5min;
Vf 15’: Vibrio fischeri 15min; Vf 30’: Vibrio fischeri 30min; AChE:Acetylcholinesterase inhibition; IPC-81: IPC-81 leukemia cells cytotoxicity; BOD 28: BOD 28d.
p[1]
p
[2
]
t[1]
t[
2
]
imidazolium
pyridinium
quinolinium
pyrrolidinium
morpholinium
piperidinium
IPC-81 variables from all other biological tests, whereas the 2
ndPC is required to discriminate the above
two variables. This bio-informatics finding has a rational biological explanation as AChE and ICP-81,
biological tests aimed at evaluating toxicity towards more complex living organisms, are expected to
have a different information content with respect to the other examined variables (i.e. they are not
representative of ecotoxicity). Moreover the model is somewhat “driven” by the great information
content provided by a large number of data (e.g. ILs) available for these two variables (232 for AChE
and 245 for IPC-81) as compared to that of all other variables. Consequently, in order to have a better
insight on the influence of the latter variables on ILs ecotoxicity, AChE and IPC-81 were excluded in
further PCA analysis and considered separately. PCA could not be carried out on a reduced data matrix
including both aquatic eco-toxicities and toxicity towards fungi and bacteria as both toxicological data
are not available for most ILs, probably due to different hydrophilic/hydrophobic properties which
prevent their determination in both systems. Therefore, aquatic ecotoxicity and toxicity towards fungi
and bacteria were separately analyzed. The above toxicities, which appear to be independent to each
other, are both extremely important to assess overall ILs eco-sustainability in relation to the new EU
chemical legislation for the Registration, Evaluation, Authorisation and Restriction of Chemicals
(REACH) adopted in June 2007.
3.2.2
Aquatic ecotoxicity
A further PCA was carried out on a 104x6 data matrix (ILs in Table B5 and variables in Table B6),
82where the variables are toxicological data derived from different aquatic organisms: Scenedesmus
vacuolatus (a green alga), Vibrio fischeri (a Gram-negative rod-shaped bacterium found in symbiosis
with various marine animals), Lemna minor (a floating freshwater aquatic plant). PCA provided a 2PCs
model explaining 94.9% of total variance (Q
2= 0.756), with the 1
stPC already explaining 81.1% of
variance (Q
2= 0.544).
82The resulting loadings plot (Fig. 15)
82shows that the 2
ndPC is required to
discriminate Lemna minor from Vibrio fischeri and Scenedesmus vacuolatus. The corresponding scores
plot (Fig. 16)
82opens a two dimensional window into ILs aquatic toxicity. This plot shows that the
different nature of aromatic cations has not a significant effect on toxicity (although non aromatic
heterocycles such as pirrolidinium, piperidinium and morpholinium cations appear to be less toxic)
and no significant anion effect can be evidenced. The 1
stPC scores can be assumed as an estimate of
aquatic toxicity, according to the corresponding loadings plot (Fig 15)
82with less toxic ILs in the right
part of the plot and more toxic ones on the left. These scores, considered as a unique “aquatic
ecotoxicity scores” for all the examined 104 ILs,
are reported in Table B5
82in order of decreasing t[1]
values corresponding to increasing toxicity, together with the rank of the same ILs for logICP-81 rat
cell line growth inhibition and logAChE enzyme inhibition toxicity values (Table B9-B10
82respectively).
p[1]
p
[2
]
t[
2
]
t[1]
imidazolium
pyridinium
pyrrolidinium
morpholinium
piperidinium
It is worth mentioning here that no single aquatic toxicity test is available for such a high number of
ILs (104) and this result was achieved by applying multivariate data analysis to six different tests, each
available for a lower number of ILs.
Fig. 15
p[1]-p[2] loadings plot in the aquatic toxicity model.
Lm fa 7: Lemna minor (frond area) 7d;Lm fn 7: Lemna minor (frond number) 7d; Sv 24: Scenedesmus vacuolatus (cell count) 24h; Vf 5’: Vibrio fischeri 5min;
Vf 15’: Vibrio fischeri 15min; Vf 30’: Vibrio fischeri 30min
![Fig. 7 p[4]-p[5] loadings plot reporting cations model descriptors. WO1-WO4; WN6; DRACAC; ACACAC; W8; CW8; others](https://thumb-eu.123doks.com/thumbv2/123dokorg/4519463.34867/21.892.143.785.124.525/fig-loadings-reporting-cations-model-descriptors-dracac-acacac.webp)
![Fig. 10 t[1]-t[2] scores plot reporting anions. Object labels reported in Table B2.](https://thumb-eu.123doks.com/thumbv2/123dokorg/4519463.34867/23.892.134.760.585.934/fig-scores-reporting-anions-object-labels-reported-table.webp)
![Figure 12 t[3]-t[4] scores plot reporting the 38 anions. Object labels reported in Table B2](https://thumb-eu.123doks.com/thumbv2/123dokorg/4519463.34867/24.892.146.760.565.916/figure-scores-reporting-anions-object-labels-reported-table.webp)
![Fig. 20 t[1]-t[2] scores plot in the overall toxicity model for imidazolium chloride-based ILs](https://thumb-eu.123doks.com/thumbv2/123dokorg/4519463.34867/33.892.170.792.128.469/fig-scores-overall-toxicity-model-imidazolium-chloride-based.webp)


![Fig. 32 t[1]-t[2] scores plot for AChE toxicity PLS model. The objects are coloured as follows:](https://thumb-eu.123doks.com/thumbv2/123dokorg/4519463.34867/48.892.158.794.612.999/fig-scores-ache-toxicity-model-objects-coloured-follows.webp)