Università degli Studi di Ferrara
Dottorato di ricerca in Fisica
Ciclo XXII
Coordinatore Prof. FRONTERA Filippo
Fingerprint Enhancement by means of Electromagnetic Radiation:
a Pilot Study to Drive Future Researches
Settore scientifico disciplinare FIS/07
Dottorando Tutori
Dott. MATTEI Aldo Prof. FIORENTINI Giovanni _________________ __________________________ Prof. PETRUCCI Ferruccio Carlo
Contents
1. Introduction……….4
1.1 Fingerprints as a powerful tool for legal systems……...4
1.2 Motivation of the research………...……...7
2. Fingerprint enhancement on smooth non porous surfaces:
state of the art………10
2.1 Visual examination….………..………11
2.1.1. Light sources………11
2.1.2. Optical phenomenology………13
2.2 Chemical developing of marks….……...……….20
2.3 Physical enhancement of marks………...………26
2.4 Effects on DNA typing of the chemical and physical
techniques………28
2.4.1. Experimental setup…...………...31
2.4.2. Tests………32
2.4.3. Results and discussion…..………...………34
3.1.1. Experimental setup………...…………...40
3.1.2. Tests…………..………..41
3.1.3. Results and discussion………..………...43
3.2 Image spectroscopy: monochromator ………..…………45
3.2.1. Experimental setup………...………...………46
3.2.2. Tests………47
3.2.3. Verification test………..….51
3.2.4. Experimental setup of the verification test…….….52
3.2.5. Results and discussion……..………..….57
3.3 Design of a new device for image spectroscopy…...…...58
4. Polarized light imaging……….59
4.1 Experimental setup………...…62
4.2 Results and discussion ………...…..…64
5. Chem-imaging using Fourier Transform Infrared
Microscopy and the use of Synchrotron Light………...…65
5.1 Experimental setup……….…..66
5.2 Results and discussion………..…70
6. Conclusions………72
7. Future perspectives………...…73
8. Acknowledgments ………75
1. Introduction
1.1 Fingerprints as a powerful tool for legal systems
Fingerprints are a worldwide well known tool for law enforcement agencies to reach the individualization of people convicted of a crime. Moreover, all major countries have huge fingerprint databases and efficient automated systems (AFIS) to perform electronic screening of fingerprints marks recovered by crime scene investigation.
Fig. 1: inked finger friction ridge impression.
AFIS systems produce a list of candidates from the biometric database, “probable and/or possible” perpetrators of the investigated crime. After that, the fingerprint expert checks the list and controls if there is a
positive match between the candidates and the latent mark, reaching, in this way, the individualization of the suspect.
Fingerprints are permanent and even if, from a scientific point of view, they could not be considered unique, friction ridge is highly selective and allows a discrimination between different individuals with a very high proficiency.
The friction ridge identification process has been recently widely discussed, but since sixties, worldwide fingerprint experts agree on its four principal phases:
1. analysis of the latent finger mark;
2. comparison with a set of ten print cards from a list of suspects; 3. evaluation on the consistency or non consistency of the
hypothesis of identification/exclusion; 4. verification process.
More recent studies, developed after two famous identification errors occurred in Scotland and in the U.S.A., reached the conclusion that in the identification process the most important goal to lower the error rate, is to strengthen the analysis phase [1; 2].
During the analysis phase, the fingerprint expert has to assess the reality of the recovered mark formations and their clarity, in order to determine what information is visible and reliable, considering the possible/probable way of deposition of the print, according to the particular developing technique.
In the identification process, three conventional level details are considered:
1. level 1 (order of magnitude: 1 to 10 mm) refers to the overall pattern formed by the flow of papillary ridges on the papillary surface;
Fig. 2a: fingerprint image where level 1 and level 2 (examples in red circles) are clearly visible.
2. level 2 (order of magnitude: 0.1 to 1 mm) refers to major ridge path deviations, also known as minutiae or characteristics. Basic forms are ridge ending, bifurcations and dots;
3. level 3 (order of magnitude: 0.01 to 0.1 mm) refers to intrinsic ridge formation, as the alignment and shape of each single ridge unit, the pore shape and the relative pore position.
Fig. 2b: enlargement of an inked friction ridge: it is easily detectable the bifurcation (level 2 detail) and the white dots are pores (level 3 details).
Usually, conventional chemical and optical techniques could not develop level 3 details, and information absolutely useful for investigation purposes is lost.
Therefore, is extremely important to design developing techniques able to reveal details with great accuracy.
Up to now, the most common techniques for enhancing latent fingerprints from articles collected in the crime scene are based on chemical-physical processes, or optical detection techniques, based on absorption, photoluminescence, diffused reflection or ultraviolet imaging, with appropriate band-pass and/or narrow-band filtering.
1.2 Motivation of the research
Chemical-physical processes have shown really good performances, but they are destructive with respect to the latent finger mark deposit and in most cases these methods partially affect subsequent DNA analysis. On the other side, optical detection processes have the advantage of being
non-destructive of the fingerprint. As a result, these techniques allow later performing of DNA analysis and/or the further application of conventional fingerprint development procedures.
The conventional techniques are still effective in the recovery of latent prints under ordinary conditions. On the other hand, the traditional methods of latent print detection may impair the subsequent DNA typing.
On the contrary, the majority of the optical techniques, with the possible exception of the ultraviolet inspection, allow further biological analysis. And as the aforementioned methods have the advantage of being non alterative with the respect of the fingerprint deposit, subsequent application of chemical and/or physical methods is not precluded.
However, the range of the electromagnetic spectrum usually used for these purposes is from shortwave UV until all the visible band (200 to 700 nm).
The absorption technique is used for the enhancement of visible fingerprints, contaminated with coloured material, showing characteristic absorption properties. For this purpose high-intensity light sources (such as filtered arc lamps or xenon lamps) are used.
The inherent luminescence of finger mark has been investigated mainly using laser sources (four different types have been employed: the argon ion, the copper vapour, the Nd:YAG and the tuneable dye) [6; 7; 8; 11; 12]
The diffuse reflection method is based on the property of diffusing light by the fingerprint deposit. High-intensity white light devices are
At the end, ultraviolet imaging requires the use of a UV-sensitive CCD camera and a source of UV light (mercury – xenon lamp or UV laser, usually from 250 to 350 nm). The technique is based on the contrast between the surface, which may absorb or reflect UV light, and the finger perspiration deposit, that absorbs selectively some UV radiation and diffusively reflects the other.
Moreover, some recent studies are investigating the X-ray fluorescence of fingerprints, and some others are attempting to discriminate the IR spectrum of the finger mark deposit from the IR spectrum of the surface. Actually, IR imaging has been tested successfully on chemical IR-fluorescent reagent for sweat deposit and also directly on sweat.
It is easy to understand how crucial is to develop a robust technique of optical analysis, able to reach a high-resolution imaging of finger marks, requiring no chemical conventional or non-conventional pre-process and producing no modification either on the finger perspiration deposit or on the background surface. The proper image of the fingerprint, obtained from the item surface, could allow us to perform a complete fingerprint analysis, which potentially leads us to the individualization of the perpetrator. Moreover, fingerprint imaging could exactly point out the particular region of the whole surface where we can surely find the DNA of the donor, with a higher probability of successful analysis.
Besides, the IR analysis carries on another high interesting potential piece of information concerning the chemical composition of the finger mark deposit, so we should be able to detect if a fingerprint is made by sweat or by blood, semen, saliva or by other organic traces coming from the victim or, in general, from the crime scene.
In conclusion, both the scientific and the investigative interest on the extensive application of finger mark optical imaging on real cases is really strong. The main goal of this research is to explore reliable techniques in order to detect, develop and acquire fingerprint images from smooth and non porous surfaces avoiding DNA damage.
2. Fingerprint enhancement on smooth non porous surfaces:
state of the art
In general we may consider three forms of fingerprint evidence that may be found at a crime scene:
• visible prints; • impression prints; • latent prints.
This work is mainly based on latent marks, which could be retrieved in the crime scene, invisible or hardly visible and therefore need some development or enhancement process for their visualization. Only smooth and non porous surfaces will be considered.
Research has developed new methods for the visualization of finger marks, on the basis of the chemical composition of the fingerprint residue. Even if the fingerprint composition is highly variable with age, sex, psychological conditions and type of secretion, many of the compounds present are known and recognizable. Some methods target water-soluble components, while others target lipids. The effectiveness of the method depends on the mark, the surface, and the boundary
Physical methods consider both the chemical and the physical properties of fingerprint residue components and their potential interactions.
Chemical methods consider the chemistry of fingerprint residue components and their potential reactions.
Visual examination and optical techniques in general exploit the differences in terms of optical properties between the mark deposit and the surface.
Finally, a systematic approach involves the combination of techniques in an application protocol.
2.1 Visual examination
Currently, the standard operating procedures of the forensic science laboratories consider first the DNA swabbing from the item surfaces and subsequently the fingerprint enhancement by the most effective chemical-physical technique.
White light examination may reveal visible prints, captured by photography, without any further treatment. Equally, other optical techniques can disclose latent prints that may not be enhanced by chemical and/or physical techniques. Thus, the first step of any latent fingerprint enhancement process is the visual examination of the surfaces, with techniques selected according to the properties of the surface and the boundary conditions.
2.1.1 Light sources
Light sources currently used for surface inspections are:
• Alternative light sources (ALS): xenon lamps with wide bandpass filters, where the emission of light varies from the near ultraviolet
to the near infrared. The white light could be divided into intervals of frequencies, covering all the visible spectrum;
Fig. 3: ALS LUMATEC® Superlite 400 and accessories.
• Led torches, both in white or in colored lights. Recently a sensitive improvement in output power and in color availability has been reached;
Fig. 5: spectra of emission of the FosterFreeman® LED torches.
• Lasers: solid state green (532nm), blue (460nm) , yellow (577nm), the argon ion, the copper vapour, the Nd:YAG and the tuneable dye.
Fig. 6: Coherent® TracER portable solid-state laser.
2.1.2 Optical phenomenology.
• Absorption.
This technique is used for the enhancement of visible finger marks, when are contaminated with a coloured substances. With characteristic absorption properties, that can be utilized to
maximize contrast. (e.g. blood has an absorption peak at 415 nm, which can be exploited to enhance bloody prints).
The enhancement of coloured prints take into account also the colour of the surface. Two different approaches may lead to a positive result: the first consider to choose an illumination wavelength that will darken the friction ridges, increasing absorption, and lighten the background surface, promoting reflection. The second one applies white light illumination coupled with an appropriate filter of the same colour of the reflecting surface. In both cases, the background will appear lighter.
• Luminescence
The use of laser illumination to detect latent fingerprints is one of the most effective techniques to excite inherent luminescence of latent fingerprints on non luminescent surfaces. It has to be stressed that mostly the positive results of this technique are due to latent prints contaminated with fluorescent substances (makeup, cream, oil). Even if in real casework the success rate is not so high, the crime scene search for luminescent fingerprints should always come before the physical and/or chemical developing.
The article surfaces should be investigated also at different wavelengths by means of high-intensity light source (alternative light sources – modified xenon arc lamps, quartz halogen lamps or LED sources) while observing through dedicated filters. To maximize the sensitivity of the human operator and to increase the signal to noise ratio of the acquiring device, the ALS and/or LED inspection may be
Starting from the early eighties, scientific research was applied to develop luminescent chemical compounds with appropriate excitation and emission wavelengths in order to exploit light sources to generate luminescence phenomena.
It is proven that the ALS can perform very close to lasers when applied to chemical treated articles.
The ALS based on xenon arc lamps or quartz-halogen lamps with filters can be replaced with LED arrays. Recently extremely powerful LED are available on the market and they present some advantages if compared with traditional ALS:
1. high availability of frequencies; 2. narrow band emission;
3. uniformity of the emitted beam; 4. easy to handle whilst battery operated; 5. lower costs compared to ALS.
LED may replace ALS in the next future, specially for enhancement of chemical processed finger marks, even if dealing with untreated latent marks, lasers are still outperforming other light sources.
• Diffused reflection
The latent finger mark may be regarded as an alteration of the smooth surface. Thus, incident light tends to be diffused from the mark. This optical property can be used for the enhancement of latent fingerprints on smooth, reflective non porous surfaces such as glasses, plastics and metals.
Fig. 7: Specular reflection of incident radiation from a smooth surface and back scattering of incident radiation from a rough surface.
The light inspection of the reflective surface has to be conduced with an oblique lighting, revealing latent finger marks, marks in the dust or physical and/or chemical enhancement. In the aforesaid conditions, fingerprints will appear as light pattern produced by light scattered by ridges, in a dark background.
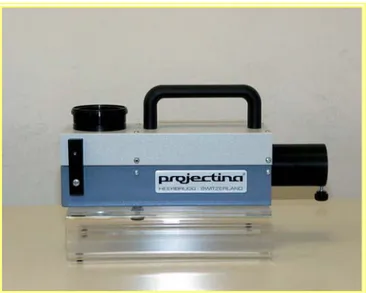
Fig. 9: Projectina® coaxial episcopic device.
As shown in fig. 8 the episcopic illuminator is a device realized to capture only the reflected light, cutting the noise of the scattered light by means of an oblique glass.
The technique utilize a twisting glass, that works as a semitransparent mirror, in order to observe the scattered light through the refracted beam of the glass filter. Because illumination, reflection, and observation are parallel, the device is so called coaxial.
The scattered light from the latent fingerprint is reflected by the glass. Only the reflected light from the shiny surface forms the refracted beam which passes trough the glass slide. Thus, the latent will appear with dark ridges into a light background.
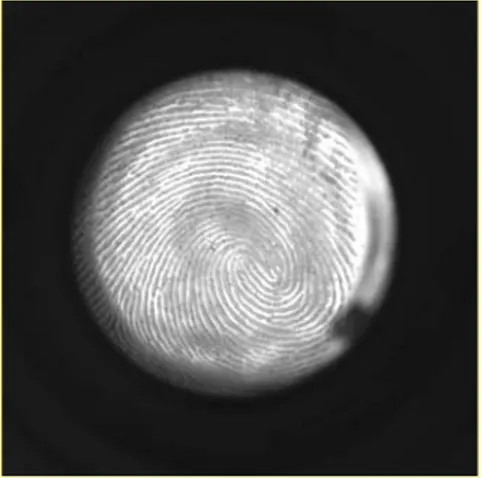
Fig. 10: photograph of a latent mark captured by a coaxial episcopic illuminator.
Episcopic coaxial inspection could be used as a visualization technique for unprocessed latent finger marks, as well as an enhancement technique after chemical treatment of the marks.
• Ultraviolet imaging.
Nd:YAG laser illumination by fourth harmonic (266 nm) produces luminescence of sebaceous prints, rich in lipid fraction, but not of eccrine prints, rich in amino acidic fraction. The emission is observed in the long-wave UV region of 300 to 400 nm. To excite an amino acidic fraction luminescence long time exposures are needed.
Equally, if the excitation source emits at 280 nm for sebaceous prints two peaks are detectable, one at 330 nm and the other at 440 nm. Some techniques actually under study consider also the lifetime of fluorescence. Usually the fluorescing time of the background is shorter than the fluorescing time of the fingerprint. So the application
of time resolved techniques may be an interesting way to image fingerprints.
Once more the UV laser illumination may be applied as an enhancement technique for exciting fluorescence in chemically pre-treated surfaces.
Even if the background is UV luminescent, as, e.g. the white glossy paper, the short UV light inspection could enhance latent finger marks specially if its constituents are absorbed by UV light.
Another approach is followed by considering the optical detection of latent finger marks by shortwave UV reflection. This technique requires a UV lamp (254 nm) to illuminate the surface of the article. The images are captured by a UV camera provided with a narrow band UV filter.
At 254 nm the lipids of the fingerprint deposit back scatter the UV light, whilst the background may absorb the incident radiation. In this case the ridges of the print are light on a dark background. On the contrary, if the background reflect the UV light, in that case the ridges appear dark in light background. One of the parameter which is to be taken into account is the angle of the incident UV light. As a matter of fact, the abovementioned technique may be used both on non processed latent prints as well as on chemically processed ones.
The capture of the images enhanced by means of UV waves may be performed using a CCD UV - sensitive camera or a silicon CCD camera coupled with an UV imager device, that converts the UV incoming radiation in a visible signal pixel by pixel.
When using the first device, major concerns are constituted by the fact that the human eye cannot reveal the UV radiation. Thus, a digital camera UV sensitive, with UV bandpass filter and live view are recommended.
Fig. 11: Short UV light inspection with a Spex® Scenescope UV imager and the latent finger mark captured with this system.
2.2 Chemical developing of marks
Considering smooth and non porous substrates, the cyanoacrylate esters fumigation is the most widely used, fast and cheap technique for the development of latent fingerprints, mainly in the laboratory, but also in the crime scene.
The methyl and/or the ethyl ester of cyanoacrylate are transparent, monomeric liquids, usually utilized as fast and high-strength glues, also called superglue. When heated, cyanoacrylate monomer vaporize: because of the presence of nucleophiles in the sweat deposit, the monomer start to react with a nucleophilic addiction to the carbon – carbon double bond.
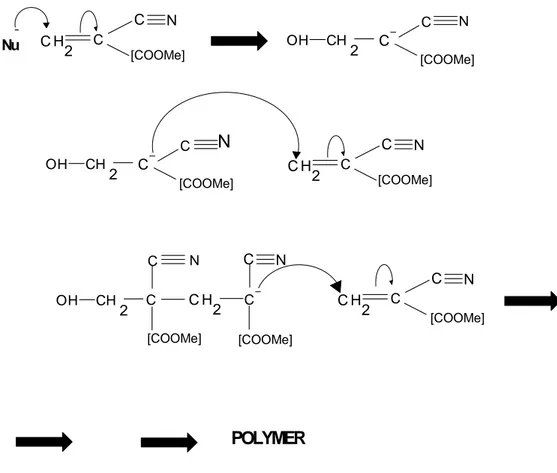
Fig. 12: cyanoacrylate polymerization chain reaction.
N C [COOMe] C H 2 C [COOMe] 2 OH- C OH CH C C [COOMe] 2 OH CH C C N [COOMe] C H 2 C N [COOMe] 2 OH CH N C [COOMe] C H 2 C C N C H+ H2O + O H N C C H 2 C [COOMe] + n molecole di cianoacrilato POLIMERO N Nu POLYMER
In the scientific literature different interpretation of the reaction mechanism are available. Recently (ENFSI-EWG annual meeting, Delft (NL), Sept. 2010) De Puit has proposed the amine group of amino acids of eccrine deposit as chain initiator, whilst the water content of the marks has the function of catalyst [13].
The vapour selectively polymerizes on the fingerprint ridges to form a hard, white polymer known as polycyanoacrylate.
Plenty of methods are available in order to obtain a suitable polymerization of cyanoacrylate (CA) on the latent finger marks.
In general, the article is exposed to the cyanoacrylate vaporization in a fuming chamber.
The cabinet has a heater in which the liquid monomer reach the boiling temperature and passes in the gas phase. The cabinet may have a humidity source and a ventilation system, which has the purpose to equalize the cyanoacrylate monomer concentration in the vapour phase. The chain reaction continues until vapour phase monomer is present in the cabinet: the polymerization process starts from the friction ridges of the latent mark and if not properly controlled, it may continue even in the space between two adjacent ridges, literally covering with the polymer the whole surface. So as to avoid an overexposure, the inside of these cabinets may be inspected directly by the operator. Control sample may be used to properly set the time of exposure.
A number of systems allows the vaporization of a small amount of cyanoacrylate directly onto the investigated surface or inside a confined volume, e.g. the passenger compartment of a vehicle.
Other systems are capable of producing massive flow rates of cyanoacrylate, permitting an extensively field use.
Fig. 13: FosterFreeman® fuming cabinet MVC5000.
Besides, other strategies to facilitate the vaporization of the monomer has been developed, as the vacuum cyanoacrylate fuming. The fuming cabinet is formed by a metal vacuum chamber. After the placing of the object to investigate inside the cabinet and opportunely feeding the consumables, the internal pressure is reduced from the atmospheric pressure to 0,2 mmHg by vacuum pumps. Due to the reduction of the pressure, the boiling point of liquid cyanoacrylate reaches the ambient temperature. Continuing to lower the pressure the liquid start to
evaporate. The fuming process rapidly keep on going, until the complete evaporation. Due to the reduced presence of other gasses and vapours, the concentration of cyanoacrylate is highly uniform in the inner volume of the cabinet and it is effective also in the internal surfaces. Producing polymers shorter than the traditional method, as shown through scanning electron microscopy, it avoids the risk of overdevelopment.
As a result, latent friction ridges enhanced by vacuum cyanoacrylate fuming are very detailed, even if the developed marks do not show the typical white colour. Thus, subsequent staining process is needed.
The reduced polymerization may be due to the evaporation of the water content from the marks, whereas vacuum process is running.
Although vacuum cyanoacrylate fumigation shows excellent results in terms of latent fingerprint enhancement, the developed marks are difficult to visualize because of an attenuated contrast with the background.
The cyanoacrylate polymer does not exhibit absorption band, but produces a diffuse reflectivity of the incident radiation of wavelength ranging from the ultraviolet to the infrared. Thus, the selection of the most suitable band of wavelengths to be used for the enhancement of the CA treated finger marks depends on the colour of the substrate.
Some of the aforementioned methods of visualization may be successfully applied to obtain higher contrast on cyanoacrylate fumed exhibits, as the coaxial episcopic imaging or the reflected ultraviolet imaging.
When cyanoacrylate fuming in itself has to be considered not sufficient even if visual enhancement is performed, there are several secondary treatments for developing cyanoacrylate fumed finger marks.
Cyanoacrylate enhanced finger marks may be further developed by secondary chemical treatment. The staining technique is widely applied. A large variety of dyes are available, with different colours and different properties (luminescence and fluorescence). These dyes have to be coupled with the appropriate visualization technique, consisting in the accurate selection of the proper band of wavelength of excitation, joined with observation filters, depending on the nature and the colour of the item surface.
The stain solutions may partially solve the cyanoacrylate polymer, causing a loss in the fingerprint image. Furthermore, the stained surface needs to be rinsed with water to facilitate the removal of the excess of dye. Thus, as later better explained, these techniques may compromise severely the DNA extraction from enhanced fingerprint.
At last, has to be mentioned the simple technique of dusting the surface with fingerprint powder after the cyanoacrylate fuming. Further on, it will be discussed the method of enhancing latent finger marks by means of powders, however it has to be considered that dusting is also a secondary enhancement process after cyanoacrylate fuming.
Also vacuum metal deposition (VMD), may be regarded as a secondary process after cyanoacrylate, that can be used after the staining. In extreme synthesis, the process consider the finger mark tridimensional: in a vacuum chamber different metal vapours are condensed on the
surface of the item, in sequence, enhancing the contrast between ridges and substrate.
As is easy to understand also this process may inhibit DNA analysis.
2.3 Physical enhancement of marks
The classic latent print developing technique for processing smooth nonporous surfaces is dusting with fingerprint powders.
The general application of powders is in the crime scene search, mainly on the surfaces and the objects not easily removable and transportable. The adhering mechanism is physical: powder particles stick to the moisture or the oily fraction of the mark deposit.
Powdering is a time and cost effective technique, that allows to secure the developed marks by means of adhesive tape or gelatine foils.
The application of the aforementioned method is recommended whilst the content of water in latent print is still high (so called fresh prints). This is due to the fact that while time passes, the evaporation of the water content of the fingerprint causes a reduction in its thickness.
The powder is applied using different kind of brushes. The distinction between them is made by their fibres (natural, glass or carbon fibres). The application procedure is only apparently simple: the physical contact between the mark and the brush should damage the fingerprint, as well as the brush may cause dangerous DNA transfer.
Different fingerprint powder formulations have been produced through last century, although each formulation consider a colorant for contrast
and a resin to foster the adhesion of the colorant to the fingerprint deposit.
Colorants are metallic oxides, sulphides and carbonates.
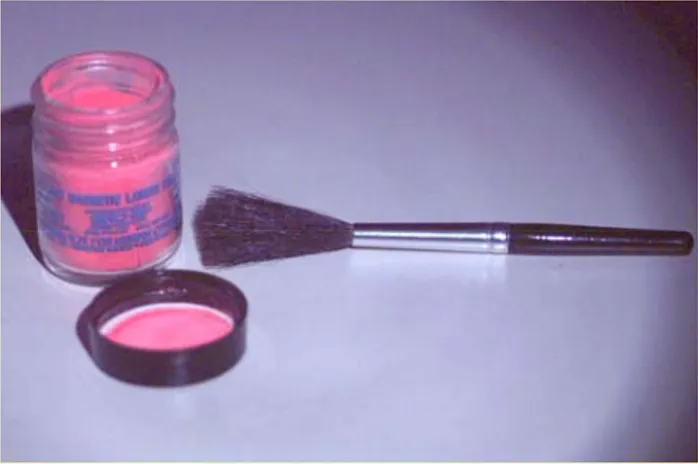
Fig. 14: UV Luminescent powder with a squirrel brush.
Some powders are made by spherical particles, as well s some other, like the aluminium powder, are made by flake particles.
Moreover a wide range of coloured fluorescent powders are available for dusting multicoloured items.
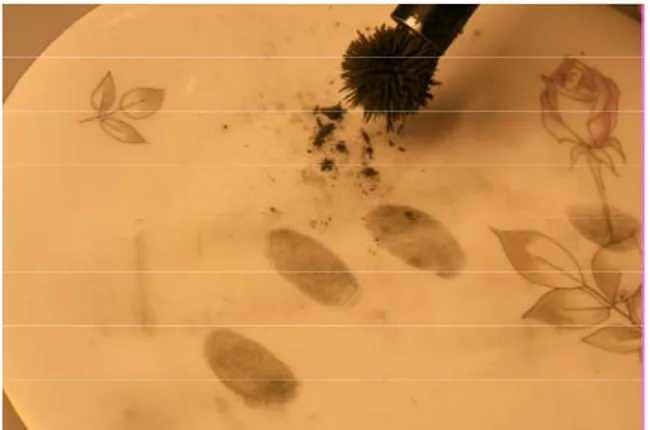
Another class of dusting powder is constituted by magnetic powder. Magnetic mixtures of iron particles and other metals flakes are applied by means of a magnetic brush, which could invert easily its polarity in order to collect or release the magnetic powder.
Dusting surfaces with brushes in order to develop latent finger marks it is an easy and cost effective technique, but some basic rules have to be followed:
o The colour of the powder has to maximize the contrast with the deposit;
o The average dimension of the particulate has to be suitable to
enhance all the smallest details.
Fig. 15: Fingerprint enhanced with magnetic powder applied by a magnetic brush.
2.4 Effects on DNA typing of the chemical and physical
techniques.
In the previous paragraphs it has been given an highlight of the most relevant techniques in order to detect and enhance fingerprints on smooth nonporous surfaces. If the fingerprint components are of paramount importance for the chemical techniques, there is a fingerprint component which is in itself a biometric: the deoxyribonucleic acid (DNA).
It has been proven that significant amount of DNA could be recovered by bloody prints: some studies have demonstrated that cyanoacrylate fuming, forensic light inspection and black powders may not affect the
whilst exposure of DNA to 254 nm UV radiation even if for a short time, dramatically lower the possibility of having a successful DNA typing. Apart from traces in blood, fingerprints are a well known biological material source.
Indeed, epithelial cells can be transferred as residues from sloughing or through direct contact with an object. In some cases, fingerprints characterization cannot be performed after enhancement because of partial prints and/or marks overlay. The DNA quantity of handled objects is sufficient to extract a complete DNA profile.
For this reason, many authors attempted nuclear DNA typing from fingerprints enhanced from a huge number of items, as a very useful tool in criminal investigations. In general such trend has led to the demand for an assessment of technical reliability of DNA analysis performed on such exhibits. So far, unambiguous approaches in this field have not been indicated yet, nor the establishment of reliable and robust guidelines can be considered an easy task.
Otherwise, in high profile cases, the most common forensic laboratories protocols consider the recovery of DNA from touched surfaces a priority: but what evidence is more important, the DNA or the fingerprint?
In spite of recent advances in DNA technology, at the moment the question is still open, even if, according to the literature physical and chemical methods seem to show low inhibition rate on subsequent DNA profiling.
Scientific research have made possible the recovery of DNA from: o blood prints and / or stains;
o saliva (envelopes, stamps, cigarette butts); on porous and non porous surfaces.
Most studies found that only a few visualization reagents inhibit DNA analysis. This assumption leads to the point whether DNA could be recovered from a smeared or partial, developed print that is without any identification value.
Has been widely demonstrated that the quantity of DNA present on handled objects is sufficient to extract a complete profile and in some cases also secondary transfer (from a different origin) allow the DNA typing.
The recovery of DNA from physical or chemical enhanced fingerprint shows the following critical factor:
o the intrinsic nature of the shedder: in fact some recent works suggest that there is no relation between good prints donors and good DNA shedders;
o the nature of the surface could provide some additional inhibition, which interfere with the eventual inhibition caused by the enhancement technique;
o the amount of DNA that may be recovered after the latent finger mark enhancement critically decrease;
o even if fingerprint techniques do not directly affect the PCR amplification and the DNA typing, as a matter of fact the quantity of DNA recovered after a fingerprint enhancement acutely drops.
2.4.1. Experimental setup
It has to be taken into account that the majority of the studies exploring the possibility of DNA profiling after fingerprint enhancement were conducted in laboratory condition.
In order to verify the real possibility of recovering both biometric information, we decided to develop a pilot study, which simulate the real casework situation.
The objective of this part of the research is to try to develop a reliable procedure, especially for high profile cases, to recover useful piece of evidence both on fingerprint and DNA side, achieving human individualization achieved by means of two different biometrics: fingerprint and DNA profiling. Before considering only optical non destructive techniques is of fundamental importance to outline advantages and drawbacks of the DNA typing after cyanoacrylate fuming. Main concerns to consider are:
o partial proved inhibition introduced by cyanoacrylate; o no optical UV inspection allowed before and after the
treatment, with potential loss of marks;
o Risk of loosing some of the few cells during the fingerprint enhancement;
o Variability in the donors’ population, whereas the test items were only touched in order to collect fingerprint, for only few seconds and they were not extensively handled.
2.4.2. Tests
Following, the details of the experiment conduced:
• STR AMPFlSTR Identifiler (Applied Biosystem) 1/3 standard volume 8.3 μl ;
• PCR parameters 34 cycles ;
• Mini STR AMPFlSTR Minifiler (Applied Biosystem) ½ standard volume 12.5 μl ;
• DNA extraction:
– swab with 3 x 3 mm paper with bi distilled water; – Chelex in 30 μl final volume;
– Positive and negative control performed; – No filtration or concentration.
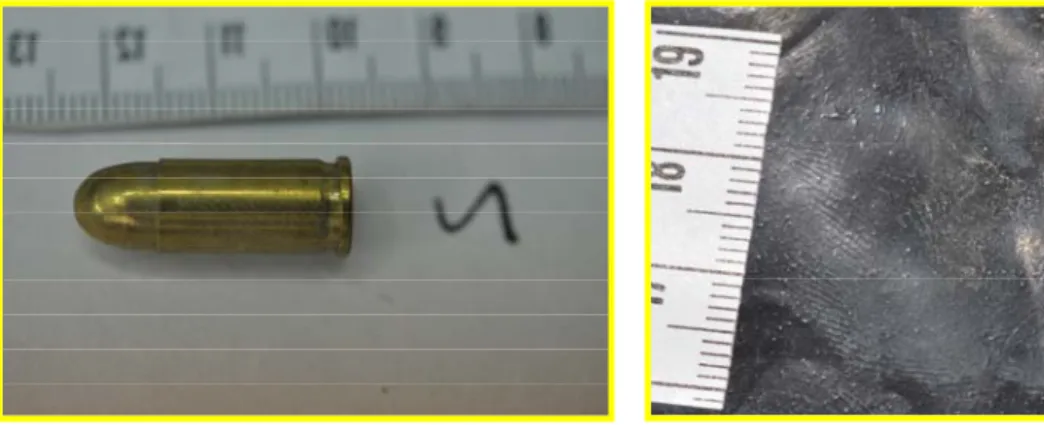
Fig. 16 and 17: the two different types of item selected for the trial, 9mm FMJ cartridge and a glass slide.
• DNA quantification:
– Quantifiler duo kit (Applied Biosystems) from 16 to 50 pg.
• Sequencing on AB 3130 xl genetic sequencer. Types of surfaces selected:
• Microscope sterile glasses;
• New 9mm brass full metal jacket cartridges, properly cleaned before print deposition.
Sampling policy: • 9 donors;
• one donor for each sample;
• all fingerprints deposited in one day;
• all fingerprints were deposited in sequence of five from the same finger, to model the real situation;
• Two sequences for each donor, the first one fumed with cyanoacrylate vapours, the second one used as reference sample.
Running of the experiment:
• All the samples to be enhanced were put in a DNA free cyanoacrylate fuming cabinet (Projectina®) for 15 minutes, accurately cleaned after and before each single process to avoid cross contamination;
• After the developing process each item was separately inspected with forensic light source (white light) and photographed;
Fig. 18: Example of a cyanoacrylate fumed depletion
• Each fumed item has been swabbed with sterile filter paper and the DNA has been profile following the aforementioned protocol;
• Each control sample has been swabbed with sterile filter paper and the DNA has been profiled following the aforementioned protocol.
2.4.3. Results and discussion
The results of the trial indicate a good degree of reliability of the aforementioned process when applied on most of the tested items. Being a single tube approach, adequate Chelex methodology prevent or at least minimize the loss of DNA, whereas inhibition and "in-tube" nucleic acid degradation is
still a major concern. On the other hands silica column – based extraction resulted in partially usable profiles for enhanced print on slides. To the contrary, for the remaining samples, the cartridges, partial and total loss of signal in subsequent genotyping was most likely caused by inhibition more than retention of DNA by the column.
As a matter of fact, for smooth non porous surfaces Chelex revealed an enormous potential as to time and costs effectiveness.
A higher sensitivity in touched objects STR profiling has been reached by changing different reaction conditions in Chelex protocol and additionally using length-reduced amplicons markers. Full profiles were obtained from both good and only fragmentary fingerprints, regardless to quality of the print itself, when non chemically enhanced. To a minimal extent, drop in and drop out peaks still affects resulting electropherograms.
Partial profiles were obtained from both good and only fragmentary fingerprints, as well as in the case of non treated latent marks. Even in this electropherograms show seldom same drop in and drop out artefacts.
Fig. 19: DNA profile obtained from cyanoacrylate enhanced fingerprint.
To summarize the results on glass slides:
• Swabbing directly marks 100% profiles with 13 to 15 loci;
• After cyanoacrylate fumigation 100% profiles with 6 to 9 loci.
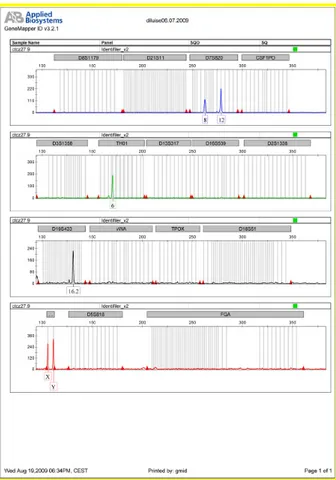
Fig. 20: no value DNA profile obtained from cyanoacrylate enhanced fingerprint on 9mm fmj cartridge.
These results should be seen from two different perspectives: from the point of view of the investigator the technique should be considered more than successful, because it allowed to gain lots of additional biometric information on the trace, whereas from the outlook of the forensic scientist is
mandatory develop different techniques which may deliver a complete information both on fingerprints and on DNA.
Surprisingly, for 9mm cartridges, before and after cyanoacrylate fumigation, no profiles were obtained. On these sample, a strong DNA inhibition has been detected and the evaluation of the reasons is still in progress.
The same technique, extensively applied in real caseworks, allowed to obtain full profiles from the same class of items, when changing the chemical composition of the cartridge case.
3. Spectroscopy by images
The results of the experiment on DNA and cyanoacrylate fuming have to be considered. According to the literature, they clearly show a loss in the DNA number of loci, when items are pre processed for fingerprint enhancement. In order to deepen the extent to find a suitable tool to simply image the latent fingerprint, without any detrimental effect on DNA typing, further research on optical methods has to be conducted. To briefly point out the philosophy under the work, consider latent finger mark on a smooth non absorbent surface in a physical sense: the fingerprint on the item is a different phase, with different physical properties. With the purpose to develop the latent and, subsequently, to obtain a DNA profile, the electromagnetic radiation, starting from the visible to the infrared, produced by conventional (incandescence lamps and lasers) and non conventional sources (synchrotron radiation) is used
Following this idea, luminescence and phosphorescence occurrences will not be considered.
Only absorption and reflection phenomena of the incident electromagnetic radiation will be taken into account.
3.1. Image spectroscopy: white and red light.
Fingerprint analysis has been carried on as a result of the fact that different substances (the mark and the surface) show different optical properties while an electromagnetic radiation beam is focused on them, without considering any induced fluorescence phenomena. Therefore, at a first instance, the following light sources were considered:
o Alternative white light source, with tunable intensity and light guides;
o Laser Mells Griot 632,8 nm, 15mW output power; o Red LED light.
Imaging system:
o binocular microscope;
o digital video camera Hitachi KP-FD 140F – S1 IR filter, CCD 0.5 inch, 1,45 Mpixel;
o Personal computer.
Sampling policy:
o Test fingerprints on glass slides; o 2 donors;
o Fresh prints, both sebaceous and eccrine; o Depletion series.
3.1.1. Experimetal setup
Fig. 21: the light source, red LED or white light, illuminate the mark tangentially, while the CCD is perpendicular.
Following, all the relevant parameters and data of the experiment are briefly summarized:
o Configuration 0°/90°, means that the incident beam is tangent to the item surface and the capture device is perpendicular to the latent mark (see figure 21).
o Red laser Mells Griot (632.8 nm) supported by a Ealing desk;
o On the axial direction of the beam, there are a dispersion element, an optical barrier of 20 mm of diameter and a periscope for directing the beam on the sample (see figure 22).
Fig. 22: the laser beam is directed tangentially on the item, put onto the microscope stage. Images are captured perpendicularly to the CCD.
3.1.2. Tests
As an example of all the test run, in figure 23 is reproduced a one day old fingerprint in daylight, in figure 24 the light source used is white light, in figure 25 the light source utilized is a red LED light and, at last, in figure 26 an imaging of the same print under a laser beam is given.
It has to be underlined that all images are not enhanced, in order to verify in which condition the amount of information captured by the
CCD is maximum in terms of contrast between friction ridges and the substrate.
Fig. 23: mark under daylight illumination.
Fig. 26: mark under Laser red light illumination.
3.1.3. Results and discussion
The limit of this configuration is the low power of the beam on the sample surface.
Even if the dispersion element has been changed with a cylindrical lens so as to focalize the beam no sensitive improvement has been detected.
In order to understand if the poor results obtained in the red wavelengths is due to a limitation in the emitted power by laser and LED light, narrow band red filters has been used, coupled with a powerful white light source.
Two different filters were tested:
o Filter narrow band 610 nm (band width 40 nm); o Filter narrow band 630 nm (band width 40 nm);
Moreover, the images obtained when red filters were applied have been digitally enhanced, because of the poorness of the contrast. “Image J” software has been used for the latent marks enhancement.
limitation revealed with the red LE dependent by the particular wavele limitation in the emitting power of
Fingerprints rich in details were the ones with filtered white light, quite similar to images obtained with not filtered white light.
Fig. 27: mark under white light.
As a result of the application of the filters, was clearly stated that D light and the red laser are not ngth in itself, but is due to a the two red sources.
Fig. 29: mark under red LED and narrow bandpass filter 630 nm.
3.2. Image spectroscopy: monochromator .
Fingerprints need to have strong incident radiation, in order to be revealed by an incident beam. Attempting to achieve more details concerning the most sensitive wavelengths for fingerprint, the change of the emitting source was considered.
Therefore, this experiment was carried on by means of the following light sources:
o Alternative white light source, with tunable intensity and light guides;
Fig. 28: mark under white light and narrow bandpass filter 630 nm.
o Monochromator Bausch & Lomb cat. No. 86-02 with lamp 33-86-25 a 115V, emitting spectrum range 350 - 800 nm.
Imaging system:
o binocular microscope with infrared filters;
o digital video camera Hitachi KP-FD 140F – S1 IR filter, CCD 0.5 inch, 1,45 Mpixel;
o Personal comupter. Sampling policy:
o Test fingerprints on glass slides; o 2 donors;
o Multiple samples;
o Prints range from one month old to five month old, both sebaceous and eccrine;
o Depletion series.
3.2.1. Experimental setup
Following all the relevant parameters and data of the experiment are briefly summarized:
o Configuration 45°/90°, means that the incident beam forms a 45° angle with the item surface and the capture device is perpendicular to the latent mark (see figure 30).
o Monochromator Bausch & Lomb cat. No. 33-86-02 with lamp 33-86-25 a 115V, emitting spectrum range 350 - 800 nm.
converging lens, with three degrees of freedom, which could focus the beam exactly on the item (see figure 30).
Fig. 30: the monochromatic beam is directed with a slope of 45° on the item, put onto the microscope stage. Images are captured perpendicular to the CCD.
3.2.2. Tests
With the abovementioned configuration two different series of tests were conduced.
During the first series of trials one month old test fingerprints were considered. The tests finger marks were imaged by the narrow band beam of the monochromator. The same test prints were inspected varying wavelengths with steps of 10 nm.
To perform the second series of trials five month old test fingerprints were considered. The tests finger marks were imaged by the narrow band beam of the monochromator. The same test prints were inspected varying wavelengths with steps of 20 nm, whilst during
l
two subsequent images inspected under beam 10 nm in wavelength.
(left) and at 400 nm (right)
)
the first experiment it was possib e to detect small variations between s which differs only of
Fig. 31 and 32: beam at 380 nm
Fig. 35 and 36: beam at 460 nm (left) and at 480 nm (right)
Fig. 37 and 38: beam at 500 nm (left) and at 520 nm (right)
Fig. 41 and 42: beam at 580 nm (left) and at 600 nm (right)
Fig. 43 and 44: beam at 620 nm (left) and at 640 nm (right)
Fig. 47: beam at 700 nm
3.2.3. Verification test
After a wide repetition of the experiment, in order to ensure an appropriate reproducibility of the experiment, every single equipmet has been checked and tested.
The monochromator has been calibrated by means of 632.8 nm laser and a sodium lamp.
Also the image acquiring device Hitachi has been calibrated in the 400 nm – 800 nm interval.
With the ultimate purpose of verifying the detected trend, furthering the investigation in the near infra red, has been designed an analogous system of optical imaging.
Therefore, another experiment was carried on by means of the following light sources:
o Monochromator Bausch & Lomb cat. No. 86-02 with lamp 33-86-25 a 115V, emitting spectrum range 350 - 800 nm, without split.
Imaging system:
o binocular microscope without infrared filters;
o digital video camera black and white Pulnix AccuPixel TM-1400 CL; acquisition software “Measurement and Automation Explorer Pulnix TM-1400 CL; Image dimension: 1396x1036 pixels; 0.25 x; lock up table: LOG;
o Personal comupter. Sampling policy:
o Test fingerprints on glass slides; o 2 donors;
o Multiple samples;
o Prints range six month old, both sebaceous and eccrine; oDepletion series.
3.2.4. Experimental setup of the verification test
Following all the relevant parameters and data of the experiment are briefly summarized:
o Configuration 45°/90°;
o Monochromator Bausch & Lomb cat. No. 33-86-02 with lamp 33-86-25 a 115V, emitting spectrum range 350 - 800 nm, without split in order to increase the output power of the beam, even if the beam in itself loose uniformity;
o Same configuration of the previous experiment (see figure 48). With the abovementioned configuration the verification tests were conduced.
To perform the trials at least six month old test fingerprints were considered. The tests finger marks were imaged by the narrow band beam of the monochromator. The same test prints were inspected varying wavelengths with steps of 20 nm. The range of wavelength was extended to 740 nm.
Fig. 48: the beam has a slope of 45° on the item, put onto the microscope stage. Images are captured perpendicular to the b/w CCD.
Fig. 49 and 50: beam at 380 nm (left) and beam at 400 nm (right)
Fig.51 and 52: beam at 420 nm (left) and beam at 440 nm (right)
Fig. 53 and 54: beam at 460 nm (left) and beam at 480 nm (right)
Fig. 55 and 56: beam at 500 nm (left)
Fig. 57 and 58: beam at 540 nm (left) and beam at 560 nm (right)
Fig. 59 and 60: beam at 580 nm (left) and beam at 600 nm (right) and beam at 520 nm (right)
Fig. 61 and 62: beam at 620 nm (left) and beam at 640 nm (right)
Fig. 67: beam at 740 nm
3.2.5. Results and discussion
All the aforementioned tests confirmed that relevant differences have been shown according to wavelength of the incident beam.
These variation were absolutely confirmed also with the aging of the latent finger mark, from one day up to over six months.
Concerning the wavelengths, the range where a satisfactory imaging could be obtained are from the blue to the yellow. At the borders of the visible field the mentioned configuration did not permit to achieve satisfactory result.
The best performance has proved to be in the green/yellow interval. Further investigation is needed in the low wavelengths, in the ultraviolet region, as well as in the infrared region, by means of dedicated UV and IR sensitive CCDs.
3.3. Design of a new device for image spectroscopy.
During the extensive testing conducted at the different wavelength the power of the beam was the major concern. Whether the incident beam on the latent finger mark is not enough powerful, the visualisation of the print is not satisfactory.
Many different configurations has been widely tested, even if some of them have to be abandoned due to limitation of the power of the beam.
Fig. 68 and 69: Device for Image spectroscopy. On the right image, in light blue are represented the 1” diam. filter seat, coupled in the double revolver counter rotating.
This is the reason why we are planning for future works to use the device shown in figure 68 and 69.
Essentially it is constituted by a double revolver with nine 1” diameter filter seats each, hence it may host until sixteen different
filters, leaving vacant one seat each to allow the option of direct capturing of images without any filtering.
The objectives and the lenses merge the photographic standard and the output is standardized for CCD cameras.
Next future the device will be extensively tested, because it solves the problem of the light source. In fact, in this case if a suitable white light source is available, the wavelengths scattered by the latent fingerprint will be separated by the 1” diameter interferential filter of the device.
Because of the double revolver, the filters could be easily coupled together, giving 80 different range of wavelengths, plus the white light. Moreover, simply changing the set of filters, other eighty different ranges may be immediately available, for an exhaustive imaging from ultraviolet to infrared.
The device is extremely efficient and, above all, cost effective.
4. Polarized light imaging
One of the well renown sources of polarized light is the reflection from a dielectric. At a given angle, θB , for an incoming unpolarized wave, only
the component polarized, normal to the incident plane and, therefore, parallel to the surface of the dielettric will be reflected.
In order to determine the value of this angle, so called polarization angle or Brewster’s angle, from Snell’s Law:
n 1 sin θB = n 2 sin ( π/2 - θB ) (4.1)
n 1 sin θB = n 2 cos θB (4.2)
It follows that:
tan θB = n 2 / n 1 (4.3)
Fig. 70: Reflection and refraction in dielettric media at the polarization angle.
Assuming for the air a refracting index almost equal to 1, n 1 = 1, and
for the glass a refracting index may be assumed in the interval 1,5 – 1,8, after opportune calculations the following values may be considered:
Tab. 1: polarization angle and refracting index for the glass.
Thus, deeming to have a latent finger mark on a glass surface, when directing the incident beam at the polarization angle, the reflected light from the glass surface will be polarized. Only the friction ridges will scatter a diffuse light.
Whether a detector is with the acquiring device orthogonal to the reflected beam, it may collect the polarized plane wave reflected from the glass surface and the scattered light from the friction ridges.
n 2 θB 1,50 56,3° 1,55 57,2° 1,60 58,0° 1,65 58,8° 1,70 59,5° 1,75 60,3° 1,80 60,9°
Therefore, setting an analyzer (linear polarizer) on the reflection axis, in front of the acquiring device, and opportunely rotating it, almost all the transmitted plane polarized radiation coming from the surface will be cut by the analyzer. Naturally, the percentage of the polarized light will be cut according to the efficiency of the linear polarizer.
The imaging device will acquire only the back scattered light reflected from the fingerprint creases.
In such way, the ridge pattern shall appear white in a dark background.
4.1. Experimental setup
With the purpose of verifying the capability of such a device to enhance fingerprints on dielettric media (as glass slides) the following system was contemplated.
The experiment was carried on by means of the following light source:
o Incandescence lamp, 12 Volts, 50 Watt. First detector:
o Digital camera Sony DSC- F717 CMOS 5.0 Mpixel, zoom 10x;
o 52 mm polarizer with 52 mm lens 4 x; Second detector:
o Digital camera Nikon D70S with DX18-70 objective; o 62 mm polarizer.
o 2 donors;
o Multiple samples;
o Six month old fingerprints, both sebaceous and eccrine; o Depletion series.
Fig. 71: the beam has a slope of the polarization angle (from 56° to 61°) in order to reflect only the polarized plane light from the glass slide background. Only friction ridges back scatter the non polarized light captured by the CCDs.
The polarized light imaging system consider two different configurations, one each capturing device:
o First detector [56°-61°]/90°, means that the incident beam forms a polarization angle with the item surface and the first capture device is perpendicular to the latent mark (see figure 71);
o Second detector [56°-61°]/ 90°- [56°- 61°], means that the incident beam forms a polarization angle with the item surface and the second capture device is perpendicular to the reflection axis of the polarized beam (see figure 71);
o Both devices are equipped with a polarization filter, in order to be able to block (or attenuate – depends upon the filter efficiency) the polarized radiation.
4.2. Results and discussion
The trial conducted exhibited some result of value, even if some improvements to the system are still needed.
First of all, in order to reduce at minimum the reflection of non polarized light may be desirable the use of a light source highly focalized.
Secondly, in order to improve the overall quality of the image may be beneficial provide the capturing devices with macro objectives and customized polarizer.
In the end, the only partial concern may be the distortion of the prints acquired from the second device. In any case, knowing the distortion introduced by the lenses and the polarization angle, a correction of the acquired image via ad hoc software may be
5. Chem-imaging using Fourier Transform Infrared
Microscopy and the use of Synchrotron Light
Fingerprint Science has experienced an increasing interest in all research activities: all paths that allow the professionals to obtain new methods to obtain more results in the crime scene inspection and the culprit identification are tracked. Nonetheless image acquisition and processing plays a key role in the fingerprint analysis.
Forensic science already benefits from Synchrotron sources: synchrotron reflectance infrared spectromicroscopy has been used for the study of inks on paper and in forensic trace evidence analysis, glass and paints. Whilst conventional source infrared microspectroscopy has been used recently to analyze the composition of fingerprint, in order to distinguish between adults and children donors and to determine the contaminants in the sweat deposit, such as creams, drugs or explosives.
During the tests both a standard and a Synchrotron source were employed, claiming the latter is better suited to analyze smaller particles due to its brightness advantage over thermal sources.
FTIR spectromicroscopy has the capability to cover all the three level of details. At SISSI laboratories, Elettra Sincrotrone Trieste S.C.p.A, performances of FPA detector operated with conventional global source have been tested to image fingerprints allowing reconstructing good chemical images. To decrease computational weight, investigated region was restricted to some hundreds of wavenumbers (methyl and methylen
stretching region, phosphate region, AmideI region). Then, the investigated spectral range was extended to all the MidIR region accessible to FPA detector allowing to image smaller regions with higher chemical detail, then accessing both level 2 and level 3, at least when working with optimized IR substrates such as MirrIR slides.
Synchrotron light can be of great help in order to ensure the better signal to noise ratio to reach required resolution or even better, maybe revealing details not yet considered. As a matter of fact the brightness gain of Synchrotron light in comparison to conventional source is already appreciable at 50 micron spatial resolution, especially for the low wavenumber region (below 1200 cm-1) where the most interesting DNA-RNA features fall. Moreover, if the searched background surface is poorly reflecting, using a SR source could allow us to decrease the number of scans for each image point, increasing the speed of analysis. This means that we could detect large areas, according to real needs of investigation without losing spectral feature details.
A multi-technique approach has been adopted, based on conventional and synchrotron radiation techniques, to study latent fingerprints from the morphological and chemical point of view.
5.1. Experimental setup.
Several human fingerprints were deposited on lightly doped silicon wafers and poly-ethylene-terephthalate (PET).
The prints were left by male and female donors in depletion series, in order to better model a real situation.
The morphology as well as the chemical composition of the fingerprints have been characterized by Fourier transform infrared microspectroscopy (FT-IRMS).
We started with FT-IR microspectroscopy (FT-IRMS) to make a chemical imaging of sweat fingerprints deposited on silicon substrates, in order to characterize the chemical nature of the deposits. The FT-IRMS measurements have been carried out at the SISSI beamline of Elettra.
Infrared spectroscopy exploits the absorption of the light at specific frequencies, characteristic of a given chemical bond. Because of this, infrared spectroscopy detects, distinguishes and determines the relative amount of nucleic acids, fats (lipids), and proteins. The samples have been prepared by leaving fingerprints on silicon substrates following a precise pattern of depletion. Each donor has to leave his fingerprint for eight consecutive times creating an impoverishment scale.
FT-IRMS spectra have been collected in the Mid-IR regime from 4000 to 500 cm−1 using a Bruker Vertex 70 Fourier Transform interferometer equipped with a blackbody source. The infrared beam is sent to a Hyperion 3000 infrared microscope equipped with 15x cassegrain optics. Light is detected in transmission mode by a single-element Hg-Cd-Te detector, cooled with liquid nitrogen. Using knife edge apertures and motorized stage chemical maps have been collected by defining a matrix of points of 100×100 μm2. Morphologically characterized zones of
fingerprints are then chemically characterized assembling maps of the collected spectra.
Data are acquired by co-adding either 256 scans per point, or 512 scans per point if the sample is particularly poor, at a resolution of 16 cm−1.
Each picture element is not characterized by a unique intensity value, but by a full spectrum in the same frequency range mentioned above.
Fig. 72:. The FT-IRMS beam line acquires a spectrum for each pixel of the sample.
The data extracted must be analyzed to visualize the distribution maps of the compounds of interest. This analysis can be performed following an univariate or a multivariate approach. In the first case the chemical bonds of the compound under investigation are considered responsible of the system response, as could be the case for the 1655 cm−1 C=O stretch frequency of the primary amide (Amide I).
The map is then built either considering the signal intensity at a given wavelength or calculating the area under a specific spectral peak. The second case takes into account the whole spectral information contained in the data. Since we know the rough wavelength position of the peaks of interest we chose the univariate analysis and functional group mapping since more representative of the chemistry of the sample.
Fig. 73: (Left) fingerprint seen using visible light; (middle and right) maps of two different chemical compounds using FT-IRMS: proteins (middle) and carboxylates (right).
The collected information needs subsequent processing: once selected a window of wave numbers of interest (e.g. from 1700 cm−1 to 1500 cm−1), the spectrum needs to be corrected for its baseline contribution and vertical displacement.
Fig. 74: (Left) fingerprint seen using visible light; (right) maps of a chemical compound using FT-IRMS: lipids.
Each baseline corrected spectra is modelled as a sum of Gaussian functions with different centre frequencies: we can’t choose from the beginning the number of Gaussians to be fitted to the baseline corrected data, as some of the spectra show only one Gaussian and others have up to six contributions.
Once each spectrum has been processed, we are able to map the contribution of the chemical species of interest based on the Gaussian components identified by the previous procedure.
Fig. 75: (Left) fingerprint seen using visible light; (right) maps of a chemical compound using FT-IRMS: lipids.
5.2 Results and discussion.
Whilst being in its early stage, synchrotron radiation has been used to analyze fingerprints. This contribution showed that combining conventional and SR sources FT-IRMS, to describe a fingerprint in terms of its morphology and organic compounds
We identified the protein amide I and carboxylates contribution in the fingerprint deposits using FT-IRMS.
These techniques were tested as alternative imaging techniques to be used in order to both preserve the collected items and to allow DNA profiling in those cases where all the other classical techniques fail.
Moreover, the chance is given to broad the spectrum of information pertaining the trace, not only the morphology of the fingerprint, but also its organic compounds and possible contaminants content.
It is granted that the added bonus of giving both a complete morphological and chemical characterization of the fingerprint will give useful information to better understand the dynamics of the crime and to prosecute the criminal.
6. Conclusions.
The scope of the research was an exploration of new and different possibilities given to the forensic professionals to approach fingerprint development and enhancement from a different and wider perspective, which could take in account all the implications related to DNA profiling.
To reach this objective we decided to follow a path given by the applied research on electromagnetic radiation.
Even if latent finger mark are invisible to our personal detectors (the eyes), different detectors, designed for different purposes, may give additional information in a non destructive way.
First of all, we have experimentally verified the detrimental effect of cyanoacrylate fuming on subsequent DNA profiling, obtaining two immediate deliverables: 1. the suggestion to investigate only optical methods for fingerprint analysis whether there is the need of a complete DNA profiling; 2. the set up of a tested procedure to obtain some partial DNA profile from cyanoacrylate enhanced fingerprints of no value for identification purposes.
In particular, following the abovementioned procedure some high profile real cases have been approached, with impressive positive results in the 10% of the investigations.
Concerning image spectroscopy the wavelength of the visible spectrum suitable for fingerprint visualization were determined, allowing to detect latent finger marks on smooth non porous substrates, without altering the
surface. The outcomes of this study may orient also the professionals towards the selection of the wavelength during visual examinations. The basis for further research to develop a cost effective device for image spectroscopy for fingerprint application were extensively examined.
Moreover, optical properties of dielettric media were utilized to realize a device to capture fingerprint with a novel approach, without any interference with the deposited biological matter, which is very promising specially with high reflective surfaces.
In the end the chemical imaging of fingerprint has been exploited by means of FT infrared spectromicroscopy, both with conventional and with Synchrotron light sources. These techniques could provide not only an efficient imaging of latent fingerprint, nevertheless they may deliver information regarding contaminants and other substances of potential interest.
7. Future works.
The research opened lots of possible field of further developing.
First of all, it may be interesting widen the interval of wavelength studied by means of image spectroscopy, especially in the ultraviolet and in the infrared fields. Using adequate filter sets, the image spectroscopy device may adapt perfectly broad band light source to forensic sciences needs. Moreover, it may be remarkable developing a ready-to-use apparatus for fingerprint imaging on high reflective dielettric media, considering that these types of substrates are common in forensic examinations.
Finally, the use of Synchrotron light for forensic applications in fingerprint is an on going project which may deliver fundamental information on the possibility of fusing data originated from different kind of analytical techniques, based on the electromagnetic radiation, not only for tracking DNA but also other contaminants of potential forensic interests.