Weight status, fatness and body image perception of
North African immigrant women in Italy
Emanuela Gualdi-Russo
1, Natascia Rinaldo
1,*, Meriem Khyatti
2, Chérifa Lakhoua
3and Stefania Toselli
41Department of Biomedical Sciences and Surgical Specialties, University of Ferrara, Corso Ercole I d’Este 32, 44121 Ferrara, Italy:2Institut Pasteur du Maroc, Casablanca, Morocco:3Carthage University, CERP, Tunis, Tunisia: 4Department of Biomedical and Neuromotor Sciences, University of Bologna, Bologna, Italy
Submitted 13 January 2016: Final revision received 3 March 2016: Accepted 24 March 2016: First published online 28 April 2016
Abstract
Objective: To investigate the nutritional status of North African (NA) immigrant women in Italy, analysing their body size, adiposity and body image perception in comparison to Italian natives and NA residents.
Design: The study utilized a cross-sectional design. Anthropometric traits were directly measured and a few indices were computed as proxy measures of nutritional status and adiposity. Body image perception was assessed using silhouette drawings. ANCOVA, adjusted for age, was used to compare anthropometric traits among different groups of women and theχ2test to analyse differences in the prevalence of nutritional status.
Setting: Italy and North Africa (Tunisia, Morocco).
Subjects: A sample of 433 women aged 18–60 years old: NA immigrants (n 105); Italians (n 100); Tunisians (n 104); Moroccans (n 124).
Results: Overweight/obesity prevalence was very high in immigrants (79·8 %). Immigrants had the highest BMI value, the greatest hip circumference and mid upper-arm circumference. Their triceps skinfold thickness was significantly higher than that of Italians, but lower than that of NA residents.
Conclusions: NA immigrant women in Italy showed a higher incidence of overweight compared with Italians and NA residents. All groups showed a preference for a thinner body in comparison to their actual bodies and the immigrants are the most dissatisfied. Immigrants remain a high-risk group for obesity. Assessment of their body composition and health risk profile should be improved by using specific anthropometric measures that are easy to collect even in the case of large migrationflows.
Keywords Immigrants Anthropometry Nutritional status Body image perception North Africa
Obesity is one of the major causes of morbidity and mortality related to CVD, diabetes, cancer and many other chronic diseases(1). Obesity has increased steadily over the past two decades, mainly affecting low-income commu-nities and ethnic minorities(1,2).
Immigrants are at particular risk of weight gain and acculturation in the host country seems to be responsible for it(3). The probability of being overweight/obese rises with increasing time of residence in the host country since longer residence reduces the differences between immigrants and natives in lifestyle, social norms, health practices, and health and disease profiles(4).
In addition to general obesity, central obesity (evaluated as waist circumference (WC) or waist-to-hip ratio (WHR)) is a well-established indicator of increased cardiovascular risk(5). Although limited information is available for
immigrants, they seem to show a higher prevalence of generalized and central obesity than residents of their countries of origin(6,7). Furthermore, the prevalence of generalized and central obesity is higher in immigrants than in host country natives(7).
The perception of one’s body image has an important role in the aetiology of obesity since awareness of weight status is an important factor in weight-loss attempts(8). It is important to underline that differences in body size perception may depend on cultural and ethnic character-istics(9). Ethnic minorities often misperceive their over-weight/obesity(10). Hence these groups may not be motivated to improve their diet or increase physical activity, leading to a higher health risk. This trend, how-ever, may vary as a result of differences in ethnicity, gender, age at the time of migration and period of
Public Health Nutrition: 19(15), 2743–2751 doi:10.1017/S1368980016000872
residency in the new country(11). Some non-Western immigrants in Europe have conformed to the body size ideals of their host culture, which puts them at risk of body dissatisfaction(12,13).
The aim of the present study was to investigate differ-ences between North African (NA) immigrant women in Italy and both NA residents in their countries of origin and Italian natives in regard to: (i) the prevalence of obesity and fat distribution (generalized, central and peripheral fatness); and (ii) body image perception and preferences. The results could be used to identify the health risks of immigrants and the possible causes, in order to facilitate early preventive efforts.
Methods
Participants and study design
A survey of 463 women belonging to four sub-samples was carried out from June 2013 to January 2015 in Italy and North Africa: (i) NA immigrants; (ii) Italian natives; (iii) Moroccan residents; and (iv) Tunisian residents. The anthropometric survey and assessment of body perception for NA immigrants and Italian natives were performed in Bologna and Ferrara (Emilia-Romagna region, northern Italy) at public health clinics (gynaecological surgeries) or, for immigrants only, at community centres where they used to meet. The NA resident women were recruited at public health or social centres in Tunis (Tunisia) and Casablanca (Morocco) in accordance with local ethics regulations.
Ethnic origin was based on the participant’s country of birth and it was self-reported. Immigrant women born in NA countries aged 18–60 years and residing in Emilia-Romagna region (northern Italy) for at least 2 years were included in the study. They were all first-generation immigrants and their mean duration of living in Italy was 9·2 (SD 6·16) years. Pregnant women and those with
missing information on body image perception were excluded from the study. Of a sample of 117 immigrant women, 105 fulfilled the selection criteria. The final immigrant sub-sample included 85·7 % Moroccans, 7·6 % Tunisians and 6·7 % women from other countries (Algeria, Egypt).
In accordance with the adopted criteria (non-pregnant, within the age range, no missing information), a sub-sample of 100 native Italian women (out of 103) was selected as a control. Of the 138 Moroccan women living in Morocco and 105 Tunisian women living in Tunisia surveyed in January and February 2014, 124 Moroccans and 104 Tunisians met the selection criteria.
All participants gave informed consent and filled in a brief questionnaire (available in Italian and Arabic), including questions about demographic characteristics (age, marital status, number of pregnancies), migration status (years since immigration) and educational level.
Interviews were held face-to-face by female interviewers (in North Africa, ones of the same ethnicity as the inter-viewees). In Italy the presence of a cultural mediator was provided when necessary.
At the end of the selection process, the total sample consisted of 433 women (93 %).
Measurements
Anthropometric measurements
Height was measured to the nearest 0·1 cm using an anthropometer (GPM, Switzerland). Body weight was measured to the nearest 0·1 kg (light indoor clothing, without shoes) using a calibrated electronic scale. BMI was calculated as weight (in kilograms) divided by the square of height (in metres). This index was used to assess the weight status of each participant according to WHO cut-off points(14), classifying women as underweight, normal weight, overweight and obese. Triceps skinfold thickness (TSF) was measured to the nearest 0·1 cm on the left side(15)with a Lange calliper (Beta Technology Inc., USA). WC and hip circumference (HC) were measured to the nearest 0·1 cm with a non-stretchable tape: WC was measured between the lowest rib and the iliac crest and HC at the widest part of the hip. Mid upper-arm cir-cumference (MUAC) was measured to the nearest 0·1 cm with a non-stretchable tape on the left side at the level of the TSF. Additional information on the anthropometric measurements was reported previously(16). WHR was computed as WC/HC. The total upper-arm area (TUA), upper-arm muscle area (UMA), upper-arm fat area (UFA) and arm fat index (AFI) were computed from measure-ments of MUAC and TSF(17).
Body image perception
We used nine silhouette drawings of female figures of varying fatness(18) to assess both the perceived and desired body image.
The discrepancy score FID (feel minus ideal differ-ence)(19)was calculated by subtracting the ideal from the perceived silhouette: a score of zero indicates no discrepancy; a positive score that the perceivedfigure is bigger than the ideal; and a negative score that the perceivedfigure is thinner than the ideal. In the last two cases, the extent of discrepancy represents the degree of dissatisfaction in body image perception.
Improper perception of weight status was evaluated by the new index, FAI (feel status minus actual status inconsistency)(20). Extending the proposed method to the schematic figures with graduated increments between adjacent sizes developed by Thompson and Gray(18), we calculated the inconsistency score FAI by subtracting the conventional code assigned to the actual weight status of the participant (1= underweight; 2 = normal weight; 3= overweight; 4 = obese) from the code of her perceived figure (1 = figures 1 and 2; 2 = figures 3–5; 3 = figures 6
and 7; 4= figures 8 and 9). An FAI score of zero indicates no inconsistency in weight status perception; a positive score that weight status is overestimated; and a negative score that weight status is underestimated.
Statistical analysis
The normality of variables was checked by the Shapiro– Wilk W test. Triceps skinfold values were logarithmically transformed (log10-based) before statistical comparisons.
Descriptive statistics were computed for each sub-sample (mean, standard deviation, frequency). Continuous and categorical data were analysed using the t test or ANOVA and the χ2 test, respectively. Then comparisons between immigrant and native women and comparisons among immigrant women and women residing in Morocco and Tunisia were performed by ANCOVA, controlling for age. The Tukey post hoc test was used among ethnic groups.
Statistical analyses were performed using the statistical software package ‘Statistica’ for Windows, version 11·0 (StatSoft Italia srl, Padua, Italy). P< 0·05 was considered as statistically significant.
Results
Sample characteristics
The sociodemographic characteristics of the participants, duration of living in Italy and some elements of their biological profile (age at menarche, number of pregnan-cies and children, etc.) are reported in Table 1. The mean number of children and number of pregnancies of immi-grants in Italy were three times those of Italian natives and slightly higher than those of residents in Morocco. They were also three times higher than those of the Tunisian residents, who were however significantly younger. Nearly 90 % of the NA immigrant women were married and this value was much higher than in the other groups (with the lowest percentage in Italian natives). Their age at menarche was significantly higher than in all the other sub-samples. The educational level of immi-grants was relatively low compared with Italian natives: more than half of the immigrant women had attended primary or junior school or had no education at all, showing the highest rates of illiteracy also in comparison to the NA residents. Likewise, the NA immigrants had a much lower rate of university education than the Tunisian and Moroccan residents and especially the Italian natives. Approximately 80 % of immigrants were unemployed (or homemakers) compared with less than 10 % of unemployment in Italians (the lowest percentage).
Almost all of the NA immigrant women reported that they were non-smokers, while a third of the Italian sub-sample consisted of smokers. In the few smokers in the immigrant sub-sample, there was a later start to smoking
(mean onset age: 21·7 (SD5·12) years) and a lower average
consumption (mean cigarettes/d: 8·2 (SD6·09)) compared
with the Italian natives (mean onset age: 19·2 (SD 5·43)
years; mean cigarettes/d: 9·3 (SD 5·43)) and Tunisians
(mean onset age: 19·6 (SD6·94) years; mean cigarettes/d:
11·1 (SD10·0)).
The highest prevalence of overweight/obesity was observed in immigrants (79·8 %), followed by Moroccans (61·3 %) and Tunisians (50·5 %; Table 1). Italian women had the lowest prevalence (26·0 %). There was also a total lack of underweight participants among the immigrants, unlike in the other groups. The differences were statisti-cally significant.
Differences in anthropometric characteristics/ indices and in body image perception
The sub-sample characteristics and results of the ANCOVA are presented in Tables 2 and 3. Table 2 shows the anthropometric characteristics of NA immigrants and Italian natives based on measured data. NA immigrants differed significantly from Italians in all anthropometric traits and indices except height, showing higher general (BMI), central (WHR, WC) and peripheral (AFI) fatness. The immigrant women also had greater weight, BMI, HC and MUAC than the NA residents (Table 3). By contrast, there are no significant differences in weight and WHR between immigrants and NA residents. The immigrants had a more developed TUA, UMA and less percentage fat in the upper arm (AFI) than the NA residents. Their TSF was thinner compared with Moroccan women.
Tables 2 and 3 also show the results of the body image perception assessment. There were no significant differ-ences in perceivedfigure among immigrants and Italians or NA residents. The immigrants would prefer to be sig-nificantly leaner than the Moroccans. The immigrants had a significantly higher FID value than the Italian natives, meaning that they were more dissatisfied with their body image. The mean FAI values indicate a tendency to overestimation of weight in the Italians (positive value), underestimation in the immigrants and Tunisians (negative values) and a realistic perception in the Moroccans (zero value). All these differences among the sub-samples reached statistical significance.
Among overweight/obese participants (Table 4), the immigrants’ perceived and ideal figures had the lowest values, differing significantly from the Italian and NA resident women for idealfigure. A significantly lower FAI value was observed only for immigrants compared with Italians, meaning greater underestimation of weight in immigrants.
Discussion
There is a paucity of data on the nutritional status and body image perception of immigrant women in Europe, despite
Table 1 Sociodemographic and biological characteristics and nutritional status (prevalence of BMI categories) by ethnic group: women aged 18–60 years (Italians, n 100; North African (NA) immigrants, n 105; Tunisians, n 104; Moroccans, n 124), Italy and North Africa, June 2013–January 2015 Italians living in Italy NA immigrants in Italy Tunisians living in Tunisia Moroccans living in Morocco NA immigrants
v. Italians v. NA residentsNA immigrants
Mean SD Mean SD Mean SD Mean SD P value* P value†
Age (years) 33·1 12·0 36·3 7·8 28·7 11·5 39·5 13·1 0·023 <0·001
No. of children 0·6 1·0 1·9 1·3 0·6 1·1 1·6 2·0 <0·001 <0·001
No. of pregnancies 0·7 1·3 2·2 1·5 0·8 1·4 1·7 2·2 <0·001 <0·001
Age at menarche (years) 12·2 1·4 13·7 1·5 12·8 1·5 13·2 1·3 <0·001 <0·001
% % % % P value‡ P value‡
Educational level <0·001 <0·001
None 0·0 12·4 2·9 22·1
Primary school 1·0 14·3 11·5 12·3
Junior high school 7·0 28·6 12·5 10·6
High school 27·0 27·6 21·1 10·6 University 65·0 17·1 51·9 44·3 Marital status <0·001 <0·001 Single 69·0 6·7 66·3 41·0 Married 26·0 85·7 30·8 54·1 Divorced 4·0 7·6 1·9 3·3 Widow 1·0 0·0 1·0 1·6 Work status <0·001 <0·001 Paid employment 53·0 19·0 29·7 42·2 Unemployed/homemaker 9·0 78·1 13·9 33·6 Student 38·0 2·1 56·4 24·2 Smoker <0·001 <0·001 Yes 30·0 5·7 17·3 0·8 No 64·0 94·3 77·9 99·2 Ex 6·0 0·0 4·8 0·0 Weight status <0·001 <0·001 Underweight 5·0 0·0 6·9 4·8 Normal weight 69·0 20·2 42·6 33·9 Overweight 16·0 53·8 27·7 38·7 Obese 10·0 26·0 22·8 22·6
*Comparisons performed using thet test. †Comparisons performed using ANOVA. ‡Comparisons performed using the χ2test.
Table 2 Anthropometric traits and body image perception characteristics by ethnic group: women aged 18–60 years (Italians, n 100; North African (NA) immigrants,n 105), Italy, June 2013–January 2015
NA immigrants in Italy Italians living in Italy
Mean SD 95 % CI Mean SD 95 % CI F (ANCOVA) P value
Anthropometry Weight (kg) 73·7 13·8 71·0, 76·4 60·9 13·0 58·3, 63·5 41·96 <0·001 Height (cm) 160·9 6·0 158·8, 162·1 161·1 6·0 159·9, 162·3 0·13 0·719 BMI (kg/m2) 28·4 4·8 27·5, 29·4 23·4 4·5 22·5, 24·3 52·99 <0·001 WC (cm) 91·6 10·9 89·5, 93·8 75·7 11·3 73·4, 77·9 99·07 <0·001 HC (cm) 111·2 9·4 109·3, 113·0 100·8 10·5 98·7, 102·9 49·75 <0·001 WHR 0·82 0·06 0·81, 0·83 0·75 0·07 0·74, 0·76 62·57 <0·001 MUAC (cm) 31·8 4·2 31·0, 32·7 26·9 3·9 26·1, 27·7 67·21 <0·001 TSF (mm) 22·6 6·8 21·2, 23·9 16·8 4·8 15·8, 17·7 40·74 <0·001 TUA (cm2) 82·1 22·3 77·7, 86·5 58·7 18·2 55·1, 62·3 59·11 <0·001 UMA (cm2) 49·7 13·7 47·0, 52·4 37·9 10·7 35·8, 40·0 39·89 <0·001 UFA (cm2) 32·5 12·5 30·0, 35·0 20·8 8·9 19·1, 22·6 5·62 <0·001 AFI (%) 39·0 8·2 37·4, 40·6 34·9 6·2 33·6, 36·1 14·34 <0·001
Body image perception
Actual figure 5·9 2·1 5·5, 6·3 5·4 1·7 5·1, 5·8 1·89 0·171
Ideal figure 3·9 1·6 3·6, 4·2 4·1 1·1 3·8, 4·3 0·97 0·326
FID 1·99 2·31 1·54, 2·44 1·37 1·31 1·11, 1·63 4·39 0·037
FAI −0·28 2·61 −0·44, −0·12 0·24 0·57 0·13, 0·35 25·07 <0·001
WC, waist circumference; HC, hip circumference; WHR, waist-to-hip-ratio; MUAC, mid upper-arm circumference; TSF, triceps skinfold thickness; TUA, total upper-arm area; UMA, upper-arm muscle area; UFA, upper-arm fat area; AFI, arm fat index; FID, feel minus ideal difference; FAI, feel status minus actual status inconsistency.
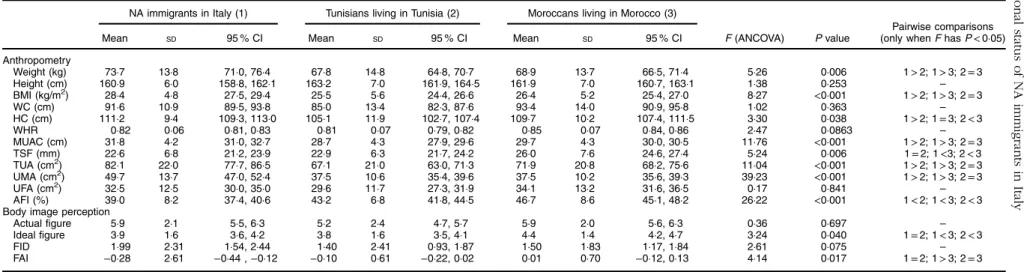
Table 3 Anthropometric traits and body image perception characteristics by ethnic group: women aged 18–60 years (North African (NA) immigrants, n 105; Tunisians, n 104; Moroccans, n 124), Italy and North Africa, June 2013–January 2015
NA immigrants in Italy (1) Tunisians living in Tunisia (2) Moroccans living in Morocco (3)
Pairwise comparisons
Mean SD 95 % CI Mean SD 95 % CI Mean SD 95 % CI F (ANCOVA) P value (only whenF has P < 0·05)
Anthropometry Weight (kg) 73·7 13·8 71·0, 76·4 67·8 14·8 64·8, 70·7 68·9 13·7 66·5, 71·4 5·26 0·006 1> 2; 1 > 3; 2 = 3 Height (cm) 160·9 6·0 158·8, 162·1 163·2 7·0 161·9, 164·5 161·9 7·0 160·7, 163·1 1·38 0·253 – BMI (kg/m2) 28·4 4·8 27·5, 29·4 25·5 5·6 24·4, 26·6 26·4 5·2 25·4, 27·0 8·27 <0·001 1> 2; 1 > 3; 2 = 3 WC (cm) 91·6 10·9 89·5, 93·8 85·0 13·4 82·3, 87·6 93·4 14·0 90·9, 95·8 1·02 0·363 – HC (cm) 111·2 9·4 109·3, 113·0 105·1 11·9 102·7, 107·4 109·7 10·2 107·4, 111·5 3·30 0·038 1> 2; 1 = 3; 2 < 3 WHR 0·82 0·06 0·81, 0·83 0·81 0·07 0·79, 0·82 0·85 0·07 0·84, 0·86 2·47 0·0863 – MUAC (cm) 31·8 4·2 31·0, 32·7 28·7 4·3 27·9, 29·6 29·7 4·3 30·0, 30·5 11·76 <0·001 1> 2; 1 > 3; 2 = 3 TSF (mm) 22·6 6·8 21·2, 23·9 22·9 6·3 21·7, 24·2 26·0 7·6 24·6, 27·4 5·24 0·006 1= 2; 1 <3; 2 < 3 TUA (cm2) 82·1 22·0 77·7, 86·5 67·1 21·0 63·0, 71·3 71·9 20·8 68·2, 75·6 11·04 <0·001 1> 2; 1 > 3; 2 = 3 UMA (cm2) 49·7 13·7 47·0, 52·4 37·5 10·6 35·4, 39·6 37·5 10·2 35·6, 39·3 39·23 <0·001 1> 2; 1 > 3; 2 = 3 UFA (cm2) 32·5 12·5 30·0, 35·0 29·6 11·7 27·3, 31·9 34·1 13·2 31·6, 36·5 0·17 0·841 – AFI (%) 39·0 8·2 37·4, 40·6 43·2 6·8 41·8, 44·5 46·7 8·6 45·1, 48·2 26·22 <0·001 1< 2; 1 < 3; 2 < 3 Body image perception
Actual figure 5·9 2·1 5·5, 6·3 5·2 2·4 4·7, 5·7 5·9 2·0 5·6, 6·3 0·36 0·697 –
Ideal figure 3·9 1·6 3·6, 4·2 3·8 1·6 3·5, 4·1 4·4 1·4 4·2, 4·7 3·24 0·040 1= 2; 1 < 3; 2 < 3
FID 1·99 2·31 1·54, 2·44 1·40 2·41 0·93, 1·87 1·50 1·83 1·17, 1·84 2·61 0·075 –
FAI −0·28 2·61 −0·44 , −0·12 −0·10 0·61 −0·22, 0·02 0·01 0·70 −0·12, 0·13 4·14 0·017 1= 2; 1 > 3; 2 = 3 WC, waist circumference; HC, hip circumference; WHR, waist-to-hip-ratio; MUAC, mid upper-arm circumference; TSF, triceps skinfold thickness; TUA, total upper-arm area; UMA, upper-arm muscle area; UFA, upper-arm fat area; AFI, arm fat index; FID, feel minus ideal difference; FAI, feel status minus actual status inconsistency.
Table 4 Body image perception characteristics of overweight/obese participants (BMI ≥ 25 kg/m2
) by ethnic group: women aged 18–60 years (Italians, n 100; North African (NA) immigrants, n 105; Tunisians, n 104; Moroccans, n 124), Italy and North Africa, June 2013–January 2015
NA immigrants in Italy Italians living in Italy Tunisians living in Tunisia Moroccans living in Morocco
NA immigrants
v. Italians v. NA residentsNA immigrants
Mean SD 95 % CI Mean SD 95 % CI Mean SD 95 % CI Mean SD 95 % CI P value P value
Actual figure 6·4 1·8 6·0, 6·8 7·1 1·3 6·6, 7·7 6·9 1·6 6·4, 7·3 6·9 1·4 6· 6, 7·2 0·473 0·177 Ideal figure 3·9 1·6 3·6, 4·3 4·8 1·4 4·2, 5·3 4·1 1·7 3·6, 4·6 4·6 1·4 4·3, 4·9 0·025 0·048 FID 2·47 2·22 1·99, 2·95 2·38 0·94 2·00, 2·76 2·80 2·16 2·19, 3·41 2·29 1·39 1·96, 2·61 0·888 0·330 FAI −0·35 0·85 −0·53, −0·16 −0·04 0·53 −0·25, 0·17 −0·20 0·64 −0·38, −0·02 −0·15 0·63 −0·29, −0·00 0·070 0·151 FID, feel minus ideal difference; FAI, feel status minus actual status inconsistency.
status of NA immigrants in Italy 2747
the high rate of migration to this continent. It was estimated that 3 874 726 non-EU citizens were regularly present in Italy on 1 January 2014. Morocco and Tunisia are among the top ten countries with immigrants in Italy(21), with females representing 44·1 % of the Moroccans and 36·5 % of the Tunisians. To our knowledge, the present study, part of a larger project on NA immigrants, is thefirst carried out in Italy to compare body size, anthropometric traits and body image perception of immigrant women from North Africa with those of women still living in North Africa and women native to the host country (Italy).
Non-Western immigrants tend to acquire the typical dietary habits and disease patterns of the host country(22). Poor health may be a consequence of genetic, biological, behavioural, environmental and socio-economic determi-nants(23). To prevent misinterpretation, the present study compared the immigrant sample not only with the local population, but also with those in their countries of origin. Over three-quarters of the immigrant women in the pre-sent study were above the BMI cut-off for overweight. This value is very similar to the prevalence of overweight/obesity recorded in Moroccan immigrant women in the Netherlands (78 %)(24). The groups compared in the present study were unevenly distributed in terms of education, working status and smoking habits: NA immigrant and NA resident women showed a lower level of education and higher unemploy-ment than Italian women; the percentage of smokers was low in immigrants and Moroccans, but increased in Tuni-sians and especially Italians. The mean age of the groups was also significantly different. The high prevalence of obesity in immigrants with respect to Italian natives could be due not only to the age difference but also their socio-economic conditions, diet and genetic characteristics, all of which should be investigated further.
After adjustment for age differences, the immigrant women had more generalized (BMI) and central fatness (WC, WHR) than Italian natives. Anthropometric mea-surements indicating abdominal adiposity, such as WC (positively correlated with visceral adipose tissue)(25), have been identified as predictors of CVD and diabetes risk(5,26,27). Based on a WHO report(14), this NA sub-sample was above the female cut-off for WC, suggesting a substantially increased risk of metabolic complications (cut-off for WC, >88 cm). However, its mean WHR was below the cut-off that indicates increased health risk for women(28), while its UMA was significantly higher than in Italians, with mean values above the 75th percentile of standards based on the Third National Health and Nutri-tion ExaminaNutri-tion Survey (NHANES III)(17). UFA and AFI were around the 50th percentile. Weight, BMI and MUAC were higher and AFI lower than in the other sub-samples of NA residents.
An original aspect of our study is the additional analysis of peripheral fatness (upper-arm measurements and indi-ces) to complete the assessment of weight status among immigrants: the muscle area of their upper arm was much
greater and the percentage of upper-arm fat much lower than would be expected from their BMI values. Hence the overweight/obesity status of these immigrants should not be based only on BMI: overweight may be only partially caused by increased adiposity, since an increase of the muscular component would contribute to the general weight increase in the immigrant sub-sample. However, caution is necessary in anthropometric estimates of muscle area among obese individuals since overestimation of muscle area seems to increase with the degree of adiposity(29). The prevalence of obesity is high in the immigrants and an anthropometric overestimation cannot be excluded, even though literature reports suggest that the overestimation is particularly evident in those whose TSF is above the 85th percentile (considering age and sex). In our study the sample of NA immigrant women fell well below this percentile (50th, according to Frisancho(17)). The greater muscularity of the immigrants with respect to the NA residents may be linked to a more active lifestyle in the host country with a probable involvement in hard manual work activities. Even while stating that they are unemployed, many of them are probably involved in irregular work(30). We can also speculate that the women who migrated from North Africa had a healthier body build than the women living in North Africa: thus the sample may be affected by the‘healthy migrant effect‘(4) caused by a positive selection bias due to rigorous pre-migration health checks(31). The same adverse condi-tions that led them to migrate must have had an influence on their growth, biological maturation and biological characteristics(32). The age at menarche, sig-nificantly higher in immigrants than in NA residents, shows an apparently different trend from literature data indicating precocious puberty in foreign children moving from developing countries to Europe(33), with a low median age at menarche in African girls(34)being a posi-tive response to improved environmental conditions(32). However, the NA immigrants in our study spent their childhood and adolescence in their country of origin, living in low-income, disadvantaged conditions with possible effects (slowdown) on their growth and development(35). Further analyses of body composition parameters and reported physical activity in the NA immigrant women are in progress. This may help to clarify the particular findings highlighted in the present study.
Although overweight/obesity of women is favourably considered in NA countries(36), there was no preference for a largefigure in either the NA immigrants or residents that we surveyed. Consistent with other studies(37), the NA immigrants expressed a clear preference for a ‘thin’ body image, in a similar manner to the Italian natives and NA residents. However, despite the tendency to underestimate their weight status, they had a greater dissatisfaction with body image perception than Italians. A different pattern was found among African-American
women, who were more satisfied with their body even if they weighed more than Caucasians(38). Unlike Moroccan immigrant women in the Netherlands(37), the NA immi-grants in Italy showed no shift in body size preferences with respect to the NA residents, but only a stronger desire to be thinner in accordance with Western ideals.
Our study also points out the effectiveness of simple measures of the upper arm in highlighting the particular body composition of the immigrants: the proposed mea-surements are even more valuable because they satisfy the need to analyse the distribution of fat/muscle without being disagreeable to these women, who are generally reluctant to undress for the anthropometric assessment. Our findings, confirming the contradictory indications provided by BMI(39)for the prediction of nutritional status and health risk, show that it is important to consider these indicators of fatness and muscularity to avoid mis-interpretation of weight status when there is particularly strong muscular development. Arm anthropometry has already proved to be a more sensitive indicator than BMI in the case of inadequate nourishment(40), so much so that MUAC and TSF have been proposed as acceptable‘gold standard’ measures of nutritional status(41). Their
inde-pendence of ethnicity is another important requirement for their application(42).
Therefore, although our study confirms the high pre-valence of overweight/obesity in NA immigrants in Italy, it highlights for thefirst time that the high weight values are not due to a simple increase in fatness.
Since the present research included first-generation immigrants only, systematic monitoring of weight status in second-generation immigrants is recommended. Indeed previous studies in the Netherlands demonstrated that overweight was highly prevalent among Moroccan women, but a lower prevalence was observed among second-generation immigrants(43).
The current study has several limitations and strengths. The significant difference in mean age among sub-samples was passed through the statistical analysis chosen. Reliable information was not available on the actual work performed by the immigrant women, because of the persistence in Italy of irregular work, nor on their income. As already men-tioned, information on the origin of the immigrants from an urban or rural environment was not collected during the interviews. We do not even know if the women examined in Casablanca and Tunis really belonged to these urban environments. A larger sample of immigrants representing different NA countries (Tunisia, at least) would have been optimal. A strength of the study is that all participants were directly measured by the same trained anthropometrists, thus avoiding misreports inherent in self-reported data(44).
Conclusion
To reduce health risks, public intervention programmes must be established to check the nutritional status of
immigrants by means of appropriate tools such as direct anthropometric measurements.
Only the assessment of fat distribution and body composition can assure a correct interpretation of the experimental data and evaluation of the health risks according to gender, age and ethnicity.
Therefore, in addition to the assessment of central fatness, we recommend the upper-arm measurements used in the current survey as immediate indicators of body composition. A combination of a few anthropometric measurements could increase the possibility of effective assessment of nutritional status and relative disease risk in order to identify immigrants at high metabolic risk who require interventions, especially in countries experiencing emergency immigration conditions.
The first-generation NA immigrant women preferred a thin physique (confirmed to a lesser extent in the NA residents). Their idealfigure was even thinner than that of the Italian natives. These results, if confirmed by other studies, will reassure us about the effectiveness of weight-control interventions in the case of excess adiposity. However, the high level of dissatisfaction of these women with their body image must be kept under control.
Acknowledgements
Acknowledgements: The authors thank the study partici-pants; staff from the Health Care Centre for foreign women and their children (AUSL, Bologna, Italy), Centro di Med-iazione and Centro Elefante Blu (Ferrara Municipality); and Anna Sapigni, Tullio Monini, Edgardo Canducci, Maria Giovanna Caccialupi, Greta Aristidi, Hassène Kassar, Hajer Ben Hamza and Yassine Zouheir for their contribution to the fieldwork. Financial support: This study was sup-ported by the EU 7th Framework Programme 2007–2013 (grant number 260715). The funder had no role in the design, analysis or writing of this article. Conflict of interest: None. Authorship: E.G.-R. and S.T. contributed to the conception and design of the study, the interpretation of the results and wrote the manuscript. N.R. contributed to data collection and conducted the analyses. M.K. and C.L. contributed to the data collection and reviewed/edi-ted the manuscript. All co-authors contribureviewed/edi-ted to inter-preting the results, and have read and approved thefinal version. Ethics of human subject participation: This study was conducted according to the guidelines laid down in the Declaration of Helsinki and all procedures involving human subjects were approved by the Independent Ethics Committee, Azienda Unità Sanitaria Locale (AUSL), Bologna, Italy. Written informed consent was obtained from all participants.
References
1. Ng N, Fleming T, Robinson M et al. (2014) Global, regional, and national prevalence of overweight and obesity in
children and adults during 1980–2013: a systematic analysis for the Global Burden of Disease Study 2013. Lancet 384, 766–781.
2. Candib LM (2007) Obesity and diabetes in vulnerable
populations: reflection on proximal and distal causes. Ann Fam Med 5, 547–556.
3. Fu H & Van Landingham MJ (2012) Disentangling the effects of migration, selection and acculturation on
weight and body fat distribution: results from a
natural experiment involving Vietnamese Americans,
returnees, and never-leavers. J Immigr Minor Health 14, 786–796.
4. Lauderdale DS & Rathouz PJ (2000) Body mass index in a US national sample of Asian Americans: effects of nativity, years since immigration and socioeconomic status. Int J Obes Relat Metab Disord 24, 1188–1194.
5. Huxley R, Mendis S, Zheleznyakov E et al. (2010) Body mass index, waist circumference and waist: hip ratio as predictors of cardiovascular risk– a review of the literature. Eur J Clin Nutr 64, 16–22.
6. Toselli S, Gualdi-Russo E, Boulos DNK et al. (2014)
Prevalence of overweight and obesity in adults
from North Africa. Eur J Public Health 24, Suppl. 1, 31–39.
7. Carlsson AC, Wändell P, Riserus U et al. (2014) Differences in anthropometric measures in immigrants and Swedish-born individuals: results from two community-based cohort studies. Prev Med 69, 151–156.
8. Acevedo P, López-Ejeda N, Alférez-García I et al. (2014) Body mass index through self-reported data and body image perception in Spanish adults attending dietary consultation. Nutrition 30, 679–684.
9. Dorsey RR, Eberhardt MS & Ogden CL (2009) Racial/ethnic differences in weight perception. Obesity (Silver Spring) 17, 790–795.
10. Duncan DT, Wolin KY, Sharoun-Lee M et al. (2011)
Does perception equal reality? Weight misperception in relation to weight-related attitudes and behaviors among overweight and obese US adults. Int J Behav Nutr Phys Act 8, 20.
11. Calzada PJ & Anderson-Worts P (2009) The obesity
epidemic: are minority individuals equally affected? Prim Care 36, 307–317.
12. Nicolaou M, Doak C, van Dam R et al. (2008) Body size preference and body weight perception among two migrant groups of non-Western origin. Public Health Nutr 11, 1332–1341.
13. Swami V, Mada R, Tovée MJ et al. (2012)
Weight discrepancy and body appreciation of Zimbabwean
women in Zimbabwe and Britain. Body Image 9,
559–562.
14. World Health Organization (2000) Obesity: Preventing and Managing the Global Epidemic. Report of a WHO Consultation. WHO Technical Report Series no. 894. Geneva: WHO.
15. Weiner JS & Lourie JA (1981) Practical Human Biology. London: Academic Press.
16. Rinaldo N & Gualdi-Russo E (2015) Anthropometric
techniques. Annali online della Didattica e della For-mazione Docente 10, 275–289.
17. Frisancho AR (2008) Anthropometric Standards: An
Interactive Nutritional Reference of Body Size and Body Composition for Children and Adults, 2nd ed. Ann Arbor, MI: University of Michigan Press.
18. Thompson MA & Gray JJ (1995) Development and valida-tion of a new body-image assessment scale. J Pers Assess 64, 258–269.
19. Mciza Z, Goedecke JH, Steyn NP et al. (2005)
Development and validation of instruments measuring body
image and body weight dissatisfaction in South
African mothers and their daughters. Public Health Nutr 8, 509–519.
20. Zaccagni L, Masotti S, Donati R et al. (2014) Body image and weight perceptions in relation to actual measurements by means of a new index and level of physical activity in Italian university students. J Transl Med 12, 42.
21. Istituto Nazionale di Statiistica (2014) Cittadini non comu-nitari regolarmente soggiornanti. http://www.istat.it/it/ archivio/129854 (accessed July 2015).
22. Lesser IA, Gasevic D & Lear SA (2014) The association between acculturation and dietary patterns of South Asian immigrants. PLoS One 18, e88495.
23. Gushulak B, Weekers J & Macpherson D (2009) Migrants and emerging public health issues in a globalized world: threats, risks and challenges, an evidence-based framework. Emerg Health Threats J 2, e10.
24. Dijkshoorn H, Nierkens V & Nicolaou M (2008) Risk groups for overweight and obesity among Turkish and Moroccan migrants in The Netherlands. Public Health 122, 625–630.
25. World Health Organization (2008) Waist Circumference
and Waist–Hip Ratio. Report of a WHO Expert
Consultation. Geneva: WHO.
26. Zimmet PZ & Alberti KG (2006) Introduction: Globalization
and the non‐communicable disease epidemic. Obesity
(Silver Spring) 14, 1–3.
27. Seidell JC (2010) Waist circumference and waist/hip ratio in relation to all‐cause mortality, cancer and sleep apnea. Eur J Clin Nutr 64, 35–41.
28. Lean MJ & Han TS (2002) Waist worries. Am J Clin Nutr 76, 699–700.
29. Forbes GB, Brown MR & Griffiths HJL (1988) Arm muscle plus bone area: anthropometry and CAT scan compared. Am J Clin Nutr 47, 929–931.
30. Eurispes (2012) L’Italia in nero. Rapporto sull’economia sommersa 2012. http://www.eurispes.eu/content/litalia-nero-0 (accessed July 2015).
31. Delavari M, Sønderlund AL, Swinburn B et al. (2013)
Acculturation and obesity among migrant populations in high income countries– a systematic review. BMC Public Health 13, 458.
32. Gualdi-Russo E, Toselli S, Masotti S et al. (2014) Health, growth and psychosocial adaptation of immigrant children. Eur J Public Health 24, Suppl. 1, 16–25.
33. Montero P, Bernis C, Loukid M et al. (1999) Characteristics of menstrual cycles in Moroccan girls: prevalence of dysfunctions and associated behaviours. Ann Hum Biol 26, 243–249.
34. Talma H, Schönbeck Y, van Dommelen P et al. (2013)
Trends in menarcheal age between 1955 and 2009 in The Netherlands. PLoS One 8, e60056.
35. Tanner JM (1981) Auxologia dal feto all’Uomo: la crescita fisica dal concepimento alla maturità. Torino: UTET. 36. Rguibi M & Belahsen R (2006) Body size preferences
and sociocultural influences on attitudes towards
obesity among Moroccan Sahraoui women. Body Image 3, 395–400.
37. Nicolaou M, Benjelloun S, Stronks K et al. (2012)
Influences on body weight of female Moroccan migrants in the Netherlands: a qualitative study. Health Place 18, 883–891.
38. Demarest JA (2000) Body image: gender, ethnic, and age differences. J Soc Psychol 140, 465–472.
39. Zaccagni L, Barbieri D & Gualdi-Russo E (2014) Body composition and physical activity in Italian university students. J Transl Med 12, 120.
40. Sala A, Rossi E, Antillon F et al. (2012) Nutritional status at diagnosis is related to clinical outcomes in children and adolescents with cancer: a perspective from Central America. Eur J Cancer 48, 243–252.
41. Sala A, Rossi E & Antillon F (2008) Nutritional status at diagnosis in children and adolescents with cancer in the Asociacion de Hemato-Oncologia Pediatrica de Centro America (AHOPCA) countries: preliminary results from Guatemala. Pediatr Blood Cancer 50, Suppl. 2, 499–501.
42. Frisancho AR (1981) New norms of upper limb fat and
muscle areas for assessment of nutritional status. Am J Clin Nutr 34, 2540–2545.
43. Hosper K, Nierkens V, Nicolaou M et al. (2006) Behavioural risk factors in two generations of non-Western migrants: do trends converge towards the host population? Eur J Epidemiol 22, 163–172.
44. Dijkshoorn H, Ujcic-Voortman JK, Viet L et al. (2011) Ethnic variation in validity of the estimated obesity prevalence using self-reported weight and height measurements. BMC Public Health 11, 408.