UNIVERSITA’ DEGLI STUDI DI CATANIA
DOTTORATO DI RICERCA
IN SCIENZE BIOCHIMICHE E BIOMOLECOLARI
XXIV CICLO
Site-directed mutagenesis and molecular modeling studies of
h5-HT
7(a)receptor reveal important residues
for binding and activation
Tesi di Dottorato
Dottorando:
Dr.ssa Agata Antonina Rita Impellizzeri
Tutor:
Chir.ma Prof.ssa Angela Messina Coordinatore:
Chiar.mo Prof. Angelo Vanella
2
TABLE OF CONTENTS
1 Introduction ... 4 1.1 Serotonin ... 4 1.1.1Classification of 5-HT receptors ... 5 1.1.2The 5-HT7 receptor ... 6 1.2 G-protein-coupled receptors... 81.2.1 Structure and classification of G protein coupled receptors ... 8
1.2.2 Heterotrimeric G proteins ... 10
1.3 GPCR signal transduction ... 13
1.3.1 Ligand binding ... 13
1.3.2 Model for receptor activation ... 14
1.3.3 Adenylyl cyclase ... 16
2 METHODS ... 18
2.1 Preliminary homology model approach ... 18
2.2 Site-directed mutagenesis... 19
2.3 Small-scale plasmid preparation ... 21
2.4 DNA sequencing ... 22
2.5 Transformation ... 22
2.6 Large-scale plasmid preparation ... 23
2.7 Quantification of DNA ... 24
2.8 Culturing QBI-HEK293 cell line ... 25
2.9 Splitting cells ... 25
2.10 Transfection... 26
2.11 Membrane preparation ... 26
2.12 Radioligand binding assay ... 27
3
2.14 Protein quantification ... 31
2.15 Calculations ... 31
2.16 SDS-PAGE and Western blotting analysis ... 32
2.16.1 Sample preparation... 33 2.16.2 Gel casting ... 33 2.16.3 Gel running ... 34 2.16.4 Western blotting ... 34 2.16.5 Immunodetection... 35 2.17 Molecular Dynamics ... 35 2.17.1 Forcefield ... 38 2.18 Molecular docking ... 40 3 Results ... 41
3.1 Preliminary structural model of 5-HT7(a) receptor ... 41
3.2 Site-directed mutagenesis analysis ... 44
3.3 Mutated plasmid preparation ... 46
3.4 Radioligand binding assay ... 48
3.5 Adenylyl cyclase assay ... 53
3.6 Western blotting analysis ... 60
3.7 Molecular Dynamics ... 61
3.8 Molecular Docking... 69
4 Discussion and conclusion ... 74
5 Reference list ... 78
6 appendix ... 83
6.1 Abbreviation ... 83
4
1 INTRODUCTION
1.1 Serotonin
Serotonin (5-hydroxytriptamine, 5-HT) is a physiologically active amine formed from the amino acid L-tryptophan by hydroxylation of the indole ring at C-5 and amino acid decarboxylation. 5-HT is degraded through oxidative deamination catalyzed by monoamine oxidase and subsequent oxidation to 5-hydroxyindoleacetic acid (5-HIAA).
Serotonin occurs in a wide variety of tissues throughout the body of mammals, but over 90% of 5-HT is found in enterochromaffin cells in the gastrointestinal tract, where it is synthesized and stored. 5-HT in the circulation is taken up through an active transport mechanism and stored in platelets. Serotonin is also synthesized and released by neurons in the CNS. The cell bodies of the all serotoninergic neurons in the CNS are localized in raphe nuclei. Serotoninergic peripheral neurons are found throughout various tissues and organs, including heart, kidney, lungs, spleen, gastrointestinal tractus and around blood vessels.
Serotonin is a neurotransmitter and a vasoactive hormone involved in the regulation of a wide variety of physiological and pathological processes. In the CNS serotoninergic neurons are involved in learning and memory, mood, sleep, temperature regulation, perception of pain and regulation of blood pressure and several psychiatric disorders, such as schizophrenia and depression (Hoyer et al. 2002).
Serotonin has diverse effects on the cardiovascular system, causing vasodilatation or vasoconstriction, depending on the vessel site and the condition of its intimal wall. In the heart it mediates cardioexcitation and cardiodepression (Kaumann and Levy 2006), this is probably mediated through excitation of sensory afferent vagal nerve endings. Platelets are regarded as the major source of circulating serotonin, which directly interacts with the cardiovascular system (Frishman and Grewall, 2000).
5
1.1.1Classification of 5-HT receptors
Serotonin receptors are grouped into seven classes (5-HT1-7) with 14 different
subtypes, each encoded by a separate gene, where RNA editing and alternative splicing give additional receptor complexity (Heidmann et al. 1997). All mammalian serotonin receptors are GPCRs(G protein-coupled receptor) with the exception of the ligand-gated ion channel 5-HT3 (Hoyer et al. 1994). The major signal transduction pathway for the
various subtypes are inhibition of Adenylyl Cyclase through Gi (5-HT1), stimulation of
phospholipase C (PLC) through Gq (5-HT2) and stimulation of Adenylyl Cyclase
through Gs (5-HT4, 5-HT6, 5-HT7). The 5-HT5 receptor remains poorly characterized
(Hoyer et al. 1994; Hoyer et al. 2002).
Family Type Mechanism Effect
5-HT1 Gi/Go-protein coupled. Decreasing cellular levels of cAMP. Inhibitory 5-HT2 Gq/G11-protein coupled. Increasing cellular levels of IP3 and DAG. Excitatory 5-HT3 Ligand-gated Na+ and K+cation channel. Depolarizing plasma membrane. Excitatory 5-HT4 Gs-protein
coupled. Increasing cellular levels of cAMP. Excitatory
5-HT5 Gi/Go-protein
coupled. Decreasing cellular levels of cAMP. Inhibitory 5-HT6 Gs-protein coupled. Increasing cellular levels of cAMP. Excitatory 5-HT7 Gs-protein coupled. Increasing cellular levels of cAMP. Excitatory
6
1.1.2The 5-HT7 receptor
The 5-HT7 receptor is the most recently described and cloned Gs coupled
receptor (Ruat et al. 1993). Three splice variants have been described in human (a, b and d) and in mouse (a, b and c) and four in rat (a, b, c and e) (Gellynck et al. 2008). Two isoforms are homologous in mouse, rat and human; they are designed 5-HT7(a) and
5-HT7(b) and are caused by two alternative donor sites located in tandem at the end of exon
II. The use of the second splice donor site in the isoform 5-HT7(b) results in a 5bp
insertion within the coding sequence, which introduces an in-frame stop codon. This shortens the C-terminal tail by 13 amino acids compared to the 5-HT7(a). The h5-HT7(d)
contains an extra 98bp exon cassette at the exonII-exonIII boundary (Gellynck et al. 2008; Heidmann et al. 1997). In rat, a similar, yet distinct, exon (named exon C) provides the 5-HT7(c) splice variant (fig.1). The different splice variants in each
organism differ only in the length and sequence of theirs carboxy-terminal tail and in the number of phosphorylation sites (Vanhoenacker et al. 2000).
7 The human isoforms 5-HT7(a) and 5-HT7(b) are present in brain, heart, kidney,
liver, lung, placenta, small intestine, skeletal muscle, colon, ovary, testis, prostate, spleen and thymus tissues without difference in their relative abundance, with exception of 5-HT7(b) receptors not being present in the colon, whereas 5-HT7(d) receptor was not
detected in kidney, skeletal muscle, prostate, thymus and it has lower expression in the other tissues than 5-HT7(a) and 5-HT7(b) receptors (Krobert et al. 2001). The 5-HT7(b)
receptor variant is the most expressed of all variants in the hypothalamus, and 5-HT7(d)
receptor is the least frequently expressed isoform and is mostly present in smooth muscle (Guthrie et al. 2005; Heidmann et al. 1997).
The presence of 5-HT7 receptors in the hypothalamus correlates with the
possible involvement in thermoregulation, circadian rhythm, memory, activation of rapid-eye-movement (REM) sleep, endocrine regulation and hippocampal signaling; a possible involvement in regulation of mood suggest that 5-HT7 is a potential target for
the treatment of depression (Hedlund and Sutcliffe 2004; Vanhoenacker et al. 2000; Gellynck et al. 2008).
All variants displayed identical G protein, Adenylyl Cyclase (AC) coupling and high affinity for 5-HT; this similar pharmacological profile and binding abilities show that the difference in the C-tail does not influence ligand binding or receptor activation (Krobert et al. 2001). Additionally they were constitutively active and displayed identical responses to constitutive AC activity. 5-HT7 receptors also behave as if they
are pre-associated with G protein in the absence of ligand (Krobert et al. 2006). An exception is the 5-HT7(d) receptor which displays a diminished 5-HT-stimulation of AC
activity, due to constitutive internalization in an agonist-independent way (Krobert et al. 2001).
Other effectors of 5-HT7 were demonstrated in 5-HT7(a). A recent study using
mouse and insect cells reported that the mouse 5-HT7(a) receptors couple to and activate
G12, resulting in transcriptional activation and regulation of cell morphology through
Rho family small GTPases (Kvachnina et al. 2005). 5-HT7 receptors increase Ca2+
(Norum et al. 2005; Baker et al. 1998) which also increase activity of Ca2+-responsive ACs (Baker et al. 1998).
Splice variants only differ in regulation of down-regulation, internalization and degradation: this is due to the difference in the C-tail which could mediate specific
8 interaction with trafficking pathway (Guthrie et al. 2005). The C-tail of 5-HT7 receptors
has been shown to specifically interact with intracellular proteins, such as the PLAC-24 protein, which might be involved in the transport of newly synthesized 5-HT7 receptor
towards the plasma membrane (De Martelaere et al. 2007a). In addiction it has been demonstrated that the C-terminus of mouse 5-HT7(a) receptor is dynamically regulated
by palmitoylation, increased by agonist stimulation. C-terminal cysteine residues 404 and 438/441represent main palmitoylation sites and mutations in these sites increase the agonist-independent Gs constitutive receptor activity (Kvachnina et al. 2009). 5-HT7 has
two YXXΦ motifs, 394YRSL and 402YRNI which could be implicated in regulating internalization (Paing et al. 2004; Paing et al. 2006), recruitment of GASP and SNX1 and thereby lysosomal targeting (Simonin et al. 2004; Moore et al. 2007). In addition, the 5-HT7 receptor has recently been proposed to exist as a homodimer (Teitler et al.
2010).
Most atypical and some typical antipsychotic drugs bind to 5-HT7 receptors and
have been suggested to be involved in treatment of pain, schizophrenia, anxiety, cognitive disturbances and inflammation (Gellynck et al. 2008). Numerous serotoninergic antagonists (methiothepin, clozapine, ketanserin, spiperone, metergoline, methylsergide and mesulergine) display different agonist properties at the 5-HT7receptor, varying among neutral antagonist, partial inverse agonist and weak partial
agonist (Roth et al. 1994; Krobert and Levy 2002). Clozapine is an atypical antipsychotic with high affinity for 5-HT7receptors which behaves as an inverse agonist
when measuring Adenylyl Cyclase activity (Roth et al. 1994). Additionally, 5-HT7
receptor can be pseudo-irreversibly blocked and thus inactivated by some ligands, such as methiothepin and the atypical antipsychotic risperidone (Smith et al. 2006; Krobert et al. 2006).
1.2 G-protein-coupled receptors
1.2.1 Structure and classification of G protein coupled receptors
G-protein-coupled receptors (GPCRs) represent a broad class of cell surface receptors that transduce the effects of diverse signal molecules, including photons, organic odorants, nucleotides, nucleosides, peptides, lipids and proteins to intracellular
9 signalling pathways through the activation of heterotrimeric G proteins. GPCRs represent the largest and most diverse superfamily of proteins in the whole human body with over 100 subfamilies, according to the sequence homology, ligand structure and receptor function (Ji et al. 1998).
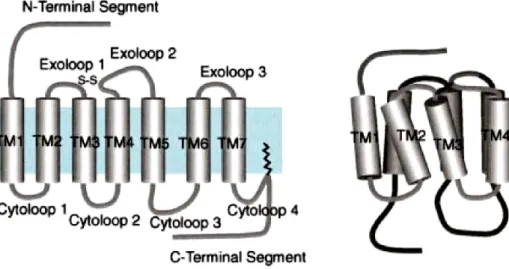
The general structure of all GPCRs show an extracellular N-terminal segment, seven transmembrane (TM) spanning-α-helical domain, which form the TM core, composed of 20-27 aminoacids, three extracellular loops (exoloop), three intracellular loop (citoloop) and an intracellular C-terminal segment. The C-tail can be palmitoylatedat a cysteine residue, thus forming a fourth-cytoloop anchored to the plasma membrane (fig.2) (Ji et al. 1998). The TM core is tightly packed by hydrogen bonds and salt bridges, leaving no room for a channel or tunnel structure (Ji et al. 1998). The TMs 1, 4, 7 are significantly more hydrophobic than TMs 2, 3, 5, 6, which contain ionic and neutral residues. TM 3 is believed to be the preliminary site for ligand binding whereas TMs 5 and 6 are the signal generation site.
Fig. 2: Schematic presentation of the general structure of GPCRs in a planar and three
10 Based on sequence similarity GPCRs are grouped in three main families, where each family shares more than 25 % of sequence identity in the transmembrane core region and highly conserved motifs. Family 1 is the most studied and includes family 1a with receptor for rhodopsin and receptors for small molecular weight ligand (such as adrenalin and serotonin), family 1b for peptide receptors which bind to the N-terminus and exterior parts of TMs, family 1c for glycoprotein receptors. Family 2 GPCRs have similar morphology to group 1c, but do not share any sequence homology. Their ligands include high molecular weight hormones, such as glucagon and calcitonin. Family 3 is related to the metabotropic and Ca2+ sensing receptors. Family 4 includes pheromone receptors and family 5 includes receptors involved in embryonic development (Bockaert and Pin 1999).
1.2.2 Heterotrimeric G proteins
G proteins are members of a superfamily of GTPases that play diverse roles in many aspects of cell regulation. There is a structural and functional diversity between the three polypeptide subunits (an α-subunit and a dimericβγ-subunit) components of a G protein heterotrimeric (Pierce et al. 2002).
All types of heterotrimeric G proteins are activated by a common mechanism (fig. 3). In the inactive state α-subunit is bound by GDP and receptor activation induces a conformation change which activates G proteins by releasing GDP from the nucleotide binding pocket of Gα. Release of GDP is followed by GTP binding, which
promotes the dissociation of the heterotrimer into an α-subunit and a dimeric βγ-subunit. Both these subunits regulate the activation and inhibition of different G-protein-coupled effectors. Gα subunit has an intrinsic GTPaseactivity which hydrolyses a phosphate
group of GTP and leaves GDP in the nucleotide binding pocket, which allows the re-association of the Gα-GDP with Gβγ for a new cycle (Milligan and Kostenis 2006; Pierce
11
Fig. 3: Mechanism of G protein. Conversion of G protein heterotrimeric inactive state with
GDP-Gα to active state GTP-Gα and dissociation to heterotrimeric in Gα and Gβγ which regulate
several effectors.
Heterotrimeric G proteins have been highly conserved during the evolution. There are four principal G protein families (Gs, Gi, Gq/11 and G12/13), each identified by
aminoacid similarities and α-subunits that preferentially regulate specific classes of effectors: Gs-family stimulates adenylyl cyclase (AC); Gi-family (Gαo-1-2, Gαi-1-3, GαoA-B,
Gαz, Gαg) is implicated in regulation of ion channel activity, inhibition of AC and
regulation of phospholipase C (PLC); Gq/11- family (Gα11,14-16 and Gαq)regulates the
activation of phosphoinositide-specific PLC (PLC-β); G12/13 family activates small GTP
binding G proteins (Rho, Rac and Cdc42) (Milligan and Kostenis 2006; Kvachnina et al. 2005).
The β and γ subunits are tightly associated through a coiled-coil structure and are functionally regarded as a monomer. Five distinct members of the Gβ-family (β1-5) and
twelve members of the Gγ-family (γ1-12) have been identified. The Gβγ subunits are
able to activate ion channel (K+ and Ca2+ channels), PLA2, PLC, AC, GPCR kinase (GRKs) and phosphoinositide kinase (PI3K) (Milligan and Kostenis 2006; Cabrera-Vera et al. 2003).
12 G proteins are regulated by regulators of G protein signalling (RGS) which lead to termination of the cycle by hydrolysis of GTP to GDP with following reassociation of the heterotrimer, while adenylyl cyclase enhances the GTPase activity of Gs-subunits
(fig. 4) (Pierce et al. 2002; Milligan and Kostenis 2006).
13
1.3 GPCR signal transduction 1.3.1 Ligand binding
In the interaction between ligand and receptor seems to be involved hydrogen bonds, ion pairs, and hydrophobic interactions. Ligands are characterized by both the affinity for the receptor (potency, capacity of ligand to bind the receptors), and the efficacy (the property of ligands to induce a receptor response) (Urban et al. 2007). Several distinct modes have been observed for high affinity ligand binding to GPCRs. These can be grouped according to the nature of the ligand and the receptor. Small molecules weight ligands, such as amines, nucleotides, eicosanoids and lipid moieties bind to the TM core (cavity formed by TM3 to TM6), generating a conformational change. Peptides bind to both the core and exoloops. Polypeptides bind to both exoloops and N-terminal segment, whereas glycoproteins bind exclusively to the N-terminal segment. Small neurotransmitters such as glutamate and GABA, as well as Ca2+ bind to the N-terminal segment.
Ligands, which bind to the N-terminal segment, activate the receptor when the N-terminal segment complex undergoes a conformational change, which leads to a secondary contact between the liganded N-terminal and the exoloops, thus generating a TM signal (Ji et al. 1998; Bockaert and Pin 1999).
GPCRs are activated by ligand by conformational change that alter the core formed by TM3 and TM6 to expose G protein binding site in cytoloop 2 and 3 (Gether and Kobilka 1998). Diverse ligand-binding lead, differently, receptors to G-protein activation, internalization, desensitization, oligomerization, phosphorilation and dissociation from other proteins (Kenakin 2002).
Costa and Herz demonstrated for the first time the existence of antagonists with negative intrinsinc activity, where ligands decrease the basal activity of the receptor system, activated in absence of agonists; this effect was defined as inverse agonism (Costa and Herz 1989). In addition, long exposition of inverse agonist is associated with upregulation of the receptor involved or can have effects on other receptor systems (Seifert and Wenzel-Seifert 2002). Some inverse agonists are used as drugs in the clinic
14 with important therapeutic action, like cimetidine, haloperidol, prazosin, timolol and clozapine(Strange 2002).
1.3.2 Model for receptor activation
In classical GPCR theories, agonist binding to the receptor is necessary to induce a change in receptor conformation which would activate the G protein (Strange 2002). Later discoveries demonstrated that many GPCRs display constitutive activity which is abolished by inverse agonists, which resulted in the proposal of the two-state model where receptors are in equilibrium between inactive R and active R* conformation, promoted by inverse agonists and agonist, respectively. GPCRs in R state are uncoupled from G protein and in R* state are coupled to and activates G protein, as shown in fig.5 (de Ligt et al. 2000). This isomerization can also occur independent of ligands, which results in constitutive GPCR activity (Seifert and Wenzel-Seifert 2002). Other models were presented to describe activation of GPCRs as the ternary complex model (De Lean et al. 1980; Samama et al. 1993), where the interaction between agonist, receptor and G-protein is considered, and the extended ternary complex model, which is a combination of the first two models (Galadrin et al. 2007). This extension has been termed the cubic ternary complex model (Weiss et al. 1996).
Receptor ligands can be classified in three categories: i) full agonists with high efficacy and high affinity for the R* state; ii) full inverse agonists which maximally stabilize the R state; iii) neutral antagonists which do not affect the equilibrium but block the effects of agonist and inverse agonists, or as partial agonists and partial inverse agonists which have lower efficacy than full agonists and full inverse agonists. The constitutive GPCR activity defines the basal G protein and effectors activity, which is increased by agonists and decreased by inverse agonists, while antagonists do not have any effect (Seifert and Wenzel-Seifert 2002).
15
Fig.5: (A) The two-state model GPCR activation assumes that GPCRs isomerizes from an
inactive (R) state to an active (R*) state. (B) Activity of effector systems R- to R* isomerization in GPCRs is referred to as constitutive activity. R* state promotes the exchange GDP/GTP at G proteins and regulate the activity of effectors.
16
1.3.3 Adenylyl cyclase
Adenylyl cyclase catalyses the conversion of ATP to cAMP, one of main second messenger of GPCR signalling (Tang and Hurley 1998). Many different types of agonist stimulated GPCRs are known to modulate the activity of the effector enzyme adenylyl cyclase through coupling to the G proteins Gs and Gi.
Nine transmembrane isoforms of AC have been cloned and characterized, but subsequently a soluble enzyme, sAC, which is not responsive to G-proteins or other regulators of the membrane-bound enzymes was discovered. They have different expression patterns in human and respond positively or negatively to distinct sets of regulatory inputs.
All ACs contain two large hydrophobic regions, predicted to consist of six transmembrane α-helices connected by relatively hydrophilic intra- and extracellular loops. The first six TMs are separated from the last six TMs by a quite long intracellular loop, giving ACs a constitution of two similarly organized halves. The two formed cytoplasmic domains share homology with each other and form a large catalytical domain. The presence of Mg2+ is necessary for the catalytic activity of AC (Hurley 1999). There is abundant kinetic evidence for a two-ion mechanism. One ion acts kinetically as free Mg2+, whereas the other complexes with ATP, providing the true substrate for AC (Simonds 1999).
All ACs, except isoform 9, are stimulated by forskolin and activated by GTP-bound Gαs (Hurley 1999; Tang and Hurley 1998).
Active G proteins bind and induce a conformational change in AC which allosterically stimulates it. The Gβγ-subunit stimulates synergistically with Gαs certain
types of AC, but inhibits others. Phosphorylation by protein kinases such as second messenger-regulated protein kinases PKA and PKC or Calmodulin kinase may lead to activation or inhibition of different isoforms of ACs (Simonds 1999; Hurley 1999).
The phosphodiesterase (PDE) family controls the intracellular level of cAMP by hydrolysis of cAMP into inactive AMP (Cooper 2003).
cAMP acts as a second messenger with key role in intracellular signalling pathways ofhormones, neurotransmitters, odorants and chemokines. The main effectors of cAMP are PKA and Epac. PKA is a tetramericholoenzyme, which phosphorylates
17 serine and threonine residues in the catalytic site of ACs, thereby reducing AC activity (Cooper 2003). Another target of cAMP is an exchange protein directly activated by cAMP (Epac), which functions as a guanine nucleotide exchange factor (GEF) for G proteins such as Rap,by catalyzing the exchange of GTP for GDP and consequently activation of G protein (Gloerich and Bos 2010).
18
2 METHODS
2.1 Preliminary homology model approach
The activity of a biological molecule, as every molecule, is strictly related to its structure. So far only four GPCR structures have been solved by high resolution X-ray crystallography: rhodopsin, β2Adrenergic-Receptor, β1Adrenergic-Receptor, A2A
adenosine receptor. It is more difficult obtaining X-ray structures of transmembrane proteins than globular ones; for this reason there is a lack of information about the structure of these receptors.
One method used to overcome the demand of structural information of proteins is homology modeling or comparative modeling, a knowledge-based method.
The homology modeling is based on the assumptions that the protein structure mainly depends on its primary structure and that among proteins the 3D structure is more conserved than proteins sequences. For this reason proteins that show different primary structure probably share common structural features and particularly the overall fold.
Thus it is possible to deduce a 3D structure of a protein from a template (or more). A template is a protein with known structure which has been selected for its high sequence similarity on respect to the target. The selection of the target is made by means of sequence alignment methods (pairwise sequence alignment, multi sequence alignment). The next step is the identification of conserved main chains from target-template comparison, then a pre-model is generated. A pre-model is a set of 3D coordinates of Cα in target main chains; these coordinates resemble the coordinates of
the template backbone in domains aligned with the target.
Variable regions, identified by sequence alignment, are often modeled considering that loops generally possess similar length and amino acid character; therefore these features are structured considering coordinates of several template models.During the model generation side chains and loops conformations are chosen without restricted criteria; thus an energy refinement is necessary. Also crystal structures must be relaxed in order to remove internal strains resulting from the crystal packing forces. The energy minimization step must be run on the overall model.
19 Structure refinement could be obtained by molecular dynamics simulations running in several environment conditions: vacuum, water, membrane. For biological systems it is recommended to simulate cytosolic and membrane environments in order to generate real life models.
Molecular mechanics or molecular dynamics are mostly used to predict theconformational changes in the ligand-target binding process. Semi-empirical, ab
initio quantum chemistry methods, or density functional theory are often used to
provide optimized parameters for the molecular mechanics calculations and also provide an estimate of the electronic properties (electrostatic potential, polarizability, etc.) of the drug candidate which will influence binding affinity.
Molecular mechanics methods may also be used to provide semi-quantitative prediction of the binding affinity and to identify specific aminoacids involved in the binding interactions with the receptor.
2.2 Site-directed mutagenesis
Mutations in the human 5-HT7(a) receptor are carried out using the
QuikChange® Site-Directed Mutagenesis kit (Stratagene) by a PfuTurbo DNA polymerase and a thermal temperature cycler. The procedure utilizes a dsDNA (pcDNA3.1/CMV) with an insert (coding region of the h5-HT7(a)) and two synthetic
oligonucleotide primers each one about 25-30 bp,with a melting temperature (Tm) of ≥ 78 °C. The desired mutation (single point) should be in the middle of the primer with ~ 10-15 bases of correct sequence on both sides.
The oligonucleotide primers, each complementary to opposite strands of the vector, are extended during thernal cycling. The sample reaction is prepared as below:
5 µl of 10X reaction buffer 5-50 ng of dsDNA template
125 ng of oligonucleotide primer Forward 125 ng of oligonucleotide primer Reverse 1 µl of dNTP mix
ddH2O to a final volume of 50 µl
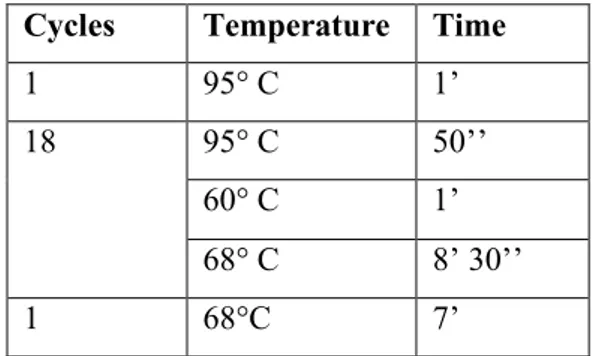
20 Each cycle reaction using the cycling parameters outlined in table 2
Cycles Temperature Time
1 95° C 1 minute
18 95° C 50 seconds
60° C 1 minute
68° C 1 minute/kb of plasmid length
1 68°C 7 minute
Table 2: cycling parameters
Following temperature cycling, the reaction mix is placed on ice for 2 minutes to cool the reaction to ≤ 37° C. Afterwards the reaction product is treated with 1µl ofDpnI(10U/µl).The reaction mixture is gently mixed by pipetting the solution up and down several times. The reaction mixture is spinned down in a microcentrifuge for 1 minute and immediatelyis incubated at 37° C for 1 hour to digest the parental dsDNA template and to select the mutated dsDNA.
Before to proceed with the transformation protocol, the XL1-Blue supercompetent cells are thawed on ice. 1 µl of the DpnI-treated DNA is transferred in 50 µl of cells, the transformation reaction is gently mixed and is incubated on ice for 30 minutes. Afterwards the reaction is incubate for 45 seconds at 42° C and then the reaction is placed on ice for 2 minutes. 500 µl of LB medium is added to the reaction solution and it is incubated at 37° C for 1 hour with shaking at 225-250 rpm.
At the end the appropriate volume of transformation solution is plated on agar plate containing the specific antibiotic for the plasmid vector, and incubated at 37° C for > 16 hours.
21
2.3 Small-scale plasmid preparation
For small-scale isolation and purification of plasmids from transformed cells the Wizard® Plus SV Miniprep kit (Promega) is used.
2-10 ml of overnight bacterial culture isspinned down for 5 minutes at 14000 rpm in a tabletop centrifuge. The supernatant is discarded and added 250 µl of Cell Resuspension Solution (50 mMTris-HCl, pH 7.5, 10 mM EDTA, 100 µg/ml RNase A) to resuspend the cell pellet by vortexing.
250 µl of Cell Lysis Solution (0.2 M NaOH, 1 % SDS) is added and the solution is mixed by inverting the tubes 4 times. 10 µl of Alkaline Protease Solution is added to the lysate and mixed by inverting again. The solution is incubated for 5 minutes at room temperature. The alkaline protease inactivates endonucleases and other proteins released during the lysis of the bacterial cells that can adversely affect the quality of the isolated DNA.
350 µl of Neutralization Solution (4.09 M guanidine hydrochloride, 0.759 M potassium acetate, 2.12 M glacial acetic acid) is added to the reaction mixture and is mixed by inverting the tubes 4 times. The bacterial lysate is centrifuged at 14000 rpm for 10 minutes at room temperature.
The cleared lysate is transferred into the Spin Column inserted into a 2 ml collection tube by decanting. The supernatant is centrifuged at 14000 rpm for 1 minute at room temperature and the flowthrough is discarded from the collection tube. 750 µl of Column Wash Solution (60 % etanol v/v, 162.8 mM potassium acetate, 27.1 mMTris-HCl pH 7.5) is added to the column. The column is centrifugated for 1 minute at 14000 rpm and the flowthrough is discarded. The wash procedure is repeated with 250 µl of Column Wash Solution and the column is centrifugated again for 2 minutes at 14000 rpm at room temperature. The column is transferred to a sterile 1.5 ml tube and the DNA is eluted by adding 100 µl of Nuclease-Free Water to the Spin Column and is centrifugated for 1 minute at 14000 rpm at room temperature. The purified plasmid DNA is stored at -20° C.
22
2.4 DNA sequencing
The purified mutated plasmid DNA is analysed and confirmed by DNA sequencing. They are sequenced by ABI-lab using ABI 3730 DNA analyzershigh-throughput capillary electrophoresis machines.The reaction mix is performed using around 0.5-1.0 µg of DNA sample, 1 µl (10 µM) for each Forward and Reverse primers, 4.0 µl of Terminator ready Reaction Mix. The sequence reaction, using fluorescently labelled nucleotides in combination with a cycling PCR protocol. The cycle sequencing reaction were cycled 25 times for 10 seconds at 96° C, followed by 5 seconds at 50° C and 4 minutes at 60° C. The ABI BigDye Terminator sequencing buffer and v3.1 Cycle Sequencing kit are used. By indicating the optimal temperature for the primer in the delivery form, the annealing temperature will adjust accordingly, provided it is above 40° C and below 60° C.the reaction mix is spinned down in a microcentrifuge and prepared for the purifying procedure through capillary electrophoresis.
2.5 Transformation
After sequencing test the mutated plasmid are transformated in TOP 10 competent E.coli cells. They are highly sensitive to changes in temperature or mechanical lysis caused by pipetting. The cells are thawed on ice and immediately the transformation protocol should start.
1 µl of mutated plasmid DNA is added to 25 µl of competent TOP 10 cells and gently mixed together. The transformation mix is incubated on ice for 15 minutes. Afterwards the heat shock is performed and the cells are put at 42° C for 30 seconds without shaking and then are incubated immediately on ice for 2 minutes. 125 µl of room temperature SOC medium (20g/L tryptone, 5g/L yeast extract, 0.9 % NaCl, 10mM MgCl2, 10 mM MgSO4, 2.5 mM glucose) is added to the reaction mix and gently
mixed. The reaction mix is incubated in a horizontal shaker at 37° C, 200 rpm for 30 minutes. 50- 100 µl of the transformation mixture is spreaded onto a LB plate (LB medium: 10 g/L tryptone, 10 g/L NaCl, 5 g/L yeast extract, pH 7, 20 g/L
Bacto-23 agar for LB plates) containing 80 µg/ml ampicillin. The cells are incubated overnight in a horizontal shaker at 37° C.
To use the plasmid containing the desired mutation in other procedure, 4 colonies are picked and grown in 8 ml of LB medium for large-scale plasmid preparation.
2.6 Large-scale plasmid preparation
To produce larger amounts of purified plasmid DNA, large-scale plasmid preparation is set up using the Qiagen Plasmid maxi Kit (QIAGEN). The bacterial cells are lysed with a solution containing NaOH and SDS; upon neutralization and increasing the salt concentration, chromosomal DNA, cell membrane components and denaturated proteins will precipitate, while plasmid DNA remains in solution. An alkaline protease is addedto inactivate endonucleases and to non-specifically degrade proteins. RNase A is added at the beginning of the procedure to digest the liberated RNA as to minimise RNA contamination. The lysate is run through an anion-exchange column consisting in silica beads with high density of diethylaminoethyl (DEAE) groups, these are positively charged in acidic environment and will interact with negatively charged molecules, such as phosphate groups on DNA and RNA. Washing with a medium-salt buffer will remove contaminants such as RNA and protein. Plasmid mutated DNA is eluted using a high-salt buffer, then it is desalted and concentrated by isopropanol precipitation.
2 ml of a starter cells culture are added to 500 ml LB medium containing 80 µg/ml of ampicillin and the culture is incubated at 37° C for 12-16 hours in a shaker incubator. The bacterial cells are centrifugated at 6000 g for 15 minutes at 4° C. All traces of supernatant are totally removed and the bacterial pellet is resuspended in 10 ml of buffer P1 (resuspension buffer: 50 mMTris-HCl, pH 8.0, 10 mM EDTA, 100 µg/ml RNase A). 10 ml of buffer P2 are added (lysis buffer: 200 mMNaOH, 1 % SDS w/v) and gently mixed by inverting the tube 4-5 times. The reaction mixture is incubated for 5 minutes at room temperature. Afterwards 10 ml of buffer P3 are added (neutralization buffer: 3.0 M potassium acetate, pH 5.5) and immediately mixed by inverting for 4-5 times. The lysate is poured into the capped barrel of QIA filter Cartridge and is incubated for 10 minutes at room temperature. A HiSpeed Maxi tip is equilibrated by applying 10 ml of buffer QBT (equilibration buffer: 750mM NaCl, 50 mM MOPS, pH
24 7.0, 15 % isopropanol, 0.15 % Triton®-X-100). Gently the plunger is inserted the QIA filter and the cell lysate filtered into the HiSpeed Maxi tip. The cleared lysate enters the resin by gravity flow, then the HiSpeed Maxi tip is washed with 60 ml buffer QC (wash buffer: 1.0 M NaCl, 50 mM MOPS ph 7.0, 1.5 mM isopropanol). The DNA is eluted with 15 ml of buffer QE (elution buffer: 1.25 M NaCl, 50 mMTris-HCl pH 8.5, 15 % isopropanol) and is precipitated by adding 10.5 ml of isopropanol. The solution is mixed and incubated at room temperature for 5 minutes. The eluate/isopropanol solution is filtered through a QIAprecipitator Maxi Module (membrane filter) attached to a 30 ml syringe and the flowthrough is discarded. The DNA is washed with 2 ml of 70 % of ethanol, the membrane filter is dryed by pressing air through the QIAprecipitator. This step is repeated 3 times. The QIAprecipitator is attached to a 5 ml syringe and the DNA is eluted into a 1.5 ml sterile tube by adding 1 ml of TE buffer (10mM Tris-HCl pH 8.0, 1 mM EDTA) and stored at -20° C.
2.7 Quantification of DNA
Quantification of DNA is performed by UV analysis. Nucleotide spectra are complex to analyse quantitatively because they have many non bonded electrons with indistinct transitions giving a multitude of absorption between 200 nm and 300 nm. All nucleotides however have a λ max near 260 nm which is fairly specific for the purine and pyrimidine bases. This wavelength can be used to estimate the nucleic acid concentration in a sample. DNA also absorbs light at 230 and 280 nm, but to a lesser extent. Pure DNA samples should have the following absorption ratios:
OD260/OD280 ratio ~ 1.8-1.9
OD260/OD230 ratio ~ 1.8-2.2
Asp, Glu, Asn, Gln and His side chains have adsorption in the region 190-230 nm, whereas aromatic amino acids, Phe, Tyr and Trp, absorb UV-light around 280 nm. Thus high absorbance at 230 nm indicates contamination by urea, phenol or proteins, whereas high absorbance at 280 nm denotes mainly protein contamination. Using OD260 to
estimate concentration is only valid if the ratio are within their limits, otherwise the solution is not pure nucleic acid and the OD260 may include absorbance by other
molecules. If the DNA sample follows these criteria, the total amount of DNA can be calculated using the following formula:
25 DNA (µg/µl)= OD260 X dilution/20
The spectrophotometer used to measure the OD’s DNA concentration (Nanodrop 2000 UV/Visible aspectrophotometer, Thermo scientific) doesn’t need instrumental adjustments but makes a simple self calibration before use. 2 µl of buffer TE are pipetted out for the blanks measurement and then 2 µl of samples are used to measure the concentration directly on the pedestal. When the measurement is complete, the surfaces are simply wiped before going on to the next sample. A specific Nanodrop2000 software shows the accurate concentration of the DNA samples.
2.8 Culturing QBI-HEK293 cell line
The obtained mutants are expressed in QBI-HEK293 cells. This cell line is an immortalized line of primary human embryonic kidney cells, subclone of HEK293 cells and strongly adheres to plastic dishes, performing extremely well in plaque assay and trasfection experiments. The human QBI-HEK293 cells are a good model system to study GPCRs, they contain human proteins, they grow fast and don’t express any 5-HT receptor subtypes in their membrane. The QBI-HEK293 cells are grown in Dulbecco’s modified Eagle’s medium (DMEM; GIBCO) with 10% fetal bovine serum (BioWhittaker) and penicillin (100U/ml) and streptomycin (100µg/ml). Cells are transiently transfected with wild-type and mutated plasmid DNA (pcDNA3.1(-) containing h5-HT7(a)) using a serum-free medium (ULTRAculture, BioWhittaker;
because serum contains high concentration of serotonin) supplemented with L-glutamine (4mM) and penicillin (100U/ml) and streptomycin (100µg/ml). The transfection mix contains also LIPOFECTAMINETM – LTX reagent (InvitrogenTM) and 7,5 µg DNA per 150 mm dish.
2.9 Splitting cells
The cells are split by trypsin-EDTA treatment whenever the culture dishes became 80-90% confluent. The DMEM medium is sucked out and the cells are washed once with 10 ml of sterile 0.9 % NaCl solution. Then 1 ml of trypsin-EDTA is added to cover the cells and incubate for 2 minutes at 37° C in a CO2 incubator, afterwards 10 ml
26 of DMEM medium are added and the cells are transferred to a 15 ml sterile tube and are centrifugated at 2100 rpm for 5 minutes. The DMEM medium and the trypsin-EDTA are removed, the cells are resuspended with new medium considering a specific dilution and are kept at 37° C in a CO2 incubator.
2.10 Transfection
Transfection is the process of deliberately introducing nucleic acids into eukaryotic cells. For eukaryotic cells, transfection is better achieved using cationic lipids (or mixtures), because the cells are more sensitive. In this study the Lypofectamine LTX (Invitrogen) reagent is used.
In a 150 mm tissue culture plate the cells are 60-70 % confluent in 10 ml of DMEM medium with 10 % FBS (fetal bovine serum), 100 U/ml penicillin and streptomycin (100µg/ml), while two specific solutions are performed:
solution A: 37,5 µl of Lipofectamina LTX (Invitrogen) + 375 µl of OptiMEM® solution B: 7,5 µg of DNA + 375 µl of OptiMEM®
The two solution are gently mixed together and are incubated at room temperature for 30 minutes. During this time the cells are washed with 15 ml of NaCl or OptiMEM® and 12.5 ml of Ultraculture (serum free) containing 4 mM glutamine and 100 U/ml penicillin and 100µg/ml streptomycin are added to each plate. After 30 minutes the mixed solution A+B is added onto the washed cells, mixed gently by swirling the plate around. Then the cells are incubated overnight at 37° C/ 5% CO2.
After 24 hours the medium (Ultraculture-Gln-PS, BioWhittaker) is replaced and incubated again overnight. After 48 hours the membrane preparation are performed.
2.11 Membrane preparation
Membrane preparation from QBI-HEK293 cells are performed 48 hours after transfection. The cells should be ~ 70-80 % confluent to proceed with the membrane preparation procedure.
The transfection medium is sucked out and the cells are washed twice with 5 ml of ice cold HBBS (Hanks Balanced Salt Solution), then other 10 ml of HBBS are added
27 to the cells. Afterwards the cells are scraped with a plastic scraper and the solution containing the cells is transferred in a 15 ml tube. The cells are collected by centrifugation at 2100 rpm for 5 minutes at 4° C. The supernatant is discarded and the pellet is resuspended with 1 ml of STE buffer (27 % sucrose (w/w), 50 mMTris-HCl pH 7.5, 5 mM EDTA), then the cells are homogenized with Ultra-turrax T8 (IKA Labortechnik) for 30 seconds cooled in ice-water and afterwards are centrifugated for 20 minutes at 14000 rpm at 4° C. The supernatant is discarded and the pellet is resuspended in 1 ml of TE buffer (50mM Tris-HCl pH 7.5, 1 mM EDTA) and the membranes are homogenized again by 10 strokes with pestle B (tight fitting) using ice cold Douce glass-glass homogenizer. 500 µl of membranes are aliquoted in each tube and are stored at - 80° C.
2.12 Radioligand binding assay
Receptor expression densities and binding affinities of different ligands in QBI-HEK293 cell line transiently expressing the 5-HT7 receptor splice variants are
determined by radioligandi binding assays.
Binding assays are performed in 96 well, round bottom microtiter plates with a total reaction volume of 100 µl, by performing saturation binding assay, receptor expression densities (Bmax) and affinities of different ligands (Kd) can be estimated in
the same assay. Scatchard analysis is performed with 5-HT7(a) receptor ligands [3H]5-CT
(5-Carboxamidotryptamine) and [3H]SB269970 in the presence (non specific binding) or absence (total binding) of excess 5-HT. Specific binding is defined as the difference between total binding and non-specific binding.
G-protein coupled receptor may exist in different conformations, such as low and high affinity states. In the presence of GTP most receptors will exist in the low affinity state. GTP is included to avoid bias due to unpredictable ratios between the two affinity states.
An assay mix is performed with 100 µM of GTP and binding buffer 10X (500
mM Tris-HCl pH 7.5, 10mM EDTA, 50mM EGTA, 20mM MgCl2, 10mM ascorbic acid,
1 % BSA) in dH2O, 30 µl of this mixture is added to each well. Each radioligand stock
solution is diluted 1:2 and are made 8 serial dilutions and 20 µl of each radioligandi dilution are added to one row of wells. This is repeated for each dilution, starting with
28 the lowest concentration in the top row of the 96-well plate. For the determination of accurate concentration of the radioligands, are prepared for each dilution 5 scintillation vials (Polyethylene vials, Packard BioScience) containing 20 µl of radioligand and 3 ml of scintillation fluid (Ultima Gold XR, Packard), the samples are counted in the Wallac WinspectralTM 1414 Liquid scintillation Counter, Perkin Elmer. 30 µl of cold 5-HT and 30 µl of H2O are added to each well to determine total and non-specific binding. The 20
µl of membrane preparation are added to each well and the plate is mixed by vortexing and incubated at room temperature for 1 hour. Afterwards the membranes are harvested onto Whatmann GF-2 filter (Packard) pre-soaked in 0.3 % of polyethylenemine, with a Packard Cell Harvester (Packard). The membranes are washed 4-6 times with cold washing buffer (50 mMTris-HCl pH 7.0, 2 mM MgCl2). The filters are dried at 37° C
for 45 minutes and then 20 µl of MicroScint scintillation fluid (Packard) are added to each well. The filter plates are counted later in a Packard TopCount Scintillation Counter (Packard).
2.13 Adenylyl cyclase assay
The adenylyl cyclase activity is measured by determining conversion of
[α-32P]ATP to [32P]cAMP in membrane preparations. G
s-coupled receptors regulate
adenylyl cyclase activity, stimulating this enzyme. Agonist-bound receptors catalyse the release of GDP bound to the α-subunits of the heterotrimeric membrane-bound G proteins. This is followed by GTP binding and the G protein dissociation into a βγ subunit and an active α-subunit (Gα). There are two classes of α-subunit, Gαs and Gαi,
which regulate adenylyl cyclase activity. Gαs stimulates and Gαi inhibits adenylyl
cyclase.
Adenylyl cyclase activity is measured in a final volume of 50 µl, containing 10 µl of crude membrane preparations, 20 µl of additives and 20 µl of an assay mix composed of: Incubation mixture (IM) solution (Tris-HCl, EDTA, cAMP and [3H]cAMP), ATP, [32P]ATP, GTP, MgCl2, ATP-regenerating system (RS solution),
IBMX solution (3-isobutyl-1-methylxantine) and dH2O. ATP is in the concentration
range 0.1 mM with specific activity at about 200 cpm/pmol (calculated for each assay). EDTA is included to permit linear cAMP accumulation over extended periods of time. GTP is added as substrate for activation of the G protein to obtain hormonal stimulation
29 of adenylyl cyclase. The main substrate for the enzyme is Mg-ATP rather than ATP, so an excess of Mg2+ (4 mM) over EDTA and ATP is needed to obtain enzyme activity. Terminal phosphatases, such as ATPases, present in the membrane preparation may alter the level of substrate available for the enzyme. This is prevented by an AP-regenerating system (RS) containing myokinase (40 U/ml), creatin phosphokinase (0.2 mg/ml) and creatinephosphotase (20 mM).
AMP + ATP myokinase 2 x ADP
Creatin-PO4 + ADP creatin phosphokinase ATP + creatine
Membrane preparations also contain phosphodiesterase activity. To prevent breakdown of the generated [32P]cAMP formed and [3H]cAMP, the phosphodiesterase inhibitor IBMX (1 mM) together with unlabeled cAMP (1mM) is included in the assay mix. The reaction products are separated by sequential chromatography on Dowex 50 cation exchanger and on neutral aluminium oxide (Alumina) columns as originally described by Salomon et al. with minor modifications. The recoveries of each sample through the columns are monitored by adding [3H]cAMP (10000 cpm/reaction) to assay
mix, thus eliminating individual difference between the columns.
In a tube kept on ice the following reagents are mixed together to prepare the assay mix as below:
Content Stock concentration Final
concentration (50 µl) Volume per reaction (µl) IM (Incubation Mix) 10 X (205 mM Tris-HCl pH 7.6, 10 mM cAMP, 10 mM EDTA, [3H]-cAMP ~2000 cpm/µl) 1 X 5.0 µl RS (Regenerating System) 10 X (200 mM creatinephosphatise, 2 mg/ml creatine phosphokinase, 400 U/ml myokinase) 1 X 5.0 µl GTP 10 mM 20 µM 0.1 µl MgCl2 100 mM 4 mM 2.0 µl IBMX 25 mM 1 mM 2.0 µl ATP/[α-32P]ATP 100 mM 0.1 mM 5.0 µl dH2O (106cpm/5 µl) 0.9 µl total 20 µl
30 The additives are prepared and diluted in 0.1% BSA/1 mM ascorbic acid respectively to the final concentration: Forskolin 100 µM, 5-HT 100 µM, 5-CT 10 µM, SB269970 100 µM. For concentration-response curve of 5-HT, 5-CT and SB269970, a serial 1:2 dilution of the final concentration (5-HT 100 µM, 5-CT 10 µM, SB269970 100 µM) is performed to achieve 21 different concentrations. The stock Forskolin solution is diluted to obtain the final concentration (100 µM) and to achieve 3 tubes for each sample with the same concentration. The reaction tubes are kept on ice and 20 µl of each additives dilutions are added. Other 20 µl of 0.1% BSA/1 mM ascorbic acid are used to perform 3 tubes for basal and blank samples respectively.
Afterwards a vial of membrane preparation is thawed on ice and 10 µl are used in each reaction tube, 10 µl of TE buffer are added to the blanks tubes. 20 µl of assay mix prepared before are added to each tube, the reaction tubes are mixed by vortexing and transferred to a shaker water bath at 32° C and incubated for 20 minutes, then 100 µl of STOP solution (10mMcAMP, 40mM ATP, 1% SDS) are added to each reaction tube.
The chromatography separation starts with the equilibration of the Dowex 50 columns with ~ 10 ml of dH2O, the columns should drain completely before use. 850 µl
of dH2O are added to each reaction tube and are poured in to Dowex columns and to
wait that the columns are completely drained. The Dowex columns containing the samples are washed with 2 + 2 ml of dH2O, respectively. The rack of Dowex columns
are placed on the top of the Alumina columns (pre-equilibrated before with ~10 ml of imidazole-HCl buffer), the reaction products elute from dowex columns into Alumina columns with 4 ml of dH2O. The Alumina columns containing the samples are washed
with 2 ml of imidazole-HCl buffer. The rack of Alumina columns are placed now on the top of a rack of counting vials, filled with 3.5 ml scintillation fluid (Ultima Gold XR, Packard); 3.5 ml of imidazole-HCl buffer are added to the Alumina columns and the reaction products are eluted to the counting vials. The vials are capped and shaked well and counted in the Wallac WinspectralTM 1414 Liquid scintillation Counter, Perkin Elmer. After use the Dowex columns are regenerated by sequential washing with ~ 10 ml of each of 2 M NaOH, dH2O, 2 M HCl and 2 x dH2O, then the columns can be
stored dry and need only to be reequilibrated with dH2O before use. The Alumina
columns are washed with ~ 10 ml of dH2O and stored in water after use, these columns
31
2.14 Protein quantification
The amount of protein in membrane preparation is determined by using the microBC Assay protein quantification kit (Uptima). This assay is a colorimetric assay based on the Biuret reaction. In an alkaline solution peptidic bonds of protein reduces Cu2+ to Cu+. Two molecules of bicinchoninic acid (BCA) chelates Cu+ ion with very high specificity and forms a water soluble purple colored complex which has an absorption maximum at 562 nm. The absorbance is directly proportional to the initial protein concentration between 1-20 µg/ml, allowing for spectrophotometrical quantification of protein content in an aqueous solution.
Triplicates of BSA standards samples are prepared with the following concentration: 0, 1, 2.5, 5, 7.5, 10, 15, 20 µg protein in a 96-well plate; dH2O is used as
zero standard. From the binding assay are used 20 µl of membrane preparation samples and 10 µl from the adenylyl cyclase assay that are pipetted in 5 different wells. 30 µl of dH2O are added to the standards and 50 µl to the samples. 10 µl of 1 % of SDS are
added to each well of the plate. The MicroBCassay working reagent is prepared as a mixture between the solutions A+B+C in the ratio 25:25:1 and 80 µl of this mixture are added to each well. The plate is covered with plastic tape and mixed gently on a plate shaker for 30 seconds, then it is incubated at 60° C for 1 hour. The absorbance is measured at 570 nm in a Perkin Elmer HTS 7000 Bio Assay Reader. Standards curve are prepared by plotting absorbance of the standard versus the amount of protein and to quantify the amount of protein in the samples from linear parts of the curve.
2.15 Calculations
Binding and adenylyl cyclase data are analyzed by non-linear regression using Microsoft Excel 2007 with the Solver add-inn, using the following equations.
Saturation binding.The non-specific binding was assumed to be linear and
analyzed by linear regression. The concentration of free [3H]5-CT was estimated as the difference between [3H]5-CT added and [3H]5-CT bound (non-specific or total), and
32 this estimate was used in all further calculations. The specific binding data were fit to the equation:
Y= Bmaxx/(Kd+x)
whereBmax is the total number of specific binding sites (receptors), Kd is the equilibrium
dissociation constant and x is the concentration of free [3H]5-CT.
Competitive binding assays. The data were fit to the equation: Y=a+(b-a)/(1+x/c)
wherea is non-specific binding, b is total binding in the absence of competitor, c is IC50,
and x is the concentration of competitor.
Activation of adenylyl cyclase.The data were fit to the equation: Y=a+(b-a)x/(c+x)
wherea is basal adenylyl cyclase activity, b is maximal adenylyl cyclase activity stimulated by the agonist, c is EC50, and x is the concentration of agonist.
Antagonism of 5-HT-evoked adenylyl cyclase stimulation. The data were fit to
the equation:
Y=b+(a-b)/(1+x/c)
wherea is agonist-stimulated adenylyl cyclase activity in the absence of antagonist, b is agonist-stimulated adenylyl cyclase activity in the presence of a saturation concentration of antagonist, c is IC50, and x is the concentration of antagonist.
2.16 SDS-PAGE and Western blotting analysis
The separation of macromolecules in an electric field is called electrophoresis. A very common method for separating proteins by electrophoresis uses a discontinuous polyacrylamide gel as a support medium and sodium dodecyl sulfate (SDS) to denature the proteins. The method is called sodium dodecyl sulfate polyacrylamide gel electrophoresis (SDS-PAGE).SDS (also called lauryl sulfate) is an anionic detergent, meaning that when dissolved its molecules have a net negative charge within a wide pH range. A polypeptide chain binds amounts of SDS in proportion to its relative molecular mass. The negative charges on SDS destroy most of the complex structure of proteins, and are strongly attracted toward an anode (positively-charged electrode) in an electric field.Protein separation by SDS-PAGE can be used to estimate relative molecular mass,
33 to determine the relative abundance of major proteins in a sample, and to determine the distribution of proteins among fractions.
2.16.1 Sample preparation
The membrane preparations are properly thawed and the samples are diluted to desired concentration using TE buffer. To each sample ¼ of total sample volume of 4X SDS-gel loading buffer activated with 10 % of β-mercaptoethanol is added. All samples are kept on ice before to load them on the gel.
2.16.2 Gel casting
Many systems for protein electrophoresis have been developed, and apparatus used for SDS-PAGE varies widely. A Mini-PROTEAN Tetra Electrophoresis System (Bio-Rad) is used. Gels are usually polymerized between two glass plates in a gel caster. The glass plates, one long with attached spacers and one short for each gel, are washed three times with dH2O and 75% EtOH. The glasses are put into holder, ensure bottom
edges of the two plates are well aligned and cleaned with air to remove any fibres and clipped into stand. 10 ml of 8 % SDS-acrylamide separating gel solution is prepared (dH2O, 30% acrylamide mix (acrylamide/bis N,N’-methylene-bis-acrylamide), 1.5 M
Tris-HCl pH 8.8, 10 % SDS, 10 % APS, TEMED (not add APS and TEMED until ready to cast). About 4-5 ml of separating gel are poured between the assembled glass plates and sufficient place is left for the stacking gel. Carefully overlay the acrylamide solution with 150-200 µl of n-butanol to ensure a flat surface. Leave the gel solution to set for about 30 minutes at room temperature. Afterwards the n-butanol solution is washed away with water and removed remaining water with filter paper. A5% polyacrylamide stacking gel solution is prepared (dH2O, 30% acrylamide mix
(acrylamide/bis N,N’-methylene-bis-acrylamide), 1.0 M Tris-HCl pH 6.8, 10 % SDS, 10 % APS, TEMED) and poured on top of separation gel. The specific comb is put in place and let the stacking gel polymerize for approximately 20-30 minutes at room temperature.
34
2.16.3 Gel running
While the stacking gel is polymerizing, prepare the samples by heating them to 95-100° C for 3-5 minutes in 1X SDS- gel loading buffer to denature the proteins. After polymerization is completed, the Teflon comb is removed carefully and washed with 1X Tris-glycine electrophoresis running buffer. The gel is mounted in the electrophoresis apparatus and the tank is filled and inner chamber with 1X Tris-glycine electrophoresis buffer. 15 µl of each preheated sample and 7µl of specific molecular weight standards (Precision Plus Protein Dual Color Standards, Bio-Rad) are loaded into the gel. The electrophoresis apparatus is attached to a power supply (BioRad Power Pack 300). The protein samples run through the stacking gel at constant current (A) of 20 mA, when the dye front has reached the resolving gel the current is increased to 45 mA. The gel should run until the dye front reaches the bottom of the resolving gel.
2.16.4 Western blotting
The 1X transfer buffer is prepared from the stock solution 10X (313 mMTris base, 2.4 M glycine), methanol and dH2O is added until 700 ml. The transfer buffer is
poured into a tank and are added (per gel) 6 pieces of filter paper, 2 pads and an activated (15 seconds pre-treatment in methanol) PVDF (polyvinylidenedifluoride) membrane. The tank is put in freezer for 1 hour. When gel separation is finished the glass plates are removed, the stacking gel and any residual gel around the edge are separated and removed. The pads are placed onto blotting mesh folder and covered with 2 pieces of filter paper. The 3rdpiece of filter paper is put onto the gel, turned over and the gel is removed from glass (using spatula) and then is put onto the other filters paper. The gel is covered with the PVDF membrane (smoothen away bubbles) and then it is covered with 3 pieces of filter paper and another pad. The mesh folder is closed and put into the blotting tank. The membrane must be closest to the red (+) pole and the gel closest to black (-) pole. A magnetic stirrer and an ice block are added to cool the system under blotting process. For transferring a current of 400 mA is used to pull the protein from the gel into the PVDF membrane.
35
2.16.5 Immunodetection
After transferring the membrane is incubated on a shaker for the non-specific block for 1 hour in 10 ml of 5% non-fat dry milk in phosphate buffered saline (PBS)/Tween 20 (0.05 %) at room temperature, afterwards a primary antibody (rabbit, Oncogene) is diluted to the desired concentration in 5% milk-PBS/Tween 20solution and the membrane is incubated with the primary antibody solution over night at 4° C. The next day the membrane is washed 3 times, each one for 5 minutes with PBS/Tween 20, then a secondary antibody (ECLTM Anti-rabbit IgG Horseradish Peroxidase Linked) is diluted to the desired concentration in 5 % milk-PBS/Tween 20 solution and the membrane is incubated in this solution for 1 hour at room temperature. Afterwards other 3 washes for 5 minutes in PBS/Tween 20 are repeated at room temperature and then the membrane is rinsed with dH2O to remove Tween 20 until it is free from foam and
prepared to the detection by chemiluminescense (LumiGLO Solution). The membrane is put into a container with pre-prepared detection substrate (chemiluminescence reagent containing HRP substrate) and incubated on a shaker at room temperature for 1 minutes. Afterwards the membrane is placed between two clean acetate sheets for scanning and exposed for appropriate time using UCP Sensicam (UVP Inc., CA, USA).
2.17 Molecular Dynamics
Molecular Dynamics (MD) is a form of computer simulation where atoms and molecules are allowed to interact with each other according to the laws of physics. Being the molecular systems made by a large number of particles, it is impossible to do an analytical analysis of the system properties. MD avoids this problem by means of numerical methods. One of the most significant advantages in MD is the consideration that molecules are machines in motion, thus MD investigates the relationship between structure, movement and function of macromolecules.
In chemistry and biophysics, the interaction between particles is either described by a “force field” (classical MD), a quantum chemical model, or a mix between them.
36 These terms are not used by physics, where interaction between particles are described by “potential functions”.
In chemistry, MD is used as an important tool in protein structure determination and refinement of X-ray crystallography and NMR structures. MD has also been applied as a method of refining protein structure prediction. In fact protein folding is influenced not only by primary structure of protein but also by other factors as: proteins chaperone, metal factor, cell environment, concentration gradients, potential gradient.
A molecular dynamics simulation should take account for the available computational resources. Simulation size (n=number of particles), time-step and total time duration must be selected so that the calculation can finish within a reasonable time period. However, the simulations should be long enough to be relevant to the time scales of the processes studied.
To make statistically valid conclusions from the simulations, the time span simulated should match the kinetics of the natural process. To obtain these simulations, several CPU-days to CPU-years are needed. Parallel algorithms allow the load to be distributed among CPUs.
During a classical MD simulation, the most CPU intensive task is the evaluation of the potential (force field) as a function of the particles internal coordinates. Within that energy evaluation, the most expensive one is the non-bonded or non-covalent part. Another factor that impacts total CPU time required by a simulation is the size of the integration timestep. This is the time length between two recurrent evaluations of the potential. Typical timesteps for classical MD are in the order of 1 femtosecond (1E-15 s). This value may be extended by using algorithms such as SHAKE, which fix the vibrations of the fastest atoms (e.g. hydrogens) into place.
For simulating molecules in a solvent, a choice should be made between explicit solvent and implicit solvent. Explicit solvent particles (such as the TIP3P, SPC/E and SPC-f water models) must be calculated expensively by the force field, while implicit solvents use a mean-field approach. Using an explicit solvent is computationally expensive, requiring inclusion of roughly ten times more particles in the simulation. But the granularity and viscosity of explicit solvent is essential to reproduce certain properties of the solute molecules. This is especially important to reproduce kinetics.
In all kinds of molecular dynamics simulations, the box size must be large enough to avoid boundary condition artifacts. Boundary conditions are often treated by
37 choosing fixed values at the edges (which may cause artifacts), or by employing periodic boundary conditions in which one side of the simulation loops back to the opposite side, simulating a bulk phase.
Molecular dynamics simulation calculate temporal evolution of a molecular system by numerically integrating the system’s classical equation of motion ( Newton equation ). ) ,..., , ( 1 2 2 2 n i i i i i t F V r r r r m i=1,N (1)
The above N coupled equation are simultaneously solved to obtain the atomic positions and velocities as a function of time. Here mi and ri are the mass and position of
particle i and V(r1, r2,…, rn) is the potential energy function, that depends on the
position of all N particles. The negative gradient of the potential energy function in comparison with the position of particle i is the force Fi acting on that particle.
To solve this set of coupled differential equations it is necessary to define the initial condition from which the integration starts. Those conditions include: initial position of all atoms and their velocities. For protein simulations the initial positions are given as .pdb files, which are converted for the software used in the MD simulation (for instance psf and .gro files for the NAMD and the GROMACS softwares respectively).
The starting velocities are assigned from a Maxwell-Boltzmann distribution at some relatively low temperatures in each of the three velocity components x, y, and z. The system is then slowly heated up to the desired simulation temperature.
The temperature at any given moment is defined in terms of the mean kinetic energy:
2 1 1 ) ( i M i i b v m M k t T
(2)M is the total number of unconstrained degree of freedom, viis the velocity of
the particle i at time t, and kb is the Boltzmann constant.
Every molecular dynamics simulation is divided into several stages:
Model generation: generation of the molecular model (creation of box, solvation of system, addition of ions)
Preparation: minimization of the initial structure and heating up to simulation temperature
38 Equilibration: this is an important stage in which long dynamics trajectories are made in order to obtain equilibration of the system and therefore reliable results Production run: actual dynamics simulation from which data is accumulated Analysis: converts data of simulation in important information
To obtain molecular trajectories and velocities the MD software relies on an integration algorithm (integrator). The algorithm uses the finite difference method: given coordinates and velocities values at time t, the values are calculated by the integrator at time t + Δt; Δt is named timestep.
The most used integration algorithm in biomolecular simulation is the Verlet integrator, which is based on two Tailor expansion of velocity, forward expansion (t + δt) and backward expansion (t – δt).When performing numerical calculations it is important to be able to assess the quality of the procedure (its stability). Since Newton equation conserves energy (microcanonic system) a good simulation is expected to maintain the total energy fixed. One measure for its stability is the ratio between the average fluctuation of total energy <ΔE> = <E(t)-<E>> and the average total energy of the system <E>: <ΔE>/<E> . This ratio must be smaller than 10-3 to consider the simulation stable.
During MD simulation the temperature must be controlled. As defined above the temperature is related to the kinetic energy of the system, therefore the MD simulation is dramatically affected by the temperature.
2.17.1 Forcefield
The complete representation of a molecule need the resolution of the Schrödinger equation (4):
)
,
(
)
,
(
r
R
E
r
R
H
(4)This equation cannot be solved without approximation for systems that are not hydrogenoid atoms. With the introduction of the Born-Oppenheimer approximation the equation (4) could be divided in two equations: