PoS(ICRC2017)206
CALET onboard the International Space Station
Yuma Komiya∗
Graduate School of Advanced Science and Technology, Waseda University
E-mail:[email protected]
Gabriele Bigongiari
University of Siena and INFN
E-mail:[email protected]
Shoji Torii
Graduate School of Advanced Science and Technology and Research Institute for Science and Engineering, Waseda University
E-mail:[email protected]
Yoichi Asaoka
Research Institute for Science and Engineering
E-mail:[email protected]
for the CALET Collaboration
In August 2015, the CALorimetric Electron Telescope (CALET) docked with the International Space Station (ISS). CALET will measure the cosmic ray electron spectrum over the energy range of 1 GeV to 20 TeV with a very high resolution of 2% above 100 GeV, based on a dedicated instrument incorporating an exceptionally thick 30 radiation-length calorimeter with both total absorption and imaging units (TASC and IMC). Each TASC readout channel must be carefully calibrated to obtain the degree of precision necessary to achieve the high energy resolution. This report describes the specific calibration methods, focusing on the calibration of the energy deposit of each channel to obtain an ADC unit to energy conversion factor using Minimum Ioniz-ing Particles (MIP), known as “the MIP calibration.” To fully calibrate each lead tungstate (PWO) log of the TASC, it is first necessary to correct the position dependent effects so as to equalize the response along its length. In addition, because both the PWO light yield and the APD gain will vary with temperature, it is also required to correct for this temperature dependence. Following these corrections for the position and temperature dependence, and also using events extracted using event selection based on likelihood analysis, it was possible to find the energy conversion factor. With the excellent agreement between the conversion factors obtained from proton and helium MIP data, the validity of the absolute calibration of the energy conversion factor was confirmed. In the end, this report describes the analysis of the long term stability of the MIP calibration, from which it was concluded that the time dependence of the MIP peak value was successfully removed.
∗Speaker.
35th International Cosmic Ray Conference — ICRC2017 10–20 July, 2017
PoS(ICRC2017)206
1. Introduction
The CALET (CALorimetric Electron Telescope) [1], which was docked to the Exposed Fa-cility of the Japanese Experiment Module (JEM-EF) on the International Space Station (ISS) in August 2015, has been collecting data [2] since October 2015. The CALET detector has a very thick calorimeter unit of 30 radiation-length (X0), including the imaging calorimeter (IMC) and
the total absorption calorimeter (TASC). The primary purpose of the project consists of two parts; to discover nearby cosmic-ray accelerators [3,4] and to search for dark matter [7] with precision measurements of electron, hadron, and gamma ray spectra over a wide energy range.
This paper presents the calibration method stated in Ref [5], focusing on the MIP calibration specifically, and is organized as follows. In Section2, the energy measurements and calibration methods of CALET are described. Section3presents each step of the CALET energy calibration process in detail, along with the resulting data. The calibration over the wide dynamic range of CALET is specifically stated in Ref [6].
2. Energy Measurement and Calibration Method
To achieve a calibration accuracy matching the intrinsic energy resolution over the wide dy-namic range of six orders of magnitude, a careful calibration of each TASC readout channel is necessary. This paper focuses on the calibration of the energy deposit of each channel to obtain an ADC unit-to-energy conversion factor using MIPs. Just like other detectors intended for direct cosmic-ray measurements, CALET can make use of penetrating particles in order to equalize the gains of different detector segments, taking advantage of the fact that the energy deposits of such particles in the relativistic energy range are approximately constant. One unique fact about CALET, in contrast with the calibration of a spectrometer, is that MIP calibration serves as an absolute en-ergy calibration of the CALET since this instrument is a total absorption calorimeter. Therefore, end-to-end absolute energy calibrations that simultaneously include all the detector responses, such as PWO scintillation yield, photon propagation in the PWO, quantum efficiency of the APD/PD, gain of the front end circuit, and others, are possible using the MIP technique.
3. Energy Calibration
3.1 MIP Calibration
As stated in the previous section, it is an important advantage of the CALET instrument that an end-to-end absolute calibration of the energy scale is possible with the MIP technique. While it is relatively easy to achieve a 10% accuracy using MIPs, a calibration with a better accuracy requires careful analysis of the energy distribution of incident particles, appropriate event selection of pene-trating particles, and consideration of the position and temperature dependence of each TASC log. The latter is especially important because CALET employs a one-end readout system and because of the relatively high temperature dependence of both the PWO and APD, which is discussed in detail in the following section. While the energy deposits of relativistic particles are approximately constant, the position of the MIP peaks will shift by several percent as a function of the geomagnetic latitude [8]. To account for this effect, the incident particle energy distributions are assessed by the
PoS(ICRC2017)206
TASC CH0 2 4 6 8 10 12 1416
Distance form the Photon Sensor [cm]
0 5 10 15 20 25 30 20 22 24 26 28 30 Photon Sensor X1
Distance form the Photon Sensor [cm]
0 5 10 15 20 25 30 C] o Temperature [ 20 22 24 26 28 30 X1-CH01 X1-CH16
Distance form the Photon Sensor [cm]0 5 10 15 20 25 30
TASC CH 0 2 4 6 8 10 12 14 16 20 22 24 26 28 30 Photon Sensor Y6
Distance form the Photon Sensor [cm]
0 5 10 15 20 25 30 C] o Temperature [ 20 22 24 26 28 30 Y6-CH01 Y6-CH16
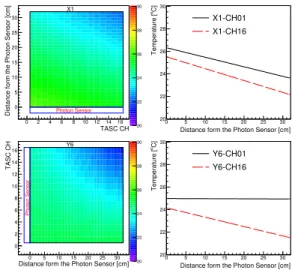
Figure 1: Temperature distributions in the TASC X1 (Top Left) and Y6 (Bottom Left) units, aver-aged over four months. Right side panels show the positional temperature variations along the length
of each unit. The black solid and red dashed
lines in the Top Right (Bottom Right) panels repre-sent X1-CH01 and X1-CH16 (CH01 and Y6-CH16) data, respectively.
use of ATMNC3 [9], simulating the energy spec-tra of incoming primary particles [8]. Also, con-tamination by interacting particles and/or scat-tered and stopped particles can cause a sys-tematic shift in the determined position of MIP peaks. In order to avoid this, the use of a likeli-hood analysis [8] ensures the appropriate selec-tion of penetrating particle events.
To further improve the selection efficiency and to reduce systematic bias during the event selection, the likelihood ratios of penetrating particles to interacting particles are also applied. In the event selection based on likelihood, the energy deposit distributions obtained from an MC simulation including the detector response of each channel are used. In the process of sim-ulating this detector response, data regarding the noise levels in units of energy is required, which in turn requires the ADC unit-to-energy conver-sion factor. Since this converconver-sion factor is ob-tained from the calibration, the MIP calibration is an iterative procedure. However, this process
converges very quickly and a single iteration is sufficient to obtain stable results when calibrating CALET.
3.2 Position and Temperature Dependence Corrections
Distance from APD/PD(cm)
0 5 10 15 20 25 30 MIP Ratio 0.5 0.6 0.7 0.8 0.9 1 1.1 1.2 1.3 1.4 1.5 before correction after correction correction curve X3-CH07
Figure 2: An example of the position dependence of the MIP peak for a typical TASC log. The filled black and red symbols represent data before and after the correction, respectively. The black line indicates the function used to fit the position dependence.
It is first necessary to correct for the position dependent effects so as to equal-ize the response along its length, in order to fully calibrate each TASC log, More-over, because both the PWO light yield and the APD gain will vary with tem-perature, it is also required to correct for this temperature dependence. Figure 1
presents the average temperature distribu-tions inside the X1 (Top) and Y6 (Bottom) layers of the TASC. Here, the left side panels show the two-dimensional temper-ature distributions, while the right side panels show the positional temperature dependence along the length of each unit. It is clear from these data that the
PoS(ICRC2017)206
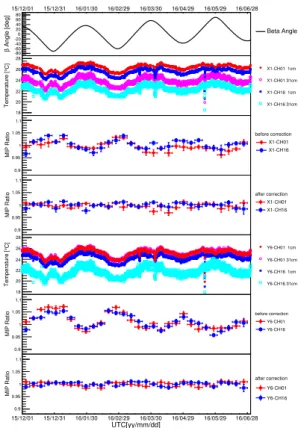
Angle [deg] β -80-60 -40 -20 0 20 40 60 80 15/12/01 15/12/31 16/01/30 16/02/29 16/03/30 16/04/29 16/05/29 16/06/28 Beta Angle C]° Temperature [ 18 20 22 24 26 28 X1-CH01 1cm X1-CH01 31cm X1-CH16 1cm X1-CH16 31cm MIP Ratio 0.9 0.95 1 1.05 1.1 before correction X1-CH01 X1-CH16 MIP Ratio 0.9 0.95 1 1.05 1.1 after correction X1-CH01 X1-CH16 C]° Temperature [ 18 20 22 24 26 28 Y6-CH01 1cm Y6-CH01 31cm Y6-CH16 1cm Y6-CH16 31cm MIP Ratio 0.9 0.95 1 1.05 1.1 before correction Y6-CH01 Y6-CH16 UTC[yy/mm/dd] 15/12/01 15/12/31 16/01/30 16/02/29 16/03/30 16/04/29 16/05/29 16/06/28 MIP Ratio 0.9 0.95 1 1.05 1.1 after correction Y6-CH01 Y6-CH16Figure 3: The relationship between the beta angle, temperature and MIP peaks. The upper graph plots the time variation of the beta angle. The second graph shows the variations over time of the temperatures of four segments located in the corners of TASC X1. The third and fourth graphs represent the MIP variations of two different channels at both ends of TASC X1, before and after the temperature dependence correc-tion. The last three graphs represent the same type of data for TASC Y6.
To correct for this position dependence, MIP peaks were determined for each of 16 segments defined along the length of each TASC log. Subsequently, the position depen-dence of these MIP peaks for each log was fitted using an appropriate function of dis-tance from the sensor (the PMT or APD/PD). To ensure the accuracy of the correction of positional dependence in each case, several different functions were defined. Figure 2
presents an example of the position depen-dence of a MIP peak both before and after the correction process. On average, a posi-tion dependence of 9.2% RMS was observed for a total of 192 PWO logs, which was suc-cessfully reduced to 1.8%.
In addition to the general temperature slopes in the TASC logs, there was also an overall temperature variation due to the de-pendence of temperature related to both the solar beta angle1 and the solar altitude. To discriminate between these temperature vari-ations and the position dependence due to temperature gradients in the TASC log data, the averaged temperature at the center of each log and averaged temperature gradient were obtained to calculate a position dependent reference temperature for each track.
The correction for temperature
depen-dence then employed the difference from the reference temperature. In this manner, the data were corrected for both the beta angle dependence and the overall temperature changes due to solar alti-tude without interfering with the position dependence correction. Figure3presents examples of the overall temperature dependence of MIP peaks over a period of seven months, together with solar beta angle variations over time (in the upper graph) and temperature variations for both the TASC X1 and Y6 layers. These data indicate that the MIP peak variation rate due to the temperature changes was, on average, -1.9% per degree for the PMT channels, and -3.4% for the channels with an APD. Since these observed temperature dependences were consistent with one another within the associated errors, universal values of gain corrections for the PMT and APD were adopted in-dependent of the PWO logs and reference temperatures. On average, a temperature dependence of 3.3% RMS was observed for 192 PWO logs, and this variation was successfully corrected for, reducing the RMS variation to 1.0%.
PoS(ICRC2017)206
3.3 Determination of the Energy Conversion Factor
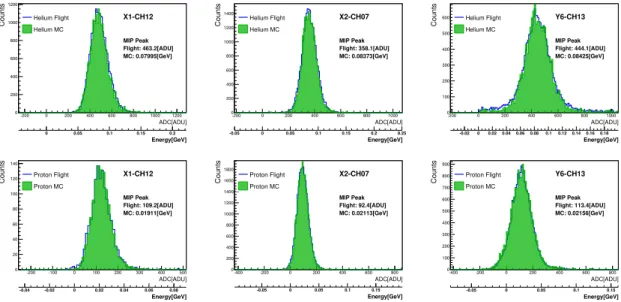
Following the corrections described in Section3.2, accurate calculations of the MIP peaks in ADC units (ADU) and in energy units could be obtained from the flight data and the simulated MC data, respectively. Subsequently, with the MIP peak values in both ADU and GeV, it was possible to find the energy conversion factor, GeV/ADU. In order to verify the accuracy of this conversion factor, factors were calculated for both proton and helium data. As shown in Fig.4, clear peaks resulting from penetrating helium (Top) and protons (Bottom) were extracted using event selection based on likelihood analysis for both flight and MC event data. The MC event data were generated from a CALET detector simulation [10] with the detector simulation tool EPICS [11] using the ATMNC3 results as input data. In Fig.4, data from one PMT channel (Left), one typical APD/PD channel (Middle) and one APD/PD channel in the bottom layer (Right) are shown.
The conversion factor was calculated by comparing MIP distributions between flight and MC data; the ratio of the peaks from an appropriate fitting gave the conversion factor. The accuracy of each conversion factor was estimated from the errors in the peak fits on a channel-by-channel basis. On average, the accuracy values were 1.6% and 0.6% for protons and helium, respectively. To ensure robustness of fit results, the fit range dependence of peak value was also investigated by changing the fit range by ±33% from its optimal value and it was found that such dependencies were reasonably small as 0.4% and 0.6% for protons and helium, respectively. They are included in both calibration error and systematic uncertainty on the energy scale.
Since the helium data have better statistics and a signal-to-noise ratio with an average of 8.1, it is evident that the more accurate determination of conversion factors was achieved using the helium data. Although this paper is focused on the calibration of the TASC, the same method is applicable to the CHD and IMC, and in fact was employed when equalizing and calibrating the energy deposit of each of their channels.
ADC[ADU] -200 0 200 400 600 800 1000 1200 Counts 0 200 400 600 800 1000 1200 X1-CH12 MIP Peak Flight: 463.2[ADU] MC: 0.07995[GeV] Energy[GeV] 0 0.05 0.1 0.15 0.2 Helium Flight Helium MC ADC[ADU] -200 -100 0 100 200 300 400 500 Counts 0 20 40 60 80 100 120 140 X1-CH12 MIP Peak Flight: 109.2[ADU] MC: 0.01911[GeV] Energy[GeV] -0.04 -0.02 0 0.02 0.04 0.06 0.08 Proton Flight Proton MC ADC[ADU] -200 0 200 400 600 800 1000 Counts 0 200 400 600 800 1000 1200 1400 X2-CH07 MIP Peak Flight: 358.1[ADU] MC: 0.08373[GeV] Energy[GeV] -0.05 0 0.05 0.1 0.15 0.2 0.25 Helium Flight Helium MC ADC[ADU] -400 -200 0 200 400 600 800 Counts 0 200 400 600 800 1000 1200 1400 1600 1800 X2-CH07 MIP Peak Flight: 92.4[ADU] MC: 0.02113[GeV] Energy[GeV] -0.05 0 0.05 0.1 0.15 Proton Flight Proton MC ADC[ADU] -200 0 200 400 600 800 1000 Counts 0 100 200 300 400 500 600 Y6-CH13 MIP Peak Flight: 444.1[ADU] MC: 0.08425[GeV] Energy[GeV] -0.02 0 0.020.040.060.08 0.1 0.120.140.160.18 Helium Flight Helium MC ADC[ADU] -400 -200 0 200 400 600 800 Counts 0 100 200 300 400 500 600 700 800 900 Y6-CH13 MIP Peak Flight: 113.4[ADU] MC: 0.02156[GeV] Energy[GeV] -0.05 0 0.05 0.1 0.15 Proton Flight Proton MC
Figure 4: Comparisons of distributions of flight and simulated helium and proton data. Blue open and green hatched histograms represent flight and MC data, respectively. The top three plots provide helium distributions, while the bottom three show proton distributions. Data from one PMT channel (Left), one typical APD/PD channel (Middle) and one APD/PD channel in the bottom layer (Right) are shown.
PoS(ICRC2017)206
3.4 Estimation of Calibration Accuracy
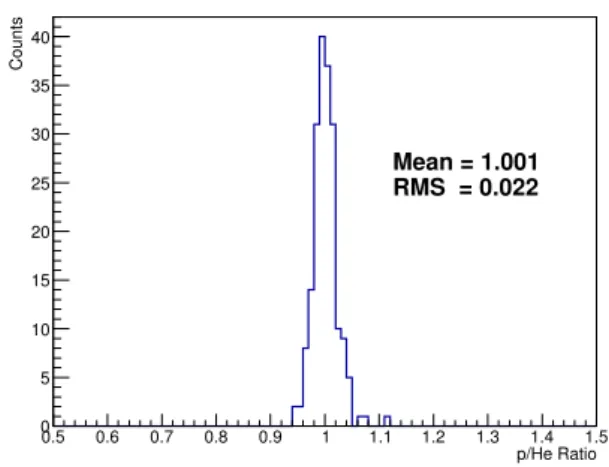
p/He Ratio 0.5 0.6 0.7 0.8 0.9 1 1.1 1.2 1.3 1.4 1.5 Counts 0 5 10 15 20 25 30 35 40 Mean = 1.001 RMS = 0.022
Figure 5: Comparison of conversion factors obtained
from proton and helium MIPs. The histogram
repre-sents the distribution of the proton MIP conversion fac-tors divided by those obtained from helium MIPs for each TASC log.
One key test to confirm the validity of the absolute calibration of the energy conversion factor is to assess the consis-tency between proton and helium data. As shown in Fig.5, excellent agreement was obtained between conversion factors obtained from proton and helium MIP data. This figure plots the conversion fac-tors obtained in the case of proton MIPs divided by those generated from helium MIP data for all TASC logs. From the re-sulting distribution, it is concluded that, on average, the conversion factors agree within 0.1%.
To directly evaluate the effects of the energy distribution of incoming particles, the MIP peak variations due to the rigidity
cutoff were compared between the helium flight and MC data. Both data displayed similar trends, although there were small discrepancies at the low cutoff region, where low energy particles play an important role. This could result from inaccuracy of the solar modulation parameter or insufficient MC statistics. Herein, a conservative estimate of a potential discrepancy of 1.0% is introduced for the systematic uncertainty in the energy scale and in the calibration accuracy.
3.5 Long Term Stability of the MIP Calibration 3.5.1 Time Dependence of TASC MIP Value
Figure 6: An example of the time dependence of the MIP peak for a typical TASC log. The filled black and red symbols represent data before and after the correction, respectively. The black line indicates the function used to fit the time dependence.
Aside from the position and temper-ature dependence of the TASC MIP value described in Section 3.2, there still re-mains the time dependence of the MIP value. This is due to the variation of the TASC gain, and it should be corrected as a function of time. Figure 6 presents an example of the time variation of TASC MIP peaks before and after the correction process for every two weeks over a pe-riod of thirteen months, where the posi-tion and temperature dependence are cor-rected. The time dependence was fit-ted using an appropriate function of time shown below;
PoS(ICRC2017)206
y= exp(a + bt) + c (3.1)
3.5.2 Long Term Stability of the TASC Conversion Factor
Figure 7: Time variation of the TASC conversion factor before(top) and after(bottom) the time de-pendence correction for TASC-Y6. The statistics after July 2016 are smaller due to the reduction of the calibration run.
Figure 8: Y-projection of the time variation of the conversion factor in each state of the corrections. Blue, red, and black histograms represent the sta-bility after the position, temperature, and time de-pendence correction, respectively.
With the correction of the time dependence, the long term stability of the MIP calibration can be confirmed. Figure 7 presents an example of the time variation of the TASC conversion factor before (Top) and after (Bottom) the time dependence correction. In Figure 8 , the time variation of the MIP conversion factor, where an example is shown in Figure7, is projected on the Y-axis reperesenting the stability of the MIP conversion factor within each state of the corrections (position, temperature, time). The figure indicates that the application of each correction improves the stability of the conversion factor. On average, the stability of the TASC conversion factor of 1.16% RMS was observed after the time dependence correction. Again, though this paper is focused on the calibration of the TASC, the same method was employed to the CHD and IMC.
4. Conclusion
Energy calibration of the CALET, launched to the ISS in August 2015 and accumulating sci-entific data since October 2015, was performed using both flight data and calibration data acquired on the ground before launch. By taking advantage of the fully-active total absorption calorimeter, absolute calibration between ADC units and energy was possible with an accuracy of a few percent, using penetrating particles. The systematic error in the energy scale was also estimated based on the calibration results and was found to be ≤ 2%. With the removal of the time dependence of the MIP peak value, the long term stability of the MIP calibration was confirmed. Based on long du-ration observations of high energy cosmic rays onboard the ISS, the measurement of the inclusive (e++ e−) electron spectrum well into the TeV region with unprecedented accuracy is expected, as well as measurements of gamma-rays, protons and nuclei.
PoS(ICRC2017)206
Acknowledgements
We gratefully acknowledge JAXA’s contributions to the development of CALET and opera-tions on board the ISS. We also with to express our sincere gratitude to ASI and NASA for their support of the CALET project. Finally, this work was partially supported by a JSPS Grant-in-Aid for Scientific Research (S) (no.26220708) and by the MEXT-Supported Program for the Strategic Research Foundation at Provate Universities(2011-2015) (no.S1101021) at Waseda University.
References
[1] S. Torii for the CALET Collaboration, “The CALorimetric Electron Telescope (CALET): High Energy Astroparticle Physics Observatory on the International Space Station”, Proceedings of Science, Proc. of the 34th ICRC (The Hague, Netherlands), 581
[2] Y. Asaoka for the CALET Collaboration, “Development of the Waseda CALET Operations Center (WCOC) for Scientific Operations of CALET”, Proceedings of Science, Proc. of the 34th ICRC (The Hague, Netherlands), 603.
[3] T. Kobayashi et al., “The most likely sources of high-energy cosmicray electrons in supernova remnants”, Astrophys. J. 601 (2004) 340.
[4] N. Kawanaka et al., “TeV electron spectrum for probing cosmic-ray escape from a supernova remnant”, Astrophys. J. 729 (2011) 93.
[5] Y.Asaoka for the CALET Collaboration, “Energy Calibration of CALET Onboard the International Space Station”, Astroparticle Physics.91(2017)1-10
[6] R. Miyata and the CALET Collaboration, Full Dynamic Range Energy Calibration of CALET onboard the International Space Station, in proceedings of The 35th International Cosmic Ray Conference, PoS (ICRC2017) 207 (2017).
[7] H. Motz, Y. Asaoka, S. Torii and S. Bhattacharyya, “CALET’s sensitivity to Dark Matter annihilation in the galactic halo”, JCAP 048P (2015) 1015.
[8] T. Niita for the CALET Collaboration, “Energy calibration of Calorimetric Electron Telescope (CALET) in space”, Adv. Space Res. 55 (2015) 2500.
[9] M. Honda et al., “New calculation of the atmospheric neutrino flux in a tree-dimensional scheme”, PRD 70 (2004) 043008.
[10] Y. Akaike for the CALET Collaboration, “Expected CALET Telescope Performance from Monte Carlo Simulations”, Proc. of the 32nd ICRC (Beijing, China), Vol.6, (2011) 371.
[11] K. Kasahara, “Introduction to cosmos and some relevance to ultra high energy cosmic ray air showers”, Proc. of 24th International Cosmic Ray Conference (Rome); “EPICS Home Page” http://cosmos.n.kanagawa-u.ac.jp/EPICSHome/.