YP Remote Sensing 2018
Young Professionals Conference on Remote Sensing
7-8 June 2018, Eurogress-Aachen, Aachen, Germany
Contents
Session 1 – Information Extraction
Comparison of Sentinel-1 and ALOS AW3D30 DSM Potentials in a Mountainous
Topography...1
Oil Spill Classification Based on Dark Spot Detector and Wind Parameters
Estimation on SAR Data...5
Session 2 – Land and Geology
Clear-Cuts Mapping Using LANDSAT NDVI Time Series...8
Chlorophyll Estimation in Mediterranean
Quercus Ilex Tree Canopies with
Hyperspectral Vegetation Indices at Leaf and Crown Scales...11
Crop-Specific Phenomapping by Using Dense, High-Resolution Landsat and
Sentinel Time-Series: A Case Study in Ukraine...14
High-Resolution WorldView-2 Dune Systems Sparse Vegetation Monitoring, By
Modeling Leaf Optical Properties and Directional Reflectance of the
Vegetation...18
NASA CYGNSS-Reflectometer and SMAP-Radiometer Functional Correlation
Over Land Surfaces...21
Session 3 – Sensors and Electromagnetics
The FLEX Mission as Example of Multiplatform Remote Sensing: Scientific
Opportunities and Implementation Challenges...24
Atmospheric Correction of Landsat-8 VNIR Bands Using Drone Imagery as
Reflectance Reference...28
Session 4 – Water and Ice
Drone Hyperspectral System for Monitoring Coastal Bathing Water Quality...32
Multi-Index Image Differencing Method for Flood Water Detection...35
Session 5 – Signal Processing
Improving Forest Carbon Maps: Modeling Approaches from High-Resolution To
National Scale...38
Extended Random Jumps: A New Spatial-Spectral Classification Algorithm for
Hyperspectral Remote Sensing Images...41
Exploring NDVI Data Continuity between Landsat 8 OLI and Sentinel-2A MSI in
a Temperate Forest District...45
Wind Speed Estimation Enhancement using SAR Despeckling from C-Band
Sentinel-1 Images...48
Poster Session
Hydrological Multitemporal Study of the Mountain Region in the State of Rio of
Janeiro (Brazil) Through Satellite Data and In-Situ Data...51
High Resolution Bathymetry of Littoral Zones Based on Very High Resolution
WorldView-2 Images...56
Differential Tomography Model to Deal with Temporal Decorrelation of
Volumetric Media...59
MULTI-INDEX IMAGE DIFFERENCING METHOD FOR FLOOD WATER DETECTION
Eduardo R. Oliveira
1, Leonardo Disperati
2, Luca Cenci
3,4, Fátima L. Alves
11
CESAM - Centre for Environmental and Marine Studies, Department of Environment and Planning,
University of Aveiro, 3810 – 120 Aveiro, Portugal
2
Department of Earth, Environmental and Physical Sciences, University of Siena, 53100 Siena, Italy
3Department of Information Engineering, Electronics and Telecommunications, Sapienza University of
Rome, 00184 Rome, Italy;
4CIMA Research Foundation, 17100 Savona, Italy
ABSTRACT
This study presents a remote sensing methodology to detect floods with a change detection approach based on image differencing of several water-related indexes. The proposed methodology is expected to integrate the strengths of each individual index and considers the agreement level among outputs obtained by different indexes as an indicator of overall uncertainty.
The analysis of data frequency distribution is used to obtain thresholds to implement data slicing and production of thematic maps. By considering different magnitudes of change, the proposed method is expected to b e sensitive to detect different types of flood-related changes, including the detection of recent tracks of water presence. This is particularly interesting for those situations whenever it is impossible to obtain cloud-free satellite images immediate ly after a flood event, which is often the case given the limitations of optical sensors.
The methodology has been applied to a fluvial flood event occurred in the surrounding of a natural lagoon in the Aveiro region (Portugal). Landsat 7 ETM+ and Landsat 8 OLI surface reflectance products were used as inputs. Sentinel 1 GRD data was used for comparison purposes. Results indicate an overall consistency, which allows us to expect the proposed method is replicable for other events and areas.
1. INTRODUCTION
Floods are amongst the most important weather-driven hazards, being capable of inducing multiple damages, including economic losses and threatening of human lives . Floods may result from heavy or persistent rainfall, flooding by waterbodies, water table rise, snowmelt, or being originated from artificial sources [1]
The definition flood, e.g. “temporary covering by water of land not normally covered by water” [2], conceptually implies occurrence of a certain type of change over time.
1 Thanks to the financial support of CESAM (UID/AM B/50017 -
POCI-01-0145-FEDER-007638), FCT/M CTES (PIDDAC), the FEDER within the PT2020 Partnership Agreement and Compete 2020. The PhD grant SFRH/BD/104663/2014 is also acknowledged.
Digital change detection techniques based on remote sensing imagery are capable of providing both long-term and short-term solutions [3]. Bi-temporal change detection analysis include several methods capable of dealing with short -term phenomena, such as floods.
Univariate image differencing is the most widely applied amongst bi-temporal algorithms. It consists in subtracting spectral or transformed data (e.g. by means of water-related indexes), producing positive and negative values, d epending on the type of change [3]. In theoretical and ideal conditions, no-change areas should result in zero values, however, in real conditions, this is not the case as effect of spatial and spectral co-registration errors, as well as natural time-dependent changes. One or more thresholds may be required to define two or more classes of change (density-slicing), which may provide hints about amounts and types of change. However, by quantifying absolute differences, this method is unable to specify directly the type of change.
The main objective of this study is to provide a satellite remote sensing method to detect floods, integrating several water-related indexes in a change detection method. The method was developed to be applied to multispectral satellite data acquired from Landsat (LS) series.
2.METHODOLOGY
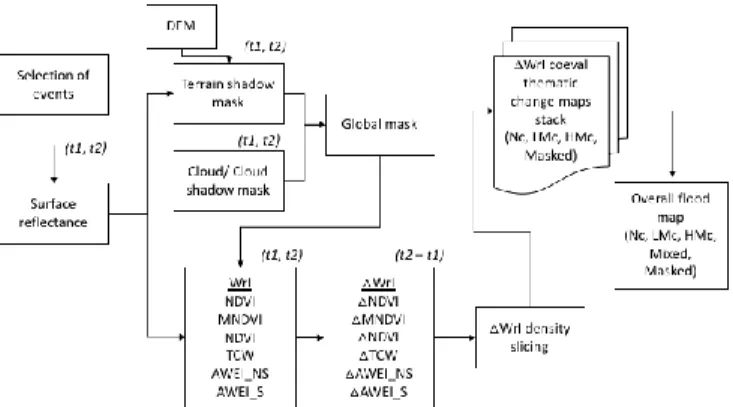
In Figure1, we illustrate the proposed methodology for flood areas detection, based on combining several Water-related Indexes (WrI) in a change detection approach. We considered the following WrI: the Normalized Difference Water Index (NDWI) [4]; the Modified Normalized Difference Water Index (MNDWI) [5]; the Automated Water Extraction Index (AWEI) (including ‘shadow’ and ‘ no shadow’ versions) [6]; and the Tasseled Cap Wetness (TCW) [7].
The methodology assumes that a certain area could have experienced a flood event within a certain time period. For flooded areas , WrI variation develops between the epochs t1 and t2 (respectively prior and after the given flood event).
Figure 1 - Methodological scheme
In theory, for change detection methods based on image differencing, no-change areas (Nc) are represented by zero digital values. Assuming the time span (t2 - t1) is reasonably short, Nc has to be the majority of the pixel image distribution corresponding to the modal range of the frequency distribution. In contrast, digital values different to zero represent change areas and they tend to be located toward both tails of the frequency distribution. If WrI differencing (ΔWrI) is applied we expect to locate flooded areas changes in only one of the tails, either positive for NDWI, MNDWI, TCW, AWEI, or negative for NDVI (in respect to the WrI here considered). The higher the distance from the modal ΔWrI value, the higher the magnitude of change, corresponding to a complete change of state from dry to flooded surface. If flooding causes only such kind of changes, this results in an ideal bi-modal distribution where the discrimination between Nc and flooded areas is unambiguous. In practice, flooding may involve areas characterized by different initial conditions (land cover, substrate properties, surface roughness and wetness, and their spatial distribution in respect to pixel size) along with different flooding conditions (water thickness and suspended materials, water surface roughness), which implies a continuous distribution of ΔWrI values between the Nc and change end-members.
Moreover, when analyzing the frequency distribution one should also take into consideration the effect of spatial and spectral misregistration between input t1 and t2 imagery, those changes resulting from phenomena other than flooding and effective sensitivity of WrI to detect surface water. The main consequence of these conditions is that the real distribution of Nc is represented by a bell-shaped range of ΔWrI values located around zero.
Given the above considerations and the fact that image differencing doesn’t allow to discriminate among the types of change, but only change signal and intensity, we assu me to classify flooded area into the categories Low-Magnitude change (LMc) and High-Magnitude change (HMc) as a function of the ΔWrI value. This assumption requires for the definition of two thresholds, between Nc-LMc (TL) and LMc-HMc (TH) which are then used to apply density slicing to the multitemporal imagery. These thresholds could be
defined either by using ground truth information or analyzing the frequency distribution of data, the latter approach being a key point of the proposed method, allowing us to perform semi-automatic remote sensing procedures to extract flooded area from satellite imagery. We assume that these thresholds correspond to sudden variation of ΔWrI frequency. In the first case, the first order derivative of the function is a useful tool to define the thresholds which correspond to change of sign of the derivative function. In the other cases, the first derivative continuously gets closer to zero without reaching it, therefore we choose the ΔWrI where the second order derivative function reaches a local maximu m. In practice, for a given scene differencing, the distribution of ΔWrI may follow both conditions , around either TL or TH.
Depending on the availability of cloud-free optical satellite images, surface reflectance is used to determine each WrI for t1 and t2 (additional preprocessing steps may be required, e.g. geometric and radiometric calibrations, as well as cloud/shadow masking). After performing the ΔWrI calculation, by density slicing based on TL and TH, we obtain a stack of six different coeval thematic change maps . These different thematic maps represent changes caused by flooding according to each WrI specific sensitivity. Hence, the overall flood map integrating the information from each individual WrI is obtained by picking the absolute majority among the frequency of the classes Nc, LMc, HMc. Whenever the absolute majority does not occur, pixels are classified as ‘Mixed’. This means that the overall flood map directly provides an indication of pixel uncertainty, in which ‘Mixed’ pixels have more uncertainty than those attributed to classes Nc, LMc, HMc.
HMc should correspond to a complete change of state from dry lands to water surface. LMc is expected to represent pixels changing from dry to wet/saturated surfaces, as well as wet/saturated to water surfaces .Moreover, depending on the duration of the time span (t2 - t1), LMc may also correspond to those flooded areas that underwent drying/drainage processes after the flooding event. This is particularly interesting for those situations whenever it is impossible to obtain cloud-free satellite images immediately after a flood event, which is often the case given the limitations of optical sensors. Finally, the Nc areas will include permanent water bodies, continuously wet/saturated surfaces, as well as any other kind of permanently dry surfaces.
3. RESULTS
Herein, we provide results of the application of the proposed methodology to a flood event occurred in the Aveiro Region, located on the NW part of continental Portugal. All image processing tasks were performed with GRASS GIS (v7.2.2) and map compositions with QGIS (v2.18.15).
According to meteorological databases , a maximu m of 128.9 mm of daily precipitation were registered in the study area for 2016/02/13, corresponding a precipitation event with a return period of 16.4 years.
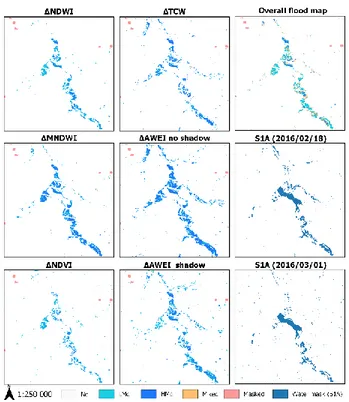
For t1, we considered the LS 8 OLI from 2016/02/05 and for t2 the LS 7 ETM+ from 2016/02/29 (SLC-off) (Level-2 products obtained from https://earthexplorer.usgs.gov). Cloud/Cloud shadow masks were extracted from the ‘pixel_qa’ band of each scene. Terrain shadows where extracted from shaded relief maps, using the SRTM 1 arc sec DEM and azimuth and elevation (found in LS metadata). After determining each WrI (for t1 and t2) and the corresponding ΔWrI (t2-t1), we proceeded to the extraction of thresholds according to the proposed methodology. Figure 2, illustrates every ΔWrI coeval thematic map, along with the overall flood map. Moreover, considering the lack of ground truth data, for comparison purposes, we have also included water masks obtained from Sentinel-1A (S1A) GRD images from 2016/02/18 and 2016/03/01 (extracted from visual inspection of Sigma0 VV (dB) histograms).
4. DISCUSSION
In the present study, we were able to extract thresholds for every ΔWrI using the histogram frequency analysis. However, we found this task to be more straightforward for normalized indexes (i.e. NDWI, MNDWI and NDVI), when compared to non-normalized indexes (i.e. TCW and both versions of AWEI). For non-normalized WrI, smoothing of data (by means of mobile averages) was required to interpret first and second order derivatives of WrI.
Considering the overall flood map, we verify a low occurrence of ‘Mixed’ pixels, which is an indicator of overall coherence between the different WrI coeval thematic maps, meaning low uncertainty.
Despite the temporal proximity between t2 (LS7 from 2016/02/29) and S1A (2016/03/01) scenes, the agreement between flooded areas (i.e. LMc + HMc) and the S1A water mask is only 37%. Regarding the S1A scene closer to the event (2016/02/18), the agreement is higher, 47%. This confirms the sensitivity of the proposed method in detecting recent tracks of water from flood events, in particular for LMc. The overall low agreement levels could be related to the unavailability of S1A scenes obtained during the flood event (or immediately after). Besides, it could also mean that the proposed method is overestimation flooded aras, or S1A could be underestimating them by not detecting wet/saturated areas which take place in the following days after the flood event.
5. CONCLUS ION
The proposed methodology demonstrated capability of extracting flooded areas from optical satellite imagery obtained several days after a heavy precipitation event. The combination of multiple water-related index differencing resulted in overall coherence, suggesting low uncertainty.
The overall flood map is consistent with water masks extracted from Sentinel-1A (S1A) scenes obtained several days after the event. However, low agreement levels suggest
Figure 2 - ΔWrI coeval classifications and overall flood map for 2016/02/13; Water masks obtained from S 1A scenes, from 2016/02/18 and 2016/03/01.
either overestimation of flooded areas, or underestimation by S1A water masks. The proposed method is expected to be replicable for other events and study areas.
6. REFERENCES
[1] B. Liu, Y. L. Siu, G. Mitchell, and W. Xu, “The danger of mapping risk from multiple natural hazards,” Nat. Hazards, vol. 82, no. 1, pp. 139–153, 2016.
[2] EU, “DIRECTIVE 2007/60/EC OF THE EUROPEAN PARLIAM ENT AND OF THE COUNCIL of 23 October 2007 on the assessment and management of flood risks,” Off. J. Eur. Union L, vol. 288, no. 27, p. 2007, 2007. [3] P. Coppin, I. Jonckheere, K. Nackaerts, B. M uys, and E.
Lambin, “Digital change detection methods in ecosystem monitoring: A review,” Int. J. Remote Sens., vol. 25, no. 9, pp. 1565–1596, 2004.
[4] S. K. McFeeters, “The use of the Normalized Difference Water Index (NDWI) in the delineation of open water features,” Int. J. Remote Sens., vol. 17, no. 7, pp. 1425– 1432, M ay 1996.
[5] H. Xu, “Modification of normalised difference water index (NDWI) to enhance open water features in remotely sensed imagery,” Int. J. Remote Sens., vol. 27, no. 14, pp. 3025–3033, 2006.
[6] G. L. Feyisa, H. M eilby, R. Fensholt, and S. R. Proud, “Automated Water Extraction Index: A new technique for surface water mapping using Landsat imagery,” Remote Sens. Environ., vol. 140, pp. 23–35, 2014.
[7] E. P. Crist, “A TM Tasseled Cap equivalent
transformation for reflectance factor data,” Remote Sens. Environ., vol. 17, no. 3, pp. 301–306, 1985.