UNIVERSITÀ DEGLI STUDI DELLA TUSCIA
DIPARTIMENTO DI SCIENZE DELL‘AMBIENTE FORESTALE E DELLE SUE RISORSE (DI.S.A.F.RI.)
CORSO DI DOTTORATO DI RICERCA IN ECOLOGIA FORESTALE –XXIII CICLO
Land use change and carbon stock
dynamics in Sub-Saharan Africa
Case study of Western Africa – Ghana
Cambiamenti di uso del suolo e dinamiche degli stock di carbonio
nell‘Africa Sub-Sahariana
SETTORE SCIENTIFICO-DISCIPLINARE AGR05
Coordinatore: Prof. Paolo De Angelis
2 Only when the last tree has died, the last river has been poisoned and the last fish has been caught will we realize that we cannot eat money.
3
Summary
1 List of Acronyms ... 6 2 Foreword ... 8 3 Sommario ... 11 4 Introduction ... 144.1 Tropical forests and climate change ... 14
4.2 Tropical deforestation and land use change ... 17
4.3 Africa ... 23
4.4 Ghana context ... 25
4.4.1 Historical evolution of forest policy in Ghana and its impact on deforestation and forest degradation ... 26
4.5 The role of forests in the international policies ... 32
4.5.1 Economic instruments for developing countries and a potential for African forestry ... 35
4.5.2 Critical issues ... 37
4.5.3 REDD in Ghana ... 41
5 Aims ... 43
6 Materials and methods ... 45
6.1 Study areas ... 45
6.1.1 Ghana ... 45
6.1.2 Jomoro District ... 46
6.2 Land use change assessment ... 73
6.2.1 Granite ... 73
6.2.2 Lower Birrimian ... 74
6.2.3 Tertiary sands ... 75
6.3 Sampling and field work ... 77
6.3.1 Interviews and social aspects ... 77
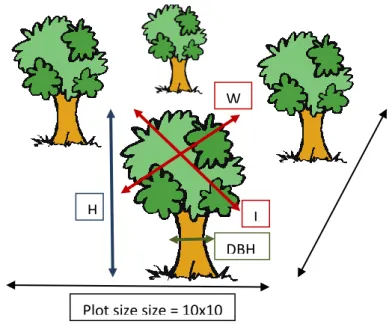
6.3.2 Soil sampling ... 80 6.3.3 Litter ... 84 6.3.4 Aboveground biomass ... 84 6.4 Data analysis ... 86 6.4.1 Soil analyses ... 86 6.4.2 Aboveground C pool ... 87 6.4.3 Belowground C pool ... 93
4
7 Results ... 94
7.1 Granite ... 94
7.1.1 Oil palm plantations... 94
7.1.2 Secondary forest ... 99 7.2 Lower Birrimian ... 103 7.2.1 Cocoa plantations ... 103 7.2.2 Rubber plantations ... 107 7.2.3 Coconut plantations ... 111 7.2.4 Mixed plantations ... 116 7.3 Tertiary sands ... 120 7.3.1 Rubber plantations ... 120 7.3.2 Coconut plantations ... 124 7.4 Socioeconomic aspects ... 129 8 Discussions ... 134 8.1 Granite ... 134 8.2 Lower Birrimian ... 136 8.3 Tertiary sands ... 137 9 Conclusions... 140 10 References ... 143 11 Acknowledgments ... 142 12 List of Tables ... 156 13 List of Figures ... 159 14 Annex I... 162
14.1 Brief story of cocoa in Ghana ... 162
14.2 Brief story of rubber in Ghana ... 163
14.3 Brief story of Oil palm in Ghana ... 164
15 Annex 2 ... 168
15.1 Soil profiles on Granite – Oil palm plantation ... 168
15.2 Soil profiles on Granite – Secondary forest ... 169
15.3 Soil profiles on Lower Birrimian – Primary forest ... 170
5
15.5 Soil profiles on Lower Birrimian – Rubber plantation ... 172
15.6 Soil profiles on Lower Birrimian – Coconut plantation (1/2) ... 173
15.7 Soil profiles on Lower Birrimian – Coconut plantation (2/2) ... 174
15.8 Soil profiles on Lower Birrimian – Mixed plantation ... 175
15.9 Soil profiles on Tertiary sands – Primary forest ... 176
15.10 Soil profiles on Tertiary sands – Rubber plantation ... 177
15.11 Soil profiles on Tertiary sands – Coconut plantation (1/2) ... 178
6
1 List of Acronyms
AGB Aboveground biomass
AFOLU Agriculture, Forestry and Other Land Use ANOVA Analysis of variance
BGB Belowground biomass C Carbon
CDM Clean Development Mechanism CO2 Carbon dioxide
CO2e Carbon dioxide equivalent
DBH Diameter at Breast Height
FAO The Food and Agriculture Organization of the United Nations FCPF Forestry Carbon Partnership Facility
FLEGT Forest Law, Enforcement and Trade GPG Good Practice Guidance
GPG-LULUCF Good Practice Guidance for Land Use, Land-Use Change and Forestry
GPS Global Positioning System GREL Ghana Rubber Estates Limited
IPCC Intergovernmental Panel on Climate Change IUCN International Union for Conservation of Nature
NREG Natural Resources and Environmental Governance Program REDD: Reducing Emissions from Deforestation And forest Degradation
REDD+ Reducing emissions from deforestation and forest degradation and the role of conservation, sustainable management of forests and
enhancement of forest carbon stocks in developing countries R-PIN Readiness Plan Idea Note
R-PP Readiness Preparation Proposal SD Standard deviation
8
2 Foreword
Climate change is perhaps the greatest environmental challenge emerged in the twenty-first century. It can be considered a source of the major global threats, such as hunger, poverty, armed conflict, displacement, air pollution, soil degradation, desertification and deforestation. These global issues are intricately intertwined and all contribute to climate change, necessitating a comprehensive approach to a solution (Stone and Chacón León, 2010).
The role of the African continent in the global carbon cycle, and therefore in climate change, is increasingly recognized (Houghton and Hackler, 2006; Williams et al., 2007). Of all the region in the world, Africa has contributed less than any other region to the greenhouse gas emissions, which are widely held responsible for global warming and consequently for climate change. But the continent is also the most vulnerable to the consequences and sub-Saharan Africa (SSA) is the least well equipped to face the issues related to climate change (Justice et al., 2005). In Sub-Saharan Africa the role of land use change in controlling CO2 emissions and annual C budgets at regional and global scale
may be more critical than in any other regions (Houghton and Hackler, 2006).
According to the IPCC in its Fourth Assessment Report, reducing and/or preventing deforestation is the mitigation option with the largest and most immediate carbon stock impact in the short term (UNFCCC, 2010). International community decided to face climate change problems related to deforestation, through specific policies to Reducing
Emissions from Deforestation and forest Degradation and the role of conservation, sustainable management of forests and enhancement of forest carbon stocks (referred as
REDD+). Deforestation and other land-cover changes typically release carbon from the terrestrial biosphere to the atmosphere as CO2 (carbon dioxide), while recovering
vegetation in abandoned agricultural or logged land removes CO2 from the atmosphere
and sequesters it in vegetation biomass and soil carbon. Emissions from land-use and land-cover change are perhaps the most uncertain component of the global carbon cycle, with enormous implications for balancing the present-day carbon budget and predicting the future evolution of climate change (Ramankutty et al., 2007).
A common paradigm about the reduction of emissions from deforestations estimated for the purpose of promoting it as a mitigation option in the context of the United Nations Framework Convention on Climate Change (UNFCCC) is the high uncertainties in input
9
data - i.e., area change and C stock change/area - that may seriously undermine the credibility of the estimates and therefore of reduced deforestation as a mitigation option. It is likely that the most typical and important example of incomplete estimates will arise from the lack of reliable data for a carbon pool (Grassi et al., 2008). Uncertain rates of tropical deforestation, account for more than half of the range in estimates of the global carbon flux. Three other factors account for much of the rest of the uncertainty: (1) the initial stocks of carbon in ecosystems affected by land-use change, (2) per hectare changes in carbon stocks in response to different types of land-use change, and (3) legacy effects; that is, the time it takes for carbon stocks to equilibrate following a change in land use (Houghton and Goodale, 2004).
Considering the source of uncertainty and the lack of field data for sub-Saharan Africa, it has been decided to place the study in the Ghana (Jomoro district, Western Region) where for more than 20 million Ghanaians, particularly people living in the rural areas, the forest is the only source of wood that is used locally as fuel wood, and for construction and furniture (Blay et al., 2007) and where deforestation annual rate reaches 2.19% for the period 2005-2010 (FAO, 2010).
The study will analyze the above mentioned gaps related to deforestation and land use change, by assessing: 1) initial carbon stocks (tropical rain forest), 2) per hectare changes in carbon stocks as consequence of deforestation followed by six different main land uses [tree plantations (rubber, coconut, cocoa, oil palm, mixed) and secondary forest], 3) dynamics of soil carbon stocks through the time considering chronosequences.
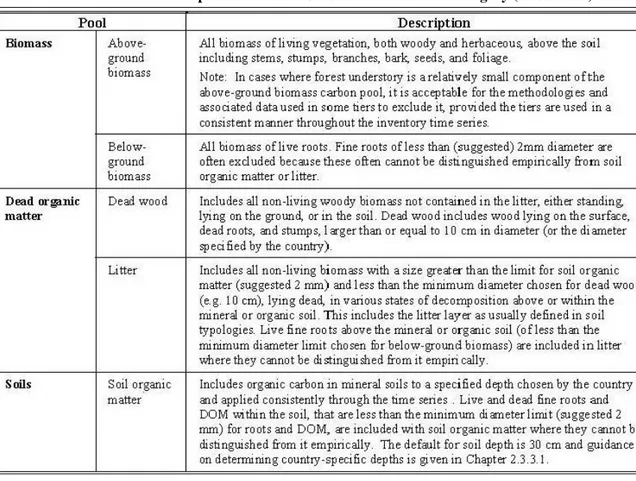
Moreover some specific carbon pool issue has been taken into consideration. When accounting changes in carbon stocks in the UNFCCC framework, it is required to consider 5 carbon pools that are: aboveground biomass, belowground biomass, litter, dead wood and soil. Within REDD+ mechanism there are not official methodologies but some guidelines developed for the voluntary standards (e.g. BioCarbon Fund- Methodology for
Estimating Reduction of GHG Emission from Mosaic Deforestation, Voluntary Carbon
Standard (VCS) - Tool for AFOLU Methodological Issues, etc.) and it is clear that only aboveground pool has to be always considered, belowground biomass is recommended and the others are facultative.
Evidence from official reports (e.g., UNFCCC 2005a, UNFCCC 2005b, FAO 2006) suggests that only a very small fraction of developing countries currently reports data on
10
soil carbon, even though emissions from soils following deforestation are likely to be significant in many cases (Grassi et al., 2008).
Despite the common understanding about the effects of deforestation on different compartment in terms of carbon variation - an increase or disappearance of biomass relatively visible, variations in soil carbon much less perceptible, even after a radical change in land use (Calmel et al., 2010) - this study brings in the spotlight the soil reaction to radical land use change in the long run demonstrating that it is not so trifle as commonly believed. Importance of considering soil carbon stock for accounting the land use change dynamics is not properly recognize in the international deforestation policies and its influence and role in mitigating climate change is nowadays neglected but it is really not negligible.
11
3 Sommario
I cambiamenti climatici sono forse la più grande sfida che il genere umano si trova a dover affrontare nel ventunesimo secolo e la risoluzione delle complesse conseguenze che questi cambiamenti hanno sulla vita di tutti noi, necessita un approccio globale e uno sforzo unanime (Stone and Chacón León, 2010). Di tutte le regioni del mondo, il continente africano è quello che contribuisce meno alle emissioni di gas serra ma allo stesso tempo è il più vulnerabile alle loro conseguenze. E‘ infatti ormani ampiamente riconosciuto il ruolo delle emissioni di gas serra nel riscaldamento globale e quinid dei cambiamenti climatici (Houghton and Hackler, 2006; Williams et al., 2007). In particolare l‘Africa Sub-Sahariana è la regione meno preparata ad affrontare le problematiche legate ai cambiamenti climatici (Justice et al., 2005) e soprattutto è la regione in cui i cambiamenti di uso del suolo possono avere implicazioni particolarmente negative nel controllo delle emissioni di CO2 e sul bilancio annuale di carbonio
(Houghton and Hackler, 2006). In base a quanto riportato ne Fourth Assessment Report dell‘IPCC, ridurre e prevenire la deforestazione è l‘opzione migliore per la mitigazione dei cambiamenti climatici dato il suo immediato impatto sugli stock di carbonio nel breve periodo (UNFCCC, 2010). La comunità internazionale ha deciso quindi di affrontare il problema della deforestazione attraverso specifiche politiche per ridurre le emissioni dovute alla deforestazione e alla degradazione delle foreste valorizzando il ruolo dellla conservazione, della gestione sostenibile e aumentando gli stock di carbonio delle foreste, tale meccanismo è conosciuto come REDD+ dal suo acronimo inglese (Reducing
Emissions from Deforestation and forest Degradation and the role of conservation, sustainable management of forests and enhancement of forest carbon stocks). Le
emissioni legate ai cambiamenti di uso e copertura del suolo sono forse la componente più incerta all‘interno del ciclo globale del carbonio, con enormi implicazioni per il bilancio attuale e per le previsioni di evoluzioni future dei cambiamenti climatici (Ramankutty et al., 2007). Questo condiziona perciò la credibilità delle stime che attestano la valità della riduzione della deforestazione come miglior opzione per la mitigazione dei cambiamenti climatici. La mancanza di dati affidabili sulle stime dei pool di carbonio ne è l‘esempio più tipico (Grassi et al., 2008). I tassi incerti della deforestazione tropicale rappresentano più della metà delle stime globali del flusso di carbonio. Tre altri fattori rappresentano più della restante parte di incertezza e questi
12
sono: 1) gli stock iniziali di carbonio nell‘ecosistema soggetto al cambiamento di uso del suolo, 2) cambiamenti ad ettaro degli stock di carbonio come risposta a differenti tipi di cambiamento di uso del suolo e 3) gli effetti a lungo termine considerati come il tempo necessario agli stock di carbonio per tornare ad una situazione di equilibrio dopo il cambiamento di uso del suolo (Houghton and Goodale, 2004). Considerando le fonti di incertezza e la mancanza di dati per l‘Africa sub-Sahariana, il presente studio è stato ha avuto come oggetto la realtà del Ghana (Jomoro district, Western Region) dove una popolazione di più di 20 milioni di persone e in particolar modo nelle aree rurali, dipende dalla foresta come unica fonte di legno usato come legna da ardere, per costruzioni e mobili (Blay et al., 2007) e dove il tasso annuo di deforestazione ha raggiunto il 2.19% nel periodo 2005-2010 (FAO, 2010). Il presente studio analizzerà quindi gli aspetti legati alla deforestazione e al cambiamento di uso del suolo stimando: 1) lo stock iniziale di carbonio della foresta pluviale, 2) i cambiamenti ad ettaro degli stock di carbonio come conseguenza della deforestazione seguita da sei diversi usi del suolo in particolare piantagioni di gomme, cocco, palma da olio, piantagioni miste e infine la foresta secondaria generata dall‘abbandono di terre prima destinate all‘agricoltura, 3) la dinamica degli stock di carbonio nel tempo tramite l‘analisi di cronosequenze. Alcuni specifici pool di carbonio sono stati presi in esame. Stimado i cambiamenti di stock di carbonio nel contesto dell‘UNFCCC vengono richiesti 5 pools che sono: la biomassa epigea, la biomassa ipogea, la lettiera, la necromassa e il suolo. All‘interno del meccanismo REDD+ non sono ancora state previste metodologie specifiche per la stima di questi pools ma sono state sviluppate alcune linee guida di carattere insicativo a cui poter far riferimento (es. BioCarbon Fund- Methodology for Estimating Reduction of GHG
Emission from Mosaic Deforestation, Voluntary Carbon Standard (VCS)- Tool for AFOLU Methodological Issues, etc.) ed è chiaro che il pool che deve sempre incluso
nelle stime rimanga la biomassa epigea mentre quella ipogea è raccomandata e gli altri pool sono facoltativi e discrezionali. Da report ufficiali (es., UNFCCC 2005a, UNFCCC 2005b, FAO 2006) emerge che solo una piccola parte dei paesi in via di sviluppo ad oggi include il pool del suolo nelle stime anche se le emissioni dal suolo a seguito di un processo di deforestazione risultano essere in molti casi significative (Grassi et al., 2008). A dispetto di quanto comunemente si crede riguardo gli effetti della deforestaizone sui differenti comparti in termini di variazione di carbonio, (un aumento o scomparsa della biomassa risultano relativamente visibili, mentre variazioni del suolo molto meno
13
percettibili anche dopo cambi radicali nell‘uso del suolo (Calmel et al., 2010), questo studio porta alla luce la reazione del comparto suolo a cambi radicali legati a processo di deforestazione nel lungo periodo dimostrando che il cambiamento non è così irrilevante come comunemente creduto. L‘importanza del considerare il suolo nelle dinamiche post deforestazione, non è adeguatamente riconosciuta nelle politiche internazionali e questo influenza il ruolo che il comparto suolo può avere nella mitigazione dei cambiamenti climatici oggi forse trascurato ma non certo trascurabile.
14
4 Introduction
4.1 Tropical forests and climate change
The rapid increase in atmospheric concentration of CO2 and other greenhouse gases (CH4,
N2O, NOx) since about 1850 has raised numerous questions of global significance.
Several are important: What is the role of tropical ecosystems as sources or sinks for atmospheric CO2, and how does the potential change in climate alter ecological processes
and basic function of such ecosystems? How do anthropogenic perturbations of tropical ecosystems affect atmospheric CO2 concentrations, and how would these ecosystems
function under raised levels of atmospheric CO2? What is the role of soils of tropical
ecosystems in the global carbon cycle, and what soil management options can exploit the full potential of these soils as major sinks for atmospheric CO2?
Forests are important carbon pools which continuously exchange CO2 with the
atmosphere, due to both natural processes and human action. Understanding forests' participation in the greenhouse effect requires a better understanding of the carbon cycle at the forest level. Organic matter contains carbon susceptible to be oxidized and returned to the atmosphere in the form of CO2. Carbon is found in several pools in the forest:
the vegetation: living plant biomass consisting of wood and non-wood materials. Although the exposed part of the plant is the most visible, the below-ground biomass (the root system) must also be considered. The amount of carbon in the biomass varies from between 35 to 65 percent of the dry weight (50 percent is often taken as a default value).
dead wood and litter: dead plant biomass, made up of plant debris. Litter in particular is an important source of nutrients for plant growth.
soil organic matter, the humus. Humus originates from litter decomposition. Organic soil carbon represents an extremely important pool.
African tropical rainforest (TRF) areas have been geologically stable for long periods of time and the soils have undergone intense weathering. In forest environments the nutrients are largely locked in the living vegetation. Once the forest is removed, the soil degrades rapidly as a result of microclimatic changes, and quickly loses its nutrient supply through leaching under the abundant rainfall (FAO, 2003). In the contest of the global C balance, land use practices are closely linked with C stock (Hairiah et al. 2001).
15
The impacts of the ongoing processes of land use change need to be assessed and efforts to store more C in terrestrial ecosystems need to be evaluated, in terms of their ability to slow down the rate of increase of atmospheric CO2. Data on soil C stocks are particularly
needed to stimulate C storage in the process of development. A reduction in organic inputs to the soil and/or accelerated losses after forest conversion to agricoltural land, lead to a decline in the more active (‗labile‘) C fractions in the soil with a depletion of 20-50 % of the original conditions for repeated cropping periods. These changes mainly caused by agricultural management i.e. residue removal via harvesting or burning, and soil tillage, influence crop productivity at a localised scale as well as the global C budget. So, to some extent, the interests of the farmer in maintaining soil fertility may coincide with interests at the global level in reducing the rate of increase of atmospheric CO2 (Hairiah et
al. 2001). Soil degradation, and in particular the decline of soil chemical fertility, is a major concern in relation to food production and the sustainable management of land resources. It also affects land use but the spatial and temporal effects of soil fertility change and its interaction with land cover change has to be investigated. Conservation and improvement of the natural resources on which agricultural production depends is essential (Hartemink et al. 2008).
At the global level, 19 percent of the carbon in the earth's biosphere is stored in plants, and 81 percent in the soil. In all forests, tropical, temperate and boreal together, approximately 31 percent of the carbon is stored in the biomass and 69 percent in the soil. In tropical forests, approximately 50 percent of the carbon is stored in the biomass and 50 percent in the soil (IPCC 2000).
Wood products derived from harvested timber are also significant carbon pools. Their longevity depends upon their use: lifetimes may range from less than one year for fuelwood, to several decades or centuries for lumber.
The oxidation of carbon found in organic matter and the subsequent emissions of CO2
result from the following processes: respiration of living biomass,
decomposition of organic matter by other living organisms (also called heterotrophic respiration),
combustion (fires).
The process of photosynthesis explains why forests function as CO2 sinks, removing CO2
16
carbon is integrated to complex organic molecules which are then used by the whole plant.
Figure 1: The carbon cycle in the forest (source: Mégevand 1998)
The participation of forests in climate change is thus three-fold: • they are carbon pools
• they become sources of CO2 when they burn, or, in general, when they are disturbed by
natural or human action
• they are CO2 sinks when they grow biomass or extend their area.
The earth's biosphere constitutes a carbon sink that absorbs approximately 2.3 Gt C annually. This represents nearly 30 percent of all fossil fuel emissions (totaling from 6.3 to 6.5 Gt C yr-1) and is comparable to the CO2 emissions resulting from deforestation, 1.6
to 2 Gt C yr-1.
The carbon cycle (photosynthesis, plant respiration and the degradation of organic matter) in a given forest is influenced by climatic conditions and atmospheric concentrations of CO2. The distinction between natural and human factors influencing plant growth is thus
sometimes very difficult to make. The increase of CO2 in the atmosphere has a "fertilizing
effect" on photosynthesis and thus, plant growth. There are varying estimates of this effect: + 33%, + 25%, and + 60% for trees, + 14% for pastures and crops (IPCC, 2001). This explains present regional tendencies of enhanced forest growth and causes an increase in carbon absorption by plants. This also influences the potential size of the
17
forests carbon pool. There are still questions regarding the long-term future of the biospheric carbon pool. Several bio-climatic models indicate that the ecosystems' absorption capacity is approaching its upper limit and should diminish in the future, possibly even reversing direction within 50 to 150 years, with forests becoming a net source of CO2. Indeed, global warming could cause an increase in heterotrophic
respiration and the decomposition of organic matter, and a simultaneous decrease of the sink effectiveness, thereby transforming the forestry ecosystems into a net source of CO2
(Scholes, 1999).
4.2 Tropical deforestation and land use change
By virtue of their size and biomass contained in them, tropical ecosystems are important to the global C cycle. Tropical rainforest ecosystems consist of approximately one-sixth of the deciduous forests of the world and occur between 6 to 10° north and south of the equator in South America, Africa, Southeast Asia and the Pacific. Primeval TRF covered more than 90% of the biome‘s land surface before the advent of humankind. Bruenig (1996) estimated that cumulative area of all TRF was 5.5 x 10⁶ km2 in 1975 and 4.4 in 1985. The area of TRF is projected to be 4.0 x 10⁶ km2 in 2000 and 3 x 10⁶ km2 in 2050. Bruenig (1996) estimated temporal changes in TRF (million ha) in tropical America from 1850 to 1985 as follow: 1850 1985 Evergreen 226 212 Seasonal 616 445 Open 380 211 Total 1222 868
The distribution of land area of the TRF in three continents and the rate of deforestation are shown in Tables 1 and 2. The types of vegetation in three ecoregions of Asia, Africa and tropical America are quite different from one another, highly variable or diverse (Jordan, 1983; Almeda and Pringle, 1988), and are characterized with a large quantity of above and below ground biomass. The annual addition of biomass in TRF (e.g. litter, branches and dead roots) in the mature forest is about 5 Mg ha-1 yr-1 compared with about 1 Mg ha-1 yr-1 in temperate forest. The range of organic matter return to the soil is 3 to 15 Mg ha-1 yr-1 in TRF compared to 1 to 8 Mg ha-1 yr-1 in temperate forests.
18 Table 1: Estimates of forest cover and deforestation in the humid tropics (1000 ha). Modified from NRG (1993).
Continent Forest Forest Annual rate of deforestation Rate of change
1980 1990 1981-1990 1981-1990 (% yr-1) Africa 289,700 241,800 4,800 -1.7 Latin America 825,900 753,000 7,300 -0.9 Asia 334,500 287,500 4,700 -1.4 Total 1,450,100 1,282,300 16,800 -1.2
Table 2: Tropical rainforests and the rate of deforestation. Modified from WRI, 1993; Soughate, 1998; and Faminow, 1998; Faminow estimated total TRF at 1756.5 M ha and the rate of deforestation at 15.4 M ha-1 yr-1
Region Area (106) Rate of deforestation
Central Africa 204,10 1.08
Tropical southern Africa 100,46 0.84
West Africa 55,60 0.53 South Asia 63,90 0.5 Southest Asia 210,60 2.8 Mexico 48,60 0.59 Central America 19,50 0.36 Brazil 561,10 3.42
Andean region and
Paraguay 241,80 2.25
Total 1,505,70 12.37
Estimates made for Forest Resource Assessment (FRA 2010), show that the world‘s forests store more than 650 billion tons of carbon, 44% in the biomass, 11% in dead wood and litter, and 45% in the soil. While sustainable management, planting and rehabilitation of forests can conserve or increase forest carbon stocks, deforestation, degradation and poor forest management reduce them. Deforestation and other land-cover changes as well as logging and intensive cultivation of cropland soils, typically release carbon from the
19
terrestrial biosphere to the atmosphere as CO2 (carbon dioxide), while recovering
vegetation in abandoned agricultural or logged land removes CO2 from the atmosphere
and sequesters it in vegetation biomass and soil carbon (Ramankutty et al., 2007; IPCC, 2007). Emissions from land use change (LUC) are the second-largest anthropogenic source of CO2. These emissions are partly compensated by CO2 uptake from the regrowth
of secondary vegetation and the rebuilding of soil carbon pools following afforestation, abandonment of agriculture (including the fallow phase of shifting cultivation), fire exclusion and the shift to agricultural practices that conserve soil carbon. Unlike fossil fuel emissions, which reflect instantaneous economic activity, LUC emissions are due to both current deforestation and the carry-over effects of CO2 losses from areas deforested
in previous years (Le Quéré et al., 2009). A central role has been taken by tropical deforestation and forest degradation which have dramatically increased in the last 100 years, and have accelerated since the 1960s as a result of mechanization, improved transport, the globalization of markets and other factors. Emissions from deforestation since 1850 have contributed to 90% of the emissions from land use change, resulting from a 20% decrease in forest area (Houghton JT et al., 2001). Emissions from land-use and land-cover change in terms of CO2 areestimated to be 5.9 Gt CO2 per year over the
1990s, although these estimates are perhaps the most uncertain component of the global carbon cycle, with enormous implications for balancing the present-day carbon budget and predicting the future evolution of climate change (Ramankutty et al., 2007; IPCC, 2007; UNFCCC, 2010). Deforestation and forest degradation may have released between 0.8 and 2.2 Gt C per year during the period 1990–2000, corresponding to 10–25% of the global human-induced GHG emissions in that decade (Houghton, 2003; DeFries et al., 2002). In addition, forest fires contribute to the release of GHG; for example, forest and peat fires in Indonesia in 1997/1998 may have released the equivalent of one-third of the aggregated annual anthropogenic carbon emissions in that period (World Bank, 1999; Page et al., 2002). Table 3 lists the countries with the highest total and relative deforestation.
20 Table 3: The ten countries with the highest absolute and relative deforestation rates in the world
*LDC countries in the UNFCCC. Source: (Forner et al., 2006)
Table 3 shows that the four countries with the highest annual deforestation together accounted for 51% of total tropical deforestation between 1990 and 2005. Estimates using data from 78 tropical developing countries indicate that the highest average deforestation between 1990 and 2005 occurred in Tropical South America1, (4.44 M ha yr-1) followed by Africa2 (4.1 M ha yr-1), and Tropical Asia and the Pacific3 (2.8 M ha yr-1). In relative terms, the highest annual deforestation rate is observed in Tropical Asia (0.88%), followed by Africa (0.69%) and Tropical America (0.53%). Sub-regions with the highest annual relative loss of forests between 1990 and 2005 were West Africa (1.65%) and Central America (1.05%). It is worthy to note that between 1990 and 2005, tropical deforestation progressed at an average rate of 11.3 million ha yr-1, a rate of 0.65% (Forner et al., 2006). For the world as a whole, carbon stocks in forest biomass decreased by an estimated 0.5 Gt annually during the period 2005–2010, mainly because of a reduction in the global forest area. The net change in forest area in the period 2000–2010 is estimated at -5.2 million hectares per year at the global level. Around 13 million hectares of forest were converted to other uses – largely agriculture – or lost through natural causes each year in the last decade (FAO, 2010). According to the IPCC in its Fourth Assessment Report, reducing and/or preventing deforestation is the mitigation option with the largest and most immediate carbon stock impact in the short term (UNFCCC, 2010). The conversion of forested land to uses such as agriculture represents in fact a radical change
1 Data from 10 countries 2 Data from 36 countries 3 Data from 18 countries
21
in the ecology of an area but knowledge of the longer-term implications of large-scale changes in the forest landscape – at national and global levels – is limited (Grainger, 1993; Kaimowitz et al., 1998). To worsen this situation there is the gap in deforestation and forest degradation assessment (Van der Werf et al., 2009). In detail, deforestation is the long-term reduction of tree canopy cover (Penman et al., 2003) to below 10–30%. In practice, deforestation is associated with the conversion of forest to other types of land use, such as cropland or pasture. Forest degradation is typically considered partial deforestation, with more than 10–30% of forest cover remaining (for example, through selective logging). Land degradation that does not involve changes in tree cover density, such as oxidation and combustion of deforested and drained tropical peatlands, may also involve substantial carbon emissions. However, losses of these non-forest carbon stocks are not generally included in deforestation and forest degradation assessments (Van der Werf et al. 2009). Tropical deforestation and forest degradation patterns are heterogeneous due to a wide array of drivers, where socio-economic factors play the greatest role in shaping local deforestation. Due to social, environmental and political complexities, the indirect nature of many of the causal relations and the wide diversity of situations, any attempt to generalize the causes of deforestation and forest degradation is difficult and ‗invites criticism‘ (Kaimowitz and Angelsen, 1999). However, there is evidence that deforestation and poverty are linked (Grainger, 1993; Kaimowitz et al., 1998) and that deforestation causes changes in local site conditions that can exacerbate natural disasters (Blaser and Husain, 2001). The essential role of forests in supporting life on Earth is highlighted by possibility of mitigating climate change by reducing carbon emissions caused by deforestation and forest degradation, and by increasing carbon uptake through afforestation and sustainable forest management. But forests are more than just carbon. At local to global scales, forests provide essential ecosystem services beyond carbon storage – such as watershed protection, water flow regulation, nutrient recycling, rainfall generation and disease regulation (GCP, 2008). In a time of economic crisis, it should be reminded that forests provide employment and livelihoods for a large proportion of the population – especially in developing countries – and often act as an economic safety net in times of need (FAO, 2010). Sustainably managed forests have multiple environmental and socio-economic functions important at the global, national and local scales, and play a vital part in sustainable development. Reliable and update information on the state of forest resources - not only on area and area change, but also on
22
such variables as growing stock, wood and non-wood products, carbon, protected areas, use of forests for recreation and other services, biological diversity and forests‘ contribution to national economies - is crucial to support decision - making for policies and programs in forestry and sustainable development at all levels (FAO, 2010). The future role of forests and particularly tropical forests in the global carbon cycle and the climate system is a function of future deforestation rates and the degree to which remaining forests will be sustainable or even increase their carbon stock. Deforestation rates are strongly influenced by economic development and international agreements about the protection of forest resources (Cramer et al., 2004). In developing countries, deforestation is the largest source of emissions from the forestry sector and it has remained at high levels since 1990 (FAO, 2005). The causes of tropical deforestation are complex, varying across countries and over time in response to different social, cultural, and macroeconomic conditions (Geist and Lambin, 2002). Broadly, three major barriers to enacting effective policies to reduce forest loss are: (i) profitability incentives often run counter to forest conservation and sustainable forest management (Tacconi et al., 2003); (ii) many direct and indirect drivers of deforestation lie outside of the forest sector, especially in agricultural policies and markets (Wunder, 2004); and (iii) limited regulatory and institutional capacity and insufficient resources constrain the ability of many governments to implement forest and related sectorial policies on the ground (Tacconi et al., 2003). Globally, land use has changed considerably in the past decades – mostly reflecting the enormous growth in human population and their need for food. The world‘s population has doubled since 1960. The developing world accounts for about 95% of the population growth with Africa as the world‘s fastest growing region. The growing population has many implications but most of all it requires an increase in agricultural production to meet food demand. This demand can be met by expansion of agricultural land or by intensification of existing systems. Conservation and improvement of the natural resources on which agricultural production depends is essential (Hartemink et al., 2008). Land use has generally been considered a local environmental issue, but it is becoming a force of global importance. Worldwide changes to forests, farmlands, waterways, and air are being driven by the need to provide food, fiber, water, and shelter to more than six billion people. Global croplands, pastures, plantations, and urban areas have expanded in recent decades, accompanied by large increases in energy, water, and fertilizer consumption, along with considerable losses of biodiversity. Such changes in
23
land use have enabled humans to appropriate an increasing share of the planet‘s resources, but they also potentially undermine the capacity of ecosystems to sustain food production, maintain freshwater and forest resources, regulate climate and air quality, and ameliorate infectious diseases. Human race faces the challenge of managing trade-offs between immediate human needs and maintaining the capacity of the biosphere to provide goods and services in the long term (Foley et al., 2005).
4.3 Africa
Africa has the world‘s lowest CO2 emissions. Climate change is now recognized as an
equity issue because the world‘s poorest people, those who contributed least to the atmospheric buildup of greenhouse gases, are the least equipped to deal with the negative impacts of climate change. Wealthier nations that have historically contributed the most to global warming are better able to adapt to the impacts. Addressing disparities between developed and developing countries is integral to the success of global climate change mitigation and adaptation (Osman-Elasha, 2009). Tropical terrestrial ecosystems across the African continent may play an increasing role in the global carbon (C) cycle with potentially significant climate change implications (Stephens et al., 2007), especially in sub-Saharan Africa where the role of land use change in controlling CO2 emissions and
annual C budgets at regional and global scale may be more critical than in other regions (Houghton and Hackler, 2006). New studies confirm that Africa is one of the most vulnerable continents to climate variability and change because of the range of projected impacts, multiple stresses and low adaptive capacity (IPCC AR4). The Intergovernmental Panel on Climate Change (IPCC, 2007a) has reported a warming of approximately 0.7 °C over most of the African region during the twentieth century. This warming occurred at the rate of about 0.05 °C per decade, with slightly more warming in the season from June to November than from December to May. A temperature rise of about 0.1 °C per decade is expected for the next two decades, even if greenhouse gas and aerosol concentrations are kept at year 2000 levels. IPCC has reported that extreme events, including floods and droughts, are becoming increasingly frequent and severe. Certain regions of Africa are more prone to such extreme events than others. It is probable that the increased frequency of recorded disasters is a result of a combination of climatic change and socio-economic and demographic changes. Habitats and ecosystems in Africa are currently under threat from a variety of stresses such as deforestation, land degradation and heavy dependence
24
on biomass for energy (United Nations, 2007). Furthermore Africa‘s vulnerability to climate change is exacerbated by a number of non-climatic factors, including endemic poverty, hunger, high prevalence of disease, chronic conflicts, low levels of development and low adaptive capacity. The average income per capita in most African countries is lower now than it was 30 years ago. Of the 25 countries in Africa that faced food emergencies in 2003, ten are currently experiencing civil strife and four are emerging from conflicts. Conflicts often divert scarce resources into military budgets and away from development needs, and result in high numbers of internally displaced persons and refugees. Other non-climatic factors adding to Africa‘s vulnerability include heavy dependence on primary products; poor governance and weak institutions; low capital investment; lack of access to foreign markets; poor infrastructure; inadequate technology transfer; and continuing high levels of external debt, fast-growing population, leading to pressure on already degraded landscapes above all on forest resources, deforestation and forest degradation (Osman-Elasha, 2009). African forests contain large carbon stocks in biomass, up to 255 Mg C ha−1 in tropical rainforests (Palm et al., 2000), that appear to be particularly vulnerable, mainly due to the impact of climate change, land use change, population increase and political instability. Africa‘s land use pressures will undoubtedly increase in the next years and the forecasted increase in drought and temperature can lead to a significant decrease in ecosystem carbon stocks in tropical forests and savanna, at least without human countermeasures (Tan et al. 2009). Previous studies on the African continent C budget focused only on either forests or conversion of forest to cropland (Houghton and Hackler, 2001, 2006). In fact, human activities such as cutting, fuelwood harvest, fertilization, and other factors affecting net primary productivity also play a critical role in regional and global C budgets (Tan, 2009). Despite the increasingly acknowledged importance of Africa in the global carbon cycle and its high vulnerability to climate change due to both ecological and socio-economic factors, there is still a lack of studies on the carbon cycle in representative African ecosystems, in particular tropical forests (Bombelli et al., 2009). Sustainable development in Africa cannot be addressed effectively without accounting for the impacts of climate change on agriculture, conflicts and disease patterns, all of which have particular impact on the poor. Sustainable development and adaptation are mutually reinforcing; an important conclusion of IPCC is that adaptation measures, if taken up in the sustainable development framework, can diminish negative impacts from future climate change (Osman-Elasha, 2009).
25
4.4 Ghana context
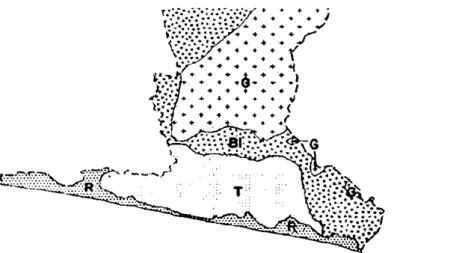
Ghana lies between longitudes 3° 15‘ W and 1° 12‘ E, and latitude 4° 44‘and 11° 15‘ N. The country is bordered on the East by the Republic of Togo, the West by Cote d‘Ivoire, the North by Burkina Faso and the South by the Gulf of Guinea. The total land area of Ghana is 238,533 km2 with an Exclusive Economic Zone (EEZ) of 110,000 km2 of the sea, forming the territorial area of Ghana. Ghana has a coastline of 550 km2. The country is under the influence of the tropical humid climatic conditions and experiences two major seasons, namely the rainy season and dry season, brought about by the harmattan, a dry dusty wind that blows along the northwest coast of Africa. The mean minimum rainfall is 900 mm yr-1 occurring around the Southeastern part of Ghana (Accra-Aflao) while the mean maximum rainfall is about 2000 mm yr-1, occurring in the southwestern portions (Axim). Mean minimum temperature ranges from 21 °C to 23 °C and mean maximum temperature is from 30 °C to 35 °C. The mean annual evapotranspiration rate is low in southern Ghana (80 mm) and higher in the north (190 mm). There are six vegetation zones in Ghana. These are the Savannah (Sudan, Guinea and Coastal), Forest-Savannah Transitional Zone, The Semi-Deciduous Forest Zone, and the Rain Forest Zone. Human activities and natural pressures have considerably changed the natural vegetation (Tamakloe, 2000).
Figure 3 – Map of Ghana (right) and its location within the African continent (left).
Surface Area: 239, thousand sq km Capital: Accra
Population: 23,350,927 (2008 estimate) Official Language: English
Nationalities: multi ethnic with 45 languages
Chief earners: Cocoa, gold, timber, diamonds, bauxite and
manganese
26
4.4.1 Historical evolution of forest policy in Ghana and its impact on deforestation and forest degradation
Forest resources have played a central part in Ghana‘s historical development, and continue to do so to this day. However, with few exceptions, Ghana‘s high forest areas are now in a severely degraded condition, and it is recognized that without urgent and radical remedial action, this could lead to a major knock-on effects for agriculture and the environment (volume and incidence of rainfall, atmospheric humidity, watersheds, soil and water conservation, etc.) and for the country‘s ability to adapt to the predicted levels of climate change (FC, 2010).
Ecologically, Ghana is dominated by dry savannas in the north and east and a ―high forest zone4‖ in the southwest. The remnant high forests are part of West Africa‘s Guinean forests, one of 25 biodiversity hotspots worldwide (Hall and Swaine, 1981; Kotey et al., 1998). About one-fifth of the estimated remaining forests in Ghana‘s high forest zone are officially gazette as forest and wildlife reserve. Forests play a crucial socioeconomic role in Ghana, providing employment and subsistence resources for many of the country‘s 24 million people; the forest sector is the country‘s fourth-largest earner of foreign exchange (Mayers et al., 2010). Many of the early colonial legal enactments (e.g. the 1894 Crown Land Bill and the 1897 Lands Bill) were aimed at securing wholesale control over ―waste and uncultivated‖ forestlands. These were resisted successfully by local activist groups and ultimately overturned. In 1911, however, the colonial government enacted the Forest Ordinance, which established procedures for gazetting forest reserves and set out a long list of prohibitions and restrictions on forest use by local communities (Mayers et al., 2010). After much opposition from traditional landowners, a new ordinance was enacted in 1927 that maintained the rights of local chieftaincies over forest reserves but clearly established the role of the colonial government‘sagent - the Gold Coast Forest Department - in supervising and managing the forest reserves (Amanor, 1999).
The upshot of colonial policy was that it established the conditions for large-scale deforestation in Ghana, which commenced in the first half of the 20th century with the state-sanctioned conversion of forested land to farmland. Inside the forest reserves the emphasis was on forest management by the state, but beyond their boundaries the main
4
The high forest zone is a high-rainfall zone that makes up about one-third of the country and was once largely covered by forest.
27
focus was on maximizing the exploitation of forest in the expectation that it would be converted to farmland. Since then, the production of palm oil, rubber and especially cocoa has been the major driver of land-use change in the high forest zone. Deforestation accelerated in the second half of the 20th century and the stock of trees outside forest reserves declined rapidly (FC, 2010).
At least part of the reason for this was a change in the way that tree ownership was defined and revenues were shared. Prior to 1962, landowning communities were entitled to no less than two-thirds of the gross revenue generated in forest reserves. Under the 1962 Concessions Act, however, that entitlement was cancelled and revenue was used to first pay the running costs of the Forestry Department, with a proportion of any remaining money returned to local authorities and communities (Treue, 2001). Even more significant, perhaps, was a provision in the Concessions Act to ―vest of all timber resources in the Office of the President.‖ As Amanor (1999) pointed out, this effectively institutionalized the myth that farmers had no rights over naturally occurring timber trees growing on their own land. Deforestation and forest degradation were exacerbated in the 1980s by a push from Ghana‘s donors for economic ―structural adjustment‖ that supported the acceleration and expansion of timber exports to increase revenue (Benhin and Barbier, 2000; Kotey et al., 1998).
More recently, deforestation has resulted from the expansion of food crops, tree crops such as cocoa, and logging, underpinned by drivers such as over-capacity in the forest industry, market and policy failures, and burgeoning urban and rural populations. In addition, the relatively recent introduction of full-sun cocoa varieties, which perform well without the shade trees required by traditional cocoa production systems, combined with other factors such as the lack of clear tree-ownership rights, has significantly reduced the presence of on-farm trees (Mayers et al., 2010). Despite reforestation and afforestation projects and participatory forest management practices, deforestation occurred at an annual rate of 1.8% between 1990 and 2005, and Ghana currently loses about 65,000 hectares of forest per year (Marfo, 2010). A recent IUCN analysis (IUCNb, Förster 2008) showed that most of the substantive blocks of forestland outside forest reserves that existed in Ghana‘s Western Region in 1990 had been converted to other land uses by 2007 (Figure 2).
28 Figure 2: Land-use cover change in the Western Region, Ghana, 1990-2007 (source: Förster, 2008)
Estimates of the total annual timber off-take in Ghana range from 3.3 to 4 million m3. Some 70% of this off-take is unrecorded (and by implication illegal) and it is uncertain what proportion is derived from reserve forests (only 600,000 m3 according to official figures although the real figure is likely to be substantially higher). This estimated off-take is 3–4 times greater than the volume considered by the Forestry Commission to be sustainable (Parren et al., 2007; Nketiah et al. 2009).
In drier areas and transition zones, wildfire is a major problem, with charcoal production and fuelwood collection also contributing to deforestation in off-reserve areas (Katoomba, 2009). Degradation in the off-reserve areas of the high forest zone is proceeding at an even greater pace. The timber industry is close to crisis point, with off take more than three times the sustainable harvest level, and the supply declining rapidly in both quantity and quality. A number of influences account for this situation, both forest sector and extra-sector. Major influences include (a) population growth and increasing demand for timber and agricultural products, both nationally and internationally; (b) the poor governance of the forest sector, which has led to massive over-capacity, to an industry structure unconducive to high value added, and to a thriving market for ‗illegal‘ chainsaw lumber; (c) conversion to agriculture, particularly for production of cocoa, the main crop in the high forest zone; (d) bush fires, especially in the transition and savannah zones; (e) minerals extraction. Agro-industries and large scale commercial productions
29
have not been major causes hitherto. However, demand is growing for oil palm and other oils and biofuels, and for export crops such as pineapple but sill the most pressing requirement, and the factor likely to have the greatest impact on forest cover, is yet to be addressed (FC, 2010). The demand for agricultural and wood products is growing locally as well as internationally; farming systems have undergone only limited technological development, however, and there remains a high dependency on swidden agriculture (FC, 2010). This is the need for incentives for tree conservation and planting in the high forest zone. A radical reform of tree tenure in the off-reserve areas could well be required, to increase the tenurial rights of farmers and land owners. Implementing the reform would also be challenging, as land markets have a long history in the forest areas, and conflicts already exist over land claims in many areas (FC, 2010).
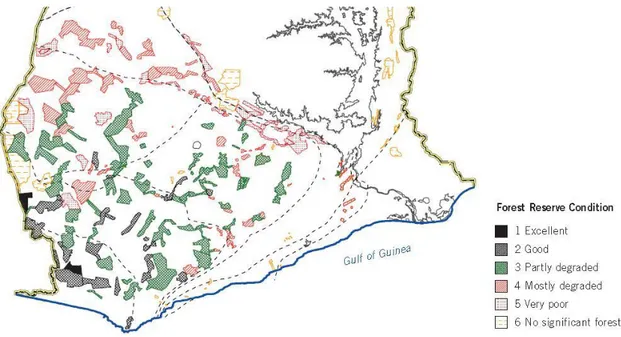
As far back as 1995, Hawthorne and Abu-Juam indicated that less than 16% of Ghana‘s high forests remained in good condition mostly in the wetter southwestern corner of the country (Figure 3). It is reasonable to assume that this percentage may have further declined in the intervening years (Mayers et al., 2010).
Figure 3 : Forest reserve conditions map of Ghana’s high forest zone.
Deforestation and forest degradation are ‗slow drip‘ phenomena in Ghana. This process is largely one of long-term and progressive degradation, without any dominant deforestation drivers, though forest loss is nevertheless occurring at a significant rate (FC, 2010). This may be because most of the accessible rainforests are still shrinking due to the combined
30
effect of forest fires, logging, agricultural colonization, mining activities and wild land fires and. It is believed that at the start of the 1900‘s, one-third of Ghana‘s 238,500 km2 land area was covered by natural tropical forest (Wagner and Cobbinah, 1993). By 1989, Hawthorne (1989) estimated that only about 22 % (18,000 km2) of the original tropical forest remained or that 78 % of Ghana‘s tropical forest had disappeared (Repetto, 1990). In more recent times the trend is not changed, since 1990, when forests cover an area of 7,448,000 ha, there is been a gradually disappearance of forested areas up to reach 4.940.000 hectares in 2010 (FAO 2010a). Nevertheless, this suggests that tropical forests in Ghana face an ever-increasing set of pressures resulting in the loss of forest and associated biodiversity throughout most of Ghana. Unfortunately, these forests support vital economic and ecological functions, providing commercial trade and employment opportunities (Wagner and Cobbinah, 1993). For more than 20 million Ghanaians, particularly people living in the rural areas, the forest is the only source of wood that is used locally as fuel wood, and for construction and furniture. The forests also provide a suitable environment for farming practices such as cocoa cultivation (Blay et al., 2007). Although Ghana is the second world‘s leading producer of cocoa, Ivory Coast now accounts for 38% of global production with Ghana second at 21% (UNCTAD, 2005), the crop remains the bedrock of the agricultural economy in the High Forest Zone (HFZ). The overall production trend is rising (Vigneri, 2007). For over a century, cocoa has been the major driver of land use change in the HFZ. The area under cocoa is now about 1.270.000 ha, comparable to the total area of forest under protection. Cocoa production in Ghana uses low-technology methods, with the heaviest inputs being labor for clearing and weeding, and chemicals for spraying against disease. Cocoa farm holdings are typically small, about 2-8 ha, though the range is wide, and some holdings are substantial (FC, 2010). For this reasons Cocoa can be considered a synonymous with the economy of the high forest zone but its production inevitably implies some loss of forest cover, but degradation has been much increased in recent years by the introduction of new full-sun hybrid varieties. Reversion to the shade-dependent traditional varieties would have much to commend it, as it would not only improve tree cover on the farm but might also revive support within the farming community for the policy of forest reservation, with attendant atmospheric benefits. Unfortunately the declining area available for food crops is pushing farmers to favor open-field varieties, in part because of their inter-cropping potential, despite long-term sustainability concerns (FC, 2010). Other causes of degradation
31
associated with rural livelihoods, such as shifting cultivation and fire in the agricultural and pastoral cycles, have long exercised the authorities. However, without viable alternatives well adapted to the low purchasing power of the rural majority, little headway has been made on finding substitute livelihoods. There is also strong hostility to charcoal and fuelwood production though, again, the high demand from consumers cannot easily be ignored. Neither should it be assumed that charcoal production systems are universally destructive of forest cover, for some systems could well be sustainable, and may represent optimal use of marginal scrub lands (FC, 2010). This view that the rural household is dependent on forest resources is a well-shared one among researchers and development practitioners (Appiah et al., 2007). In recent years, there has been increasing interests to understand the contribution that forest resources make to local employment, income and the wellbeing of rural communities (Arnold and Townson, 1998; Mamo et al., 2007). With few exceptions (Mamo et al., 2007), however, the level of rural dependence on forest resources have often been overlooked in poverty surveys (Cavendish, 2000). There is very little investigation on the level of dependence across different socioeconomic groups. Empirical information on dependency of forest resources may help to improve macro-level poverty estimates and serve as an input into conservation policy, particularly the establishment of protected areas by determining the potential loss to rural dwellers that would have reduced access to forest resources (Mamo et al. 2007). Since forest is the source of many products on which the local people depend, complete protection of remaining natural forests, although highly desirable, faces socio-economic constraints, which makes such a goal difficult or impossible to achieve. Therefore, to manage the existing level of forest cover or increase it, efforts of the government of Ghana to curb deforestation have revolved around the promotion of economic development through the promotion of reforestation and sustainable utilization of natural forest resources with local involvement (Blay et al., 2007). Their approach essentially puts local people in the centre of forest resources management with the understanding that local communities are significant players in forest management and are believed to have a significant understanding of their local environmental problems (Hares et al., 2006). Thus, their perceptions in deforestation discussions cannot be ignored (Lawrence, 2000). However, collaborative management faces problems of differing views in terms of forest management goals, methods, utilization, and preferences, particularly between different stakeholders such as the government and local people. This has often resulted in the
32
failure of many community- based forest management projects that had good chances of success (Appiah, 2007).
4.5 The role of forests in the international policies
Land use and land cover changes, including legal and illegal deforestation, are amongst the most important factors that contribute to the social and environmental challenges facing mankind in the 21st century (Goez, 2010). Deforestation alone is responsible for about 12-15% of the world's anthropogenic greenhouse gas (GHG) emissions, whereas another 6% stems from peat oxidation and fires on degraded peatland areas (Van der Werf et al., 2009). The combined effects of logging and forest regrowth on abandoned land are responsible for 10-25% of global human-induced emissions (Achard et al., 2002; Gullison et al., 2007).
Since project activities to reduce emissions from deforestation were excluded from the Kyoto Protocol‘s Clean Development Mechanism (CDM), obtaining support to address this source of emissions has been among the top priorities of developing countries in discussions about a future climate regime (Goez, 2010; Ghazoul et al., 2010). Kyoto Protocol sets out the rules for ―Land use, land-use change and forestry‖ (LULUCF) activities in Articles 3.3 and 3.4 and in decision 16/CMP.1. According to Article 3.3 Annex I countries (developed countries) must count afforestation, reforestation and deforestation since 1990 towards their emission reduction targets for the period 2008-2012 (first commitment period). Under Article 3.4 Annex I countries can choose to include revegetation, forest management, cropland management and/or grazing land management (UN, 1998)5. The international community through the United Nations Framework Convention on Climate Change (UNFCCC), now recognizes reducing emissions from deforestation and forest degradation and carbon stock enhancement (REDD+)6
as a critical component of national and international strategies for mitigating global climate change and for providing financial incentives to conserve rather than exploit forests, but this premise was reached through a long path. The expression REDD was used for the first time in its shortened form RED (Reducing Emissions from Deforestation) during the 11th UN Conference of Parties (COP 11) in Montreal (2005) by
5 Available at: http://unfccc.int/resource/docs/convkp/kpeng.pdf 6 REDD+ (Decision 1/CP.13; UNFCCC 2007).
33
the Coalition for Rainforest Nations led by Papua New Guinea (FGCC, 2010). This reference was part of an advocacy strategy aimed at promoting compensation payments for developing countries that reduce their national rates of deforestation. Well received at COP 11, the concept was further elaborated, expanded and officially adopted during COP 13 in Bali, Indonesia in 2007 in the form of REDD. The addition of Degradation to this acronym was due to the observation that forest degradation in some developing countries was as threatening as deforestation (if not more) to the forest ecosystems. Following the debates during the 14th COP in Poznan, Poland in 2008, it was decided that REDD should evolve to REDD+ to encompass all the initiatives that can increase the carbon absorption potential of forests. The insertion of '+' on the acronym REDD is aimed at broadening its scope to include all operations associated with preservation, restoration and sustainable management of forest ecosystems. The official definition of REDD+ as set by UNFCCC is as follows: ―reducing emissions from deforestation and forest degradation in
developing countries, and the role of conservation, sustainable management of forests and enhancement of forest carbon stocks in developing countries” (UNFCCC Decision
2/CP.13–11). Following the clarification of its identity and mission, REDD+ won greater importance and since 2008 it has become one key tool for tropical forest countries in the negotiations on climate change under the United Nations (FGCC, 2010). Natural forest protection (and specifically REDD+ which additionally recognizes reforestation and sustainable management of forests) was recognized as key to reducing global carbon emissions with the ‗Copenhagen Accord‘ during the COP 15 held in Copenhagen in 20097 (Ghazoul et al., 2010). Afterwards with the COP 16 held in Cancun in 2010, the UNFCCC agreed to consider REDD+ as an instrument able to alter the situation for developing countries including the implementation of the following mitigation actions: (a) Reducing emissions from deforestation;
(b) Reducing emissions from forest degradation; (c) Conservation of forest carbon stocks;
(d) Sustainable management of forest; and (e) Enhancement of forest carbon stocks.
This means that, potentially, all forest resources in developing countries are subject to accountable mitigation actions. The issues addressed at Cancun focused on forests in
34
particular were REDD+, forest management accounting rules for Annex 1 countries under the Kyoto Protocol, and discussions of including ―forests in exhaustion‖ under the CDM (FAO, 2010b).
The long-awaited decision on REDD+, under discussion for the past five years, confirms the scope of REDD+ and outlines principles as well as safeguards against negative social and environmental impacts of REDD+ actions. Countries are requested to develop national strategies and action plans for REDD+, a national/sub-national forest (emissions) reference level(s), a national forest monitoring system for the monitoring and reporting on REDD+ activities, and a system for providing information on how the safeguards are being addressed and respected. A phased approach, from strategy development to pilot activities, is adopted. SBSTA (Subsidiary Body for Scientific and Technological Advice) is requested to work on methodological issues on REDD+, including on methods to estimate emissions and removals from REDD+ activities and modalities for developing forest reference (emission) levels and a national forest monitoring system for monitoring and reporting on REDD+ activities and to report to COP17.
35
4.5.1 Economic instruments for developing countries and a potential for African forestry
The climate change negotiations, have produced different economic instruments for developing countries. Some of them are already operational, some are still being developed, and others depend on the ratification of the Kyoto Protocol. REDD+‘s main goal is thus to reduce the carbon emissions from deforestation in developing countries and increase their carbon storage capabilities through sustainable forest management programs. Two major principles underlie the REDD+ mechanisms:
1. Adequate financial compensation should be provided to developing countries in exchange for their efforts to preserve their natural forests, or to participate in sustainable forest management (SFM) initiatives.
2. Financial compensation should be attractive enough to developing countries that, when given the option to preserve or clear forestland, they opt for conservation.
There is an overall agreement in the ongoing negotiations on a three phase approach to REDD+ initiatives:
Phase 1 is characterized as the ‗readiness‘ phase. Countries prepare their national REDD+ strategy by organizing multi-stakeholder consultations, building capacity for monitoring, reporting and verification (MRV) and undertaking demonstration activities.
Phase 2 is characterized as the ‗more advanced readiness‘ phase. Countries focus on the development of implementing policies and measures to reduce emissions as outlined in the national strategy.
Phase 3 is referred to as the full UNFCCC ‗compliance‘ phase. In this phase, tropical forest countries are compensated exclusively for quantified reduced carbon emissions and removals, resulting from enhanced carbon stocks, based on agreed reference levels. Although the mechanism has been recently defined by a COP decision, REDD+ activities are already implemented around the world. REDD + financial resources comes from five major institutional arrangements and mechanisms:
1. The global multilateral donors. This group is dominated by the UN-REDD Programme and two World Bank institutions: the Forest Carbon Partnership Facility (FCPF) and the Forest Investment Program (FIP). The Interim REDD+ Partnership created in Paris during the May 2010 conference on forests and climate change could also