Università di Pisa
Facoltà di Economia
Corso di Laurea in Scienze economiche
TESI DI LAUREA SPECIALISTICA
The interplay between demography, epidemiology
and the economy:
the impacts of HIV/AIDS in Sub-Saharan Africa.
Candidato
Marco Boeri
Relatore
Correlatore
Prof. Piero Manfredi
Prof. Carlo Bianchi
Abstract
During the last century Africa started to experience the Demographic Transition. In particular most Sub-Saharan African countries have already experienced a substantial decline in mortality, and have also experienced some decline in fertility. In the span of three decades of HIV pandemic the impact of AIDS on mortality, in countries with intermediate and high prevalence, has already been substantial. In high-prevalence countries life-expectancy has experienced a dramatic decline as a consequence of the super-mortality from AIDS. For instance in Botswana and Zimbabwe life expectancy declined from about 60 years in 1990 to about 35-36 years in 2005 (UNAIDS 2007). Therefore HIV/AIDS has been able to revert the level of general mortality of these populations to levels that were observed at the beginning of the DT. It is therefore trivial to remark that HIV/AIDS is, at least, substantially delaying the timing of the mortality transition in these countries. An important question is then:
“to what extent can the super-mortality from AIDS affect the demographic transition and the related patterns of economic growth?”.
In order to find an answer to this question we elaborated a dynamic model to simulate the impact that the interplay between the DT and HIV can have on economic growth. First we developed a demo-epidemiological model using real data to evaluate the impact of HIV on the DT under two main scenarios:
A) INELUCTABLE: in this scenario we simply assume that even under circum-stances of high HIV/AIDS prevalence the fertility and the mortality from causes different from AIDS are unaffected and continue their transitional trend.
B) HOMEOSTATIC: even if the transition of mortality from causes different from AIDS remains ineluctable, the fertility transition is stopped by the mortality relapse, and an epoch of HIV-induced fertility relapse occurs. This is a way to incorporate the evidence (Kalemli-Ozcan 2006,2008) that the AIDS generated decline in life expectancy could lead to a potentially significant fertility relapse.
Next we developed an expanded economic growth model "a la Solow" to investigate how an HIV/AIDS epidemic, affecting population growth (in particular labour force growth), could affect the process of economic growth.
Acknowledgements
This research project would not have been possible without the support of many people who I would like to thank.
I would like to express my gratitude to my supervisor Prof. Piero Manfredi, whose expertise, understanding and patience added considerably to my university experi-ence. He has been the first academic professor who believed in my skills and capaci-ties. I appreciate his vast knowledge and skills in many areas, his multidisciplinary approach and his assistance in writing reports (i.e. abstract for congress, articles, scholarship applications and this thesis).
I would also like to thank Prof. Carlo Bianchi for his lessons in econometric, linear algebra and programming and for being my second supervisor in this dissertation. I would also like to thank my friends in this faculty; Dr. Luca Faustini for our conversations on many topics and issues, Dr. Linda Porciani, for her helps in data collection; Giorgio, Federico, Francesca, Aurelio for our collaborations. Thanks also goes to Alessandro and Samantha for all the beautiful moments spent together be-tween lessons and exams, for their friendship and their helps in my studies.
Very special thanks goes to Prof. Elena Carpi without whose motivation and en-couragement I would not have considered a postgraduate career as next step. Elena is the one professor/teacher who truly made a difference in my life. It was speaking with her that I understood how to discover which could be the right decision for my future. She provided me with experience and helps and became more of a mentor and a friend than a professor.
Thanks to Prof. Marco Guidi and Dr. Rosanna Medaglia for our experience in Leonardo da Vinci Project "Francigena".
Thanks to Heather and Fabio, Ritesh and Reena for their editing efforts and helps for this English dissertation.
Thanks also goes out to Davide, who provided me with mathematical advice at time of critical need; to Emanuela, Vera, Emiliano, Martina, Mario, Claudia and Nikola for their friendship and for all the experiences we lived together.
Thanks to my cousin Stefano and Sabina for our walks and swims and for all our laughs.
Thanks also goes to the AIESEC team and to the students who run with me to rep-resent other students in faculty council; I discovered with all these guys how achieve our goals having fun.
Special thanks to Antonino Russo, Alessandro Rossi, Alessandro Giudici, Selene Walquiria Caballero, Michele, giuseppe, Laura, Paola, Oriana, Angela and to all the other guys who worked with me in faculty and extra-faculty projects, for all the moments, the efforts, the successes and failures I faced joint you: thanks.
I would also like to thank all my friends in "Scienze per la pace": especially Alice, Attilio and Sara for our discussions, Meri, Luana, Eleonora, Irene, Elena, Percy, Veronica, Ilaria and all the other guys I met in this wonderful inter-faculty; for their opinions, their efforts and their critiques.
I must also acknowledge all the colleagues in Ducato Spa that shared with me so many projects and "great opportunities" in the company where we worked together for more than two years.
Appreciations also goes out to Giuliana Tamorro and all the staff who work hard in the computer center of the economy faculty to permit us to work on efficiently computers, to all the people in the faculty staff, for every moment spent together looking for solutions, book or department/faculty councils and to all the professors members in every board I participated during my university career.
I would also to thank my family for the supports they provided me through my entire life and in particular, last but not least, I want to acknowledge my wife and best friend Stefania, without whose love, efforts, understanding, persistence and editing assistance I would not have finished this thesis and not only:
Contents
Introduction I
1 The Demographic Transition 1
1.1 A Review of classical literature . . . 1
1.2 A Simple Demographic Transition Model . . . 3
1.2.1 A mathematical representation . . . 5
1.3 Mortality and Epidemiology Transition . . . 6
1.4 Fertility Transition: a literature review . . . 8
2 African Data Analysis 13 2.1 Northern Africa . . . 14
2.2 Western Africa . . . 15
2.3 Eastern Africa . . . 16
2.4 Central Africa . . . 16
2.5 Southern Africa . . . 17
2.6 Demographic Dynamics: TFR and TRR . . . 19
2.7 Lotka’s r and the impact of HIV/AIDS . . . 21
3 The demographic dividend 25 3.1 Understanding the demographic dividend: a literature review. . . 26
3.1.1 How does the demographic dividend work? . . . 27
3.2 The importance of the policy environment . . . 28
3.3 The African Case . . . 29
4 Economic Growth Models 33 4.1 Solow Model . . . 33
4.1.1 Solow without technical progress . . . 34
4.1.2 Solow with technical progress . . . 38
4.1.3 Golden Rule of Accumulation . . . 40
4.1.4 Analysing the Solow model . . . 41
4.2 Mankiw, Romer and Weil Model . . . 47
4.3 McDonald: Inclusion of Health capital within Mankiw Romer and Weil Model . . . 54
5 Epidemiological models 57
5.1 Mathematical introduction . . . 57
5.2 A discrete epidemiological model with 2 groups . . . 60
5.2.1 The mathematical representation . . . 60
5.2.2 Mathematic in the discrete model . . . 61
5.3 The continuous model . . . 63
5.3.1 Mathematic in the continuous model . . . 63
5.3.2 The Model . . . 65
5.4 3x3 Model and generalization . . . 70
5.5 Conclusions . . . 73
5.5.1 R0 and the contact distribution: . . . 73
5.5.2 Eigenvectors and epidemic structure. . . 74
6 HIV/AIDS and population dynamics 77 6.1 Anderson & May Model: Exponential population growth . . . 78
6.1.1 Qualitative analysis for the basic model . . . 79
6.2 From exponential growth rate to Demographic Transition . . . 85
6.2.1 The basic models . . . 87
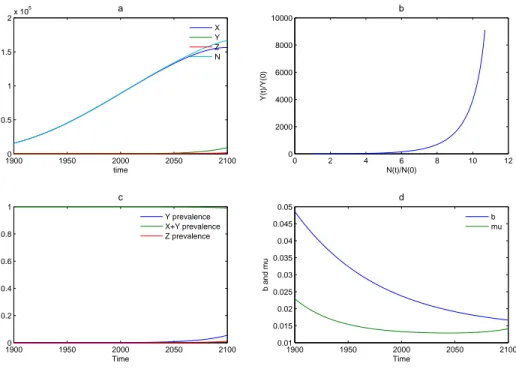
6.3 Model 1: The "Ineluctable DT" Scenario . . . 88
6.4 The "Ineluctable DT" scenario (M1F1): results . . . 88
6.4.1 Exponential decrease of population rates . . . 88
6.4.2 From Exponential to Logistic decrease of population rates . . 93
6.4.3 Simulation with real data . . . 94
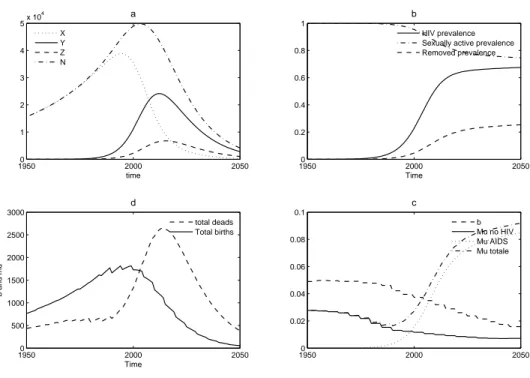
6.5 Model 2: The "Homeostatic Scenario" . . . 104
6.5.1 The homeostatic scenario (M1F2): results . . . 105
7 AIDS, Population and Economic growth 115 7.1 A critical Assessment of Standard growth model . . . 116
7.1.1 Exogenous growth model . . . 116
7.1.2 Endogenous growth model . . . 117
7.2 A comprehensive model . . . 119
7.3 Our integrated model . . . 121
7.3.1 The model . . . 121
7.3.2 Results . . . 122
7.4 Further analysis and investigations . . . 125
Introduction
“Twenty years after the first clinical evidence of acquired immunode-ficiency syndrome was reported, AIDS has become the most devastating disease humankind has ever faced. HIV/AIDS is now the leading cause of death in sub-Saharan Africa. Worldwide it is the fourth-biggest killer.” (UNAIDS, 2008)
Everywhere, especially in Sub Saharan Africa, the epidemic of HIV/AIDS im-poses severe human and social consequences. Family life is severely disrupted as adults are rendered less able and/or unable to work, health care costs rise and children are forced prematurely onto the labour market and/or made orphans.
Since few economists would doubt the potential of the AIDS epidemic to create substantial economic costs, it is surprising that there have been relatively few stud-ies into the economic, especially the macroeconomic, implications of the epidemic. In part this is probably a reflection of the limited recognition given to the impact of health upon macroeconomic performance and the relatively recent availability of data that allows systematic econometric evaluations of the epidemic. On the other hand scholars usually study this phenomenon without considering the interconnec-tion between different aspect of human life.
This dissertation aims to study, in a multi-disciplinary context, how demographic dynamics, affected by terrible epidemics, like HIV/AIDS in Sub-Saharan Africa, can modify the economic growth in a country.
To understand the processes that drive these changes and to assess the future social, demographic, and economic impacts of HIV/AIDS epidemic, we need to improve our knowledge and create better tools. To achieve this goal we focused our efforts on following issues:
• to understand the dynamics of demographic development in Africa;
• to understand the interconnection between demographic and economic devel-opment;
• to understand the HIV/AIDS effects on the Demographic Transition in Africa; • to investigate on the possible interconnection between demographic,
epidemi-ologic and economic dynamics 1
. 1
the demographic dividend
II INTRODUCTION
Thus we needed a well organised and structurally strong data set, developed, with some PhD students in the Department of statistics of the University of Pisa2
collecting data from UN agencies3
considering the central assumption of these Data set for projections and calculations.
To better understand the data and population dynamics and to achieve a mul-tidisciplinary preparation I read some important authors in the demographic, epi-demiological social and economic studies4
.
After a brief presentation of methodological problems and solution (sources, in-dexes used in the work, variable downloaded from the UN database), I analyse which motivations brought me to study the Sub-Saharan African and why I decided to study the HIV/AIDS epidemic effects on population and economic growth.
Chapter 1 reviews the classical theories and literature on occidental Demographic Transition even if some scholar thinks that African transition needs different mod-els5
.
After this theoretical approach, Chapter 2 analyses the African data explaining some particular situation and pointing out some interesting projections for African and global population.
Then Chapter 3 proposes a brief analysis of Demographic Dividend followed by Chapters on theoretical models for economic growth and HIV/AIDS epidemic.
Once built this theoretical framework Chapter 6 investigates the possible inter-connection between HIV/AIDS epidemic and Demographic Transition, looking for an answer to following urgent question:
«Can HIV/AIDS also delay, or even deviate, the fertility transition, through an “AIDS generated” fertility wave?».
To investigate these phenomena we set up a model for the transmission dynamics of HIV/AIDS including mortality and fertility transition patterns, and also the possible feed-back of AIDS mortality on fertility. The model is a simple one, i.e. in the spirit of Anderson and May (1988).
Last Chapter connects all different aspect undertaken in previous Chapters, in-vestigating on how an HIV/AIDS epidemic could, through the impacts on the pop-ulation dynamics, affect the economic growth. In this Chapter we set up a model for economic growth "a la Solow", including Demographic Transition, Human capi-tal and Health capicapi-tal, and the effects of an HIV/AIDS epidemic simulated with a model described above.
2
Thanks to Linda, Aurelio, Luca, Francesca and Federico
3
From the agencies UNDP and UNAIDS. The database is updated at 2005.
4
Bruno Schoimaker; David E. Bloom; David Canning; Jaypee Sevilla; Eric Neumayer; Jean Claude Chesnais; John Bongaadts; Rodolfo A Bulatao; John C. Caldwell; Pat Caldwell; Karen Oppenheim Mason; S. Kwesi Gaisie; Tim Dyson and Mike Murphy; Tabutin; Livi Bacci; Demeny, etc. For more see the references
5
INTRODUCTION III
Methodology: Sources and indicators
To create our database, we only consider official data. Therefore, in this context I will not discuss their goodness or validity. However, I must observe that these official sources slight a really important aspect in the demographic studies: the specific characteristics of each regional context. Reading the literature, I discovered that, to really understand the African Demographic Transition, we need to add to the data from each country knowledge about intermediate variables in little region of each country6
. However, this database is a sort of “starter point” for my studies. During the dissertation, for some aspects, we come back on this observation and we consider some regional documents and sources7
.
Data are downloaded from the database of UNDP and World Bank.
It is possible to find all the World Bank information in the CD “World Develop-ment indicators 2004”, while all the data from the United Nations are published in the following web sites:
• http//www.un.org.popin;
• http//esa.un.org/unpp/index/asp?panel=28
; • http//hdr.undp.org/statistics/data9
; The Database is composed by:
Demographic indicators:
• Evolution of Population (in age class by 5);
• Population rates (dependency ratio, age composition); • Lotka’s r;
• Age and sex structure in the population; • Population growth rate;
• Total fertility rate; • specific TFR; • crude birth rate; • net reproduction rate; • average age at childbirth;
• infant mortality (mortality under 5 years); 6
Tabutin and Schoumaker (2001)
7
Tabutin and Schoumaker (2001), Gaisie (1996), Mason (1997) and Mason (2001)
8
For the period 1950-1998
9
IV INTRODUCTION
• mortality;
• average age at dead; • crude death rate; • death by sex; • dependency rate; • women age 15-49; • life expectancy. Economic Indicators: • pro-capita GDP; • Gini’s index; • poverty Index;
• Health and sanitary resources; • urbanization rate;
• social investments.
Social and development Index:
• Human Development Index (literacy level, life expectancy and GDP pro-capita);
• water and electricity availability; • literacy and instruction level; • gender empowerment;
• health and prevention (from STD and other diseases). Each indicator is disaggregated by sex.
We would like to explain the population composition by age pyramids from the web site of census bureaux, but, to obtain more homogeneity, we decided to take data only from one Internet database, so age pyramids are built from the U.N. data.
There is also the possibility to obtain data from regional analysis10
but it is still too early to make a so long database (from 1950 to 2050) with this method because there is’t sufficient information and data available yet.
10
INTRODUCTION V
Why study the African context?
Figure 1: Evolution of the prevalence of the African population on the global population
Africa, in particular the Sub-Saharan Area, is the region with the highest fertility rates in the world (5.3 children per woman in 2000). Here the population is also experimenting the highest growth rates in the world and, according to the UN projection (average hypothesis), in 2050 its population will be more then 20% of the global population with an high prevalence of people in working age (in 1950 Africa has the 8.5% of the world population, today its prevalence is at 13% and in 2050 it will be at 20% - Figure 1).
Recently, African population is slowly entering in the fertility transition, but it will continue to grow up for many years for the momentum of the population11
. Africa will be the thermometer for the global development and improve in wellbeing for next years, so it is really important for scholars and policymakers.
An historical and geographical knowledge of this continent bring us to consider Africa as a fragmented continent and not as an unique body. Indeed there are an universe of different stories, cultures, social structures, history and languages, often incomprehensible each others. The colonial experience (shared between many African countries) often brings the public opinion to unify situations and contexts that cannot stay together.
In the past, the lack of information and data forced scholars to write essays unifying Africa. Today, the new anthropological method, take U.N. and other world organizations to finance surveys in each country and internal area. Thus, whoever wants to study the D.T.12
phenomenon has many regional and local data to analyse. However, as observed above, our database is built following the country approach.
11
Cohort effect on the fertility (Bongaarts and Griffith, 1998)
12
VI INTRODUCTION
Why focus on HIV/AIDS?
Figure 2: Major causes of death in Africa. Source: «The World Health Report» (WHO, 2001)
As explained in previous section the African population has the highest growth rates, but in the same continent there is also the highest mortality rates of the world. Two decades after its official emergencies AIDS has become the single leading cause of death in South Africa, accounting for more than 22% of all deaths after adjusting causes of death13
(see Figure: 2). In 2004 the United Nations14
estimated 40 million people living with HIV/AIDS. In the same year there were 5 million new infections. More than 90% of the infected people lives in developing countries. Africa alone accounts for the two-thirds of the world total infections and for almost all of the infected children. In Botswana, Uganda, South Africa, Zambia and Zimbabwe (the 5 countries with the highest HIV/AIDS prevalence) life expectancies for females and males are now at their 1950 levels (seven years lower than it would have been without AIDS15
). Indeed this region has the highest prevalence of HIV/AIDS in the world (more than 2030% -see Figure 3).
Another interesting observation is that AIDS primarily afflicts people in working age16
. Africa is in a poverty trap: the economic stagnation has become a sad fact of life17
. Thus the central part of a development strategy for Africa is to investigate in health and any coherent vision of African development must incorporate health improvements as a central component18
. Indeed Africa is not only the world’s poor-est continent, but it is also the least healthy. HIV/AIDS is ravaging the region’s workforce and shortening average life expectancies.
13
Bradshaw et al. (2003)
14
UNAIDS (2004d), UNAIDS (2004e) and UNAIDS (2004c)
15
UN estimates
16
For potential economic impacts in Africa see Bloom et al. (2003) and Bloom et al. (2005)
17
Drouhin et al. (2003b), Drouhin et al. (2003a) andCaldwell et al. (1989)
18
VII
All this conditions make the poverty trap of Africa stronger and stronger19
. New evidences are needed to persuade policymakers and investors on the im-portance of health. This dissertation, reviewing the literature and summarising the most important data and analysis aims to give a contribution to these needs.
Figure 3: Prevalence of HIV/AIDS in Africa
19
unhealthy populations are unable to work effectively. It can deter foreign investors and tourism. HIV/AIDS hit the younger work force and has orphaned millions of children, many of whom end up living on the streets and are easy recruitment targets for criminal gangs and armies (we will see empirical evidence that supports the links between health and economic development in the database analysis reference chapter...).
Chapter 1
The Demographic Transition
Until the 18th century, the history of the world population development essentially
followed a stationary model. Scholars esteemed that there were only some little growth moment during the "tools revolution" and the "agricultural revolution"1
, but the unique documented event is the "Demographic Transition": an historical revolution in the demographic pattern characterised by an exponential population growth2
.
Following pages review the literature looking for an answer to some of the most important questions on the Demographic Transition:
• What is the Demographic Transition? • When does it occur?
• Why does it happen?
• Can we use the same model to explain the Demographic Transition in every country?
1.1
A Review of classical literature
The Demographic Transition is a phenomenon defined by many authors in many different definitions, and each has something different from the other.
The first and more complete definition of Demographic Transition is:
“The process by which fertility and mortality fall from the high levels characteristic of pre-industrial societies to the low levels characteristics of modern industrial societies3
.” 1
Bacci (1998b)
2
Chesnais (1992) and Bacci (1998a)
3
Demeny (1972)
2 Chapter 1: THE DEMOGRAPHIC TRANSITION
In the 1980, the “Demographic dictionary of United nations” defined it as: “Le processus évolutif observé dans an grand nombre de population depuis le 18e siècle, processus caractérisé par une baissé importante de la mor-talité et de la namor-talité. La transition démographique fait passer les pop-ulation du régime démographique ancien, caractérisé par une natalité et une mortalité élevée, au régime démographique moderne, à mortalité et natalité faibles”
In these definitions, we can find almost all the important aspects of Demographic Transition in the developed countries. The only thing that can be added is:
“[La transizione demografica]. . . il passaggio dalla costrizione alla scelta4
”. (from the constraint to the choice).
The Demographic Transition can be considered a phase of no balance between two balances:
• the “ancient regime”
with high pattern of mortality and fertility, with 30-50% of son dead before the fecundity ages and with other dead during this period without arrive to 40 years so that the replacement level of TFR was 6 or more children per woman; • the “modern regime”,
with low pattern of mortality and fertility and a very high life expectancy (more than 70 years for developed countries). During the “no balance period” it is possible to assist to a tremendous population growth and to a radical change of life style.
Before the DT people lived under constraint to have many children (for re-placement, for rural jobs, for the old ages. . . ), then people started to be able to choose how many children have, so they started to invest more on them (passing from quantity to quality of their children)5
.
In the above definitions we find the answer to another important question: When does it occur?
For the western countries (and not for all the world population, as we could understand from the UN definition) the mortality decline began in late 18thcentury,
after the industrial revolution, while we can observe the first fertility decline in late 19th (one hundred years late!). Most of the northern and Western Europe countries
reached the replacement fertility level by the ’30s.
Reading this kind of macro-studies on Demographic Transition we risk to fall into the trap of the generalization, Chesnais gives us the right reading key for macro data:
4
Bacci (1998b)
5
Some models try to explain the choose process with utility function, Manfredi and Fanti (2004), de Ka (2001) and Bacci (2001)
1.2 A Simple Demographic Transition Model 3
We can find some common point, so that we are authorized to look for a common explanation of Demographic Transition, but we cannot forget that this is a very heterogeneous process, so we have to consider the dif-ference in and between the countries.
Therefore, in studying the demographic transition we have to consider different beginning time, different temporal scales and different social and anthropological aspects.
Looking to the development regions we can write something about timetable of them Demographic Transition:
All countries essentially experienced mortality declined from 1930-1950. Most of them started to experience fertility declines, especially in Asia and Latin America.
In Sub Saharan Africa (and in some other countries as Oman, Iraq and Iran, Pakistan, Afghanistan, Guatemala and Honduras) the fertility de-cline is at the beginning.6
1.2
A Simple Demographic Transition Model
Figure 1.1: The Sweden Population History (Montgomery, 2000)
A complete time series of Crude birth rate and Crude death rate are available for Sweden. Starting from these data (represented in Figure 1.1) we can analyse a very simple model for this phenomenon. The model is based on the observed changes (transition) in birth and death rates in developed societies over the past two hundred years or so7
. This model is a general abstraction to apply mathematical methods on real population dynamic: it is not an accurate description of the reality, but a simplification to better understand the world.
6
Chesnais (1992)
7
4 Chapter 1: THE DEMOGRAPHIC TRANSITION
In the simplest model of transition there are four stages8
:
1. The pre-Industrial times, characterised by a balance between birth rate and death rate. In the late 17th Century, this balance was broken and the
Demo-graphic Transition began. Sometime we refer to this step as “high stationary stage”. Some demographers called it “Malthusian” phase.
2. The second stage is represented by the rising in population caused by a decline in the death rate while the birth rate remains high, or even rises slightly. The mortality decline began more or less in 18th century. During this stage, the
mortality changing was due to the epidemic transition: the waves of diseases became constants over the time and diminished farming crises.
3. During the third stage began, after a rising due to the Dyson and Murphy effect (Dyson and Murphy, 1985), the fertility decline. In researcher’s common opinion the mortality decline is actually the pre-condition to have fertility decline9
. Section 1.4 analyses this stage.
4. Then, at some point towards the end of stage three the fertility rate falls to new replacement levels. However, population growth continues on account of demographic momentum (or population momentum)10
. In some countries (especially western countries) birth rates are fallen under the replacement level, all the European countries are aging in last 20 years. Demographers argue that these countries are in Below Replacement Fertility stage, TFR<2.1, or in Lowest Low Fertility stage, with a TFR under 1.311
!
The debate on short and long term demographic consequences is open and we can observe two parties:
• Transient Phenomenon:
further decline as well as continuation over time of the present low levels of fertility in the developed world are unlikely because the moment TFR’s, used to assessing the existence of low fertility, is a rough indicator and can be substantially biased by changes in the tempo of fertility which typically occur in periods of fertility decline (postponement of births). Indeed, in the developed countries, women’s childbearing levels (=true cohort fertility) are not as low as period measures of fertility, as the TFR suggests. Another point used to bring on this opinion is that in most post-transitional societies couples plan to have about two children, and not only one12
. 8
Malberg and Somestad (2000)
9
Homeostatic assumption
10
Demographic momentum (also called "population momentum") refers to the fact that the future growth rate of a population, regardless of its current fertility level, is influenced by the present age structure of the population. It is thus a cause of population growth despite fertility decline; not a cause the global fertility transition (Bongaarts and Griffith, 1998).
11
Bongaarts (2002)
12
1.2 A Simple Demographic Transition Model 5
• Persistent Phenomenon:
postponement in childbearing cannot be only a transient phenomenon because the typical inertia of demographic dynamics brings the population in a long problematic: the negative momentum started in Europe from 2000 Cleland (2001).
1.2.1
A mathematical representation
Each population passes through at least three broad stages: Pre-industrial (with high mortality and fertility); Transitional (characterised by a significant decline of mortality without the immediate fertility decline; here we have the exponential growth of the population); and Industrial – urbanized (when the population stabi-lizes finding a new equilibrium in at low levels of fertility and mortality).
This section explains this model using a simplified picture and simple dynamic equations, to take confidence with these important tools13
.
Figure 1.2: The Demographic Transition Model; from a lesson by Manfredi (2003-2007)
To explain the mathematic system we can start from the dynamic equation of population:
˙
P (t) = (b(t) − µ(t))P (t) = r(t)P (t) t > 0 (1.1) The changing rate is r(t) = (births − deaths). Multiplying it for the population we can find the instantaneous population’s growth.
13
6 Chapter 1: THE DEMOGRAPHIC TRANSITION
Therefore, we can represent the Demographic Transition as:
˙ P (t) = 0 t < t1 r(t)P (t) r(t) > 0 t1 < t < t2 0 t > t2 (1.2) with solution: ˙ P (t) = P0 t0 < t < t1 P0e Rt t1r(s)ds t1 < t < t2 P0e Rt2 t1 r(s)ds t > t2 (1.3)
When t is inside the interval [t1− t2] we can observe an exponential growth, else
population is stationary14
.
When transition is completed, we can again observe a stationary population that is representable as:
Pf inal
Pinitial
= eRt1t2r(s)ds (1.4)
The quotient between final stationary population and starting stationary popu-lation is the exponential of the area between the fertility and mortality curve. This is the so called "transitional multiplier".
Before have knowledge about Africa, the highest known transitional multiplier was the one of Mexico. Africa is trying out a speeder and bigger transition, thus we can expect interesting results from these analysis.
1.3
Mortality and Epidemiology Transition
During the Demographic Transition in developed countries, many scholars studied why the mortality level fell down in the first stage of this phenomenon. Then they tried to use their results to fit the data for developing countries. Today it is clear that a complex network of factors ranging from the level of infrastructure through standard of education to cultural beliefs and practices determines a country’s mor-tality level. Many of these factors are largely function of a country’s cultural and historical heritage.
The experience of developed countries permit us to understand that the rapid economic growth determined massive decline in mortality and, even where economic growth has been slow, but policies have been aimed to satisfy the basic needs of most of the people, decline in mortality have been impressive. Thus scholars and policymakers think that increasing the income of poor and expanding schooling, especially for girls and woman, contribute a great deal to general household well-being and better health.
14
i.e. Population with an invariable age structure and without growth. Every population closed without changes with the outside world, subject to the same conditions of fertility and mortality in the long term tends to a stable state with age structure and rates Growth invariable. The stationary population, with no growth, is a particular case.
1.3 Mortality and Epidemiology Transition 7
However a good economic situation is nor sufficient nor necessary condition for the mortality transition. Indeed in many instances, countries with higher average incomes have higher average life expectancies, lower rates of infant and child mortal-ity and higher literacy rates, and consequently a higher human development index 1(HDI). But these associations are far from perfect. In inter-country comparisons, income variations tend to explain not much more than half the variation in life ex-pectancy, or in infant and child mortality. And they explain an even smaller part of the differences in adult literacy rates.
Although there is a definite correlation between material wealth and human well-being, it breaks down in far too many societies. Many countries have high GNP per capita, but low human development indicators and vice versa. While some countries at similar levels of GNP per capita have vastly different levels of human development. However, most of African health systems are riddles with problems such as fi-nancial constrains, inefficient funds, inequality and inefficiency that have hampered progress. The increasing of HIV/AIDS virus and other diseases have also contributed to the slowing down of improvements in mortality levels and progress in health.
Fertility levels have more observable and complicate aspects, so in literature we can find just some important concepts on mortality decline to elaborate (i.e. decline facilitated by medical and health technologies, access to basic sanitary and drinking water, instructions about hygiene, infra-structural facilities. Mortality can grow up with urbanization – as Malthus said – but with a right public sanitary system, cities avoided this problem.) and many opinions, models and policies about fertility transition.
However we can divide the determinant factors to explain the mortality decline into exogenous and endogenous factors15
:
• exogenous factors are represented by the natural declines in some infective diseases like the plague and TB16
;
• endogenous factors instead are the revolutions due to the growth in techno-logical knowledge17
.
The revolutions above cited are:
agricultural revolution (productivity grew up and, for the first time in the human history, possibility to save something and preparing for the climate changes and crisis eliminating the problem of famine and improving the diet).
The sanitary revolution with drinkable water and access to vaccines.
An important factor is the epidemiological transition: "the historical process of transformation of the cause composition of mortality, by which pandemics of infec-tious diseases are gradually replaced by chronic degenerative diseases as the leading causes of death18 ." 15 Bacci (1998b) 16 Blower et al. (1995) 17
For more information Galor and Weil (2000), Bacci (1998a), Bacci (1998b) and Chesnais (1992)
18
8 Chapter 1: THE DEMOGRAPHIC TRANSITION
During the epidemiological transition in developed countries we had the disap-pearance of some important diseases as the plague, the tuberculosis and smallpox (cause the vaccine), and rise and fall of cholera and malaria (caused by the urban-ization and the fallow sanitary revolution).
Diseases like smallpox, measles and cholera are extremely recent in terms of evolutionary time. Their appearance was due to the growth and aggregation of the population and caused a very high mortality.
Thus the high importance given to the epidemiological transition is because the highest mortality cause in the human history was due to the infective disease, and the reduction in the prevalence of this kind of disease is the major factor for the increasing in life expectancy levels.
The most important aspect in the epidemiological transition is the "Pandemic recession": continuous decline in mortality which allows sustained population growth and change in the temporal profile of mortality: the waves in mortality decrease till their disappear. Degenerative diseases and "man made" diseases are the new and actual highest death causes in developed counties.
1.4
Fertility Transition: a literature review
To explain the fertility decline is quite more difficult.
European experience shows that profound political and economic changes such as industrialization, international trade, and increase of the real value of wages, preceded and, as it were, prepared the ground for the Demographic Transition of the last quarter of the nineteenth century. There is a general observation from European history that the pre-industrial demographic regime was dislocated by a mortality decline and that a decline in mortality is a necessary precondition of fertility decline19
(i.e. homeostatic assumption).
In African countries we must consider another important fact: the prevailing socio – economic condition and the cultural assessment and beliefs make that decline did not only begin (as in Europe) because of socio – economic development and mortality decline, so it is necessary to study the different context.
The TFR of some countries developed very quickly, falling down to below re-placement level within a very short time (projection says us 35 years. . . ). If these countries really will be able to reach so quickly two children per woman, can others do the same despite the starting conditions? Will they serve as a model for the rest of the developing world or will it prove impossible for many countries, particularly in sub Saharan Africa, to travel this path?
Some of the majors theories on fertility decline gives us the best tools to find an answer to the previous questions.
Fertility theories can be used on at least three scales time: millennial, centen-nial and decencenten-nial scale. The grand-daddy of fertility transition theories is classic Demographic Transition theory as described by Thompson (1930) and Notestein (1953). This theory attribute fertility decline to changes in social life (caused by industrialization and urbanization.).
19
1.4 Fertility Transition: a literature review 9
After mortality decline, increase in survival of children, the urbanization cre-ated a way of life that rears the number of children in family is expansive, so par-ents are discouraged to have large families. In this kind of societies parpar-ents prefer quality child to quantity children. This theory works on millennial scale, but it is contradicted in decennial scale. During the last decades of 1900 demographers like Lesthaghe (1983-1995), Wilson (1988) and Surkyn (1986) elaborated a theory adding to economic classical theory, a shift in value toward individualism and self-fulfilment that occurs with rising affluence. With this addition, the theory fit European data quite well, but it does not work so well for developing countries.
In 1982, Caldwell built a theory based on wealth flows. He attributes fertility decline to the emotional nucleation of the family (that may be triggered by eco-nomical or cultural forces). The idea is that nucleation makes children, not parents, the net economic beneficiary of family life. This theory may apply to sub-Saharan Africa, but not to Asia or European experiences.
The neoclassical microeconomic theory of fertility by Brecker (1960) and Schultz (1973), Manfredi and Fanti (2003) and Manfredi and Fanti (2004), stresses three proximate determinants of couples’ fertility choices: the relative costs of children vs. other goods, the couple’s income and their preference for children vs. competing form of consumptions. This theory is silent about environmental and institutional conditions and their influence on the choices.
Another theory is the so-called "ideational" theory enunciated by Cleland and Wilson (1987). They attributed the timing of fertility transition to the diffusion of information and new social norms about control. Diffusion of idea and the processes through which diffusion occurs are increasing recognised as important for the timing of fertility declines, especially on a ten year time scale (that is the scale to effect quantitative tests).
In summary there are many other theories of fertility transition, each containing important ideas none provides a complete explanation for all known fertility declines. Often is possible to find a case where each of this theory is contradict by the evidence. May be, as wrote Mason (1997), this situation has arisen because researchers have made four errors thinking about fertility transitions often ignoring or forgetting important points in doing it. The list of errors is:
1. Assuming that all transition have the same cause;
2. Ignoring mortality decline as a precondition of fertility decline;
3. Assuming that the regulation of fertility is fundamentally different in pre-transitional and post-pre-transitional population;
4. Focusing on a ten year time scale or not specifies the time scale on which the theory is intended to apply.
Classical propositions about the Demographic Transition have come to be less and less useful in explaining the extraordinary rapidly transitions being experienced by many developing countries today. Two features appear questionable: that basic changes in social and economic relationships must occur before family will change, and that the process is a gradual one that requires many decades to complete.
10 Chapter 1: THE DEMOGRAPHIC TRANSITION
During a meeting on global fertility transition, some of the best and most active scholars in demographic change examined the state of theory of the global fertility transition to solve this problem and produced a volume of papers that both assessed the current state of affairs and challenge researchers to explore new theoretical leads. From this work came eight basic explanations for fertility transition link to clas-sical statement of transition by Notestein (1953) and subsequent theoretical work by Davis (1963), Coale (1973), Becker (1960), Carlsson (1966), Caldwell (1977), Easterline (1978), Cleland and Wilson (1987), Hirshman (1994) and Mason 1997).
Mortality reduction: long - run declines in birth and death rates have always appeared closely related, giving rise to speculation about possible equilibrium be-tween the two. Davis (1963) extended the idea of such equilibrium to incorporate the effects of migration in his concept of “multi-phase” demographic response. The specific mechanism of linkage between reduction in death rates and birth rates are complex and do not necessarily involve couples’ directly calculating the balance, although their actions may produce one.
Opportunity costs of childbearing. Rearing children interferes with adult activi-ties. It can make it difficult for the mother to work, and her income forgone is a cost to the family. It limits parents’ social activities and other consumption. One might combine these opportunity costs with the preceding economic factors, but they are worth distinguishing because the dynamics of end emphasis on opportunity costs can differ over time.
Family transformation. The shift to fewer births accompanies a transformation in the institution of the family from a multi-generational concern with clear lines of authority to a small, conjugal unit focused on the individual needs of the members. This family transformation, and the changes in values accompanying it, may itself be responsible for preferences for having fewer children. Gender-specific roles within the family may also change, affecting the joint preferences of the couples as well as the ability of woman to realize their preferences.
Vanishing cultural props for childbearing. From religious injunctions to the en-couragement of tribal and village elders, high fertility often receives support and even celebration in traditional societies. These normative props lose their force as societies modernize. Weakening normative control may empower individuals to make their own choices, often for smaller families.
Improved access to effective fertility regulation. Better methods of contraception and abortion, and less-fettered access to such methods, should make it easier to control fertility. Assuming some initial at least latent desire to do so, greater access should give an impetus to fertility decline.
Marriage delay. While each of the preceding explanations may account for fer-tility decline within marriage, marriage delay has often added to overall ferfer-tility decline.
Diffusion. Diffusion refers to the spread of ideas and practices that lead to lower fertility. In sense, it is not an independent explanation. What diffuse must be ideas or practices connected with one or more of the preceding explanations, or with some other substantive explanation that may have been overlooked. The diffusion explanation appears to address only the process of, rather than a fundamental reason for, fertility change. Nevertheless, it directs attention to the fact that individuals
1.4 Fertility Transition: a literature review 11
and couples do not act in isolation: they interact and influence each other, giving the process of fertility change its particular dynamics.
Some scholars, writing about fertility decline in Sub-Saharan Africa, mixes two or more of the previous explanations20
. They write about socio-economic development, asserting that a very important aspect is the decline of infant and child mortality. This is possible if health services will continue to improve and not only by the market, but by the public administration. The education is also important and much the same can be said about urbanization and sanitary revolution. In Sub-Saharan Africa there is another very important aspect: the HIV/AIDS epidemic expansion that evidence as very important issue the diffusion of condom use and, because that, a change in cultural beliefs.
Some empirical studies on the relationship between poverty and fertility be-haviour in Sub-Saharan Africa show that differentials by economic status and fertil-ity, contraceptive use and age at marriage are very important. The poorest women have a larger number of children, marry younger and use less contraceptive methods. The fertility differential by economic status persists after controlling for education and place of residence, suggesting that poverty does constitute a break to fertility decline. These analyses show that fertility has decreased among the poorest women in the countries where the fertility transition is well under way, and that the overall fertility changes are much more rapid that one would expect from purely composi-tional changes in terms of economic status, education and place of residence21
. For each explanation there are some theoretical approaches.
Demographic approach: the focus is the mortality; in this way we have the explanation of one demographic phenomenon with another looking for links and dependency.
Historical approach: essentially the discussion is on the evolution from the high fertility and mortality balance to another situation, passing through the demo-graphic transition. In this approach, the focus is why and how this demodemo-graphic phenomenon is happening.
Sociological approach: the author is looking to mortality reduction, falling de-mand for children and increasing ability to regulate fertility, focusing on determi-nants of the pace of fertility decline transition. The focus on perception and social influence provides possible explanations for the timing of the onset of fertility decline and sudden accelerations and decelerations in the tempo of fertility decline.
Psychological approach: this approach is applied mainly on post-transition fer-tility, or at least to the late stage, when is important that individuals understand their possibilities, their advantages and their utility in have or not have children.
Economical approach: where the cost of children is central and it is confronted to the opportunity cost of alternative economical goods.
Gender perspective: involving a collection of indirect influences on fertility the gender system make a difference because of their relationship to all the other ex-planations, modifying the influence of other factors on fertility. Policy perspective: from this perspective the question is less why fertility declines than whether policy plays a role in decline.
20
Caldwell and Caldwell (2002)
21
12 Chapter 1: THE DEMOGRAPHIC TRANSITION
Thus fertility decline is a largely rational process. It is based on individual cal-culations that lower fertility makes sense, not solely in economic terms, but also for social and psychological reasons. As with most rational actions, both the motivation and the means must exist. “Demands” explanations that account for the desire for smaller families and “supply” explanations that account for access to methods of fertility regulation each receive attention from most perspective. As predominant rational process fertility transition involves a multitude of individual decisions. The framework for individual decision is set by social-structural and economic factors. They may include the gender rules society enforces, the labour market requirement produced by globalisation and the policy prescriptions that government adopt.
On the one hand, the demographic approach appears to imply an equilibrium replacement level. On the other hand, the gender perspective implies that personal preferences will become the central factor, and the psychological approach suggests these preferences will favour low fertility. Finally, the economic approach, the gender perspective and the policy perspective imply that public policy could have an im-portant role in influencing future fertility levels, potentially in an upward direction. The historical technological progress raises the rate of return to human capital, and hence induces parents to substitute quality for quantity of children. Choice of parent regarding the educational level of their children increases the speed of technological growth: children with high levels of human capital are more likely to advance the technological frontier22
.
Fertility is governed by many different factors and its decline is different societies may be started by a differing combination of factors. The type of Demographic Transition in sub-Saharan Africa in the twenty-first century or beyond are likely to be associated with the different patterns of socio-economic development, about which we are still ignorant. Perhaps the question of long-run fertility levels might be settles by careful empirical analysis, without previous recourse to theory and relating that to social trends, in the database beyond we start to try to analyse the situation in this way.
22
Chapter 2
African Data Analysis
Observing the map of Africa (see in Figure 2.1) we discover that it is possible to divide it into at least five groups of countries:
• Northern Africa (western Sahara, Morocco, Algeria, Tunisia, Libya, Egypt, Sudan);
• Western Africa (Mauritania, Mali, Niger, Nigeria, Benin, Togo, Burkina Faso, Ghana, Ivory Coast, Liberia, Sierra Leone, Guinea, Guinea Bissau, Gambia, Senegal, Cape Verde);
• Eastern Africa (Eritrea, Djibouti, Somalia, Ethiopia, Uganda, Kenya, Sey-chelles, Mauritius, Madagascar, Reunion, Comoros, Mayotte, Burundi, Uganda, Rwanda, Tanzania, Malawi, Zimbabwe, Mozambique, Zambia );
• Central Africa (Chad, Central Africa Republic, Cameroon, Equatorial Guinea, Congo, Gabon, Dem. Rep Congo, Angola);
• Southern Africa (Namibia, Botswana, Swaziland, Lesotho, South Africa). The Southern Group is the one with the highest incidence of HIV/AIDS, as we can also see from Figure 3: Zambia, Namibia, Botswana, Lesotho, Zimbabwe.
14 Chapter 2: AFRICAN DATA ANALYSIS
Figure 2.1: Map of the African Continent
2.1
Northern Africa
(a) Morocco CBR - CDR (b) Tunisia CBR - CDR
Figure 2.2: Northern Africa
As we can see in Figure 2.2 the northern African Countries are approaching to the end of the Demographic Transition, indeed crude birth rate is following the rapid decrease of crude death rate. The mortality has decreased since before the 50’s, and the fertility started to decrease in the 70’s.
In Morocco ( Figure 2.2(a)) and in Tunisia (Figure 2.2(b)) the Demographic Transition is going to end the second stage and to begin the third one. At the end of the period of projection the increased mortality estimated is attributable to the aging of the population as emerging from the age structure (see the age pyramid in Figure 2.3).
2.2 Western Africa 15
Figure 2.3: Age pyramid for northern Africa
2.2
Western Africa
Figure 2.4(a) allows us to observe that the mortality is at the lower level, while the fertility has just started its decrease. The (optimistic) UN projections estimate the decrease to the replace level of the end of Demographic Transition in 50 years. The realization of this prevision is quite difficult, but the average hypotheses of UN is that all the countries will arrive to the convergence at CBR with CDR, and it could be possible also because the level of fertility in Senegal in last years is rapidly decreasing, may be for the massive male migration.
The Guinea Bissau has not the same profile of TFR, indeed the mortality started its decrease in the 50’s and fertility is yet today at the high level of the 1st stage of Demographic Transition (see the Figure 2.4(b)).
In both countries it is possible to see an increase of fertility at the beginning of the decrease of mortality (see Figure 2.4). From the evidence of data analysis and from literature we can find this increase in fertility during the first stage of demographic transition not attributable to the changing of the age structure, not only in this country, but in quite all the populations1
.
Decrease of the abstinence period of postpartum and of breast-feeding could be the causes, with the decrease of incidence of diseases that give sterility, of this phenomenon. But the level achieved in this period is the highest of every time, thus it is important to understand its the determinants and, more over, the effects on the population growth, understanding what is the timing of the turning point of fertility.
An important conclusion we can achieve is that this pick on fertility must be considered part of the initial stage of demographic transition.
1
16 Chapter 2: AFRICAN DATA ANALYSIS
(a) Senegal CBR - CDR and Total Fertility Rate
(b) Guinea Bissau CBR - CDR and Total Fertility Rate
Figure 2.4: The Western Africa
2.3
Eastern Africa
The Demographic Transition was stopped from the HIV/AIDS epidemic in 90’s -2000. As we can see in Figure 2.5, in these years the two countries had an increased mortality (for the HIV/AIDS) and fertility.
The UN projection give credit to the policies against this disease through a decrease of the mortality level between 2005 and 2010. Kenya and Uganda represent two cases of "success stories"2
Figure 2.5: Kenya and Uganda
2.4
Central Africa
In 2000 the mortality increased also in central Africa (as we can see in Figure 2.6). For the Republic demographic of Congo the central projection hypothesis of UN is evident, but it is important understand the HIV/AIDS effects in the other
2
2.5 Southern Africa 17
hypotheses, also because in 2000 there were the same effects on mortality than in Kenya and Uganda (see Figure 2.6(a)).
In Gabon (Figure 2.6(b)) the Demographic Transition is just at the beginning. In the Central Africa context the dynamic of Gabon is singular: the distance between death and birth rates during the 90’s is, may be, attributable to the Dyson and Murphy theories.
(a) Rep. Democratic Congo CBR -CDR
(b) Guinea Bissau CBR - CDR and To-tal Fertility Rate
Figure 2.6: The Central Africa
2.5
Southern Africa
The HIV/AIDS has here the highest incidence and prevalence.
In southern Africa data reflect a different situation: from 1950 to 2000 the mor-tality decreased to some low level, and the fertility stayed at the high level of the first and second stage of Demographic Transition. In ’90s, the same years of the beginning of HIV/AIDS high prevalence, mortality had a jump to higher level and fertility decreased.
This disease has pushed to the align the Crude birth and death rates, configuring a different demographic transition3
characterised from different rate of mortality and fertility and age pyramids "eaten" in the central ages.
Next chapter analyses this phenomenon and its consequences, here it is just important to review some hypotheses in the literature.
Recent studies on the impacts of HIV/AIDS on Demographic Transition formu-late the following projection:
1. Typical evolution of Demographic Transition; achieving of the fertility and mortality level post-transition;
2. Stop the fertility transition;
3. Start of a second Demographic Transition.
3
18 Chapter 2: AFRICAN DATA ANALYSIS
Figure 2.7: Southern Africa
With the population data we analysed the effects on demographic dynamics of HIV/AIDS focusing on:
1. Mortality
• super-mortality from HIV/AIDS 2. Fertility and reproduction rate
• TFR
• Total reproduction rate • Lotka’s
3. Age structure • Age pyramids
• Demographic dividend 4. life expectancy
2.6 Demographic Dynamics: TFR and TRR 19
(a) T.F.R. (b) TFR - zoom on most important years
Figure 2.8: Fertility in Africa
2.6
Demographic Dynamics: TFR and TRR
Analysing the Total Fertility Rate, it is possible to obtain information about how many children per woman are in the country in a given year (or period).
The fertility trend in different countries in the 50’s was substantially balanced (6-7 children per woman, Figure 2.8). Through different way, attributable to the dy-namics of intermediate variables, the African countries passed from this homogeneity to a substantial not homogeneity.
The less homogeneous situation is in the present: between 2000 and 2020 we can observe at least 3 groups (at 3,5 children per woman; at 4,5 and at 6,5 children per woman -see Figure 2.8(b)).
We’ve already analysed and treated in details this topic in chapter 1.4; now it is important just to summarise the approaches4
: • demographic approach; • historical approach; • sociological approach; • psychological approach; • economical approach; • gender approach; • political approach;
The challenge for the future is the integration between the different perspectives and contributions from all the field of social studies to achieve an interdisciplinary approach in this field of studies.
4
20 Chapter 2: AFRICAN DATA ANALYSIS
Now it is important to consider the Total reproduction rate (R0). This rate gives
us good information on reproduction only for stables populations5
, indeed this is a good growth for generations measure. In the cluster representation (in Figure 2.9 we can see the convergence in reproduction under 1 - as we could attend considering the central hypothesis of UN projections).
The actual uneven situation is due to the different decreasing in fertility in each country (as we saw analysing the Figure 2.8. At the beginning of this time series R0 increased for the dynamics of mortality and fertility).
Figure 2.9: Net fertility rate
Splitting Africa into countries with AIDS incidence higher than 10% and some of the other6
, we can observe that the TFR and TRR trend is more homogeneous between the first group7
(see Figure 2.10). From this observation emerge the need to understand how the HIV/AIDS diffusion impacts on the intermediate fertility’s variables8
. 5
Manfredi (2005)
6
we consider every country with the higher HIV/AIDS incidence and one country from every other geographic region
7
this group of country converge to a TRR of 1 before the other and in a more homogeneous way.
8
2.7 Lotka’s r and the impact of HIV/AIDS 21
(a) TFR with and without HIV AIDS
(b) TRR with and without HIV/AIDS
Figure 2.10: HIV/AIDS impact on fertility in Africa
2.7
Lotka’s r and the impact of HIV/AIDS
Lotka’s r is the long time hypothetical growth rate of a population with fertility and survivor rates constant over time.
With these constant rates for 70 years the population becomes stable9
. When r = 0 the population is a "stationary population" (or "zero growth"). In Africa Lotka’s r is less than zero in two situation:
• Where the incidence of HIV/AIDS is more than 10%10
; • Where the population has an old age structure.
For simplicity I translated Lotka’s r in doubling (or half) time for a population.
Figure 2.11: Lotka’s r in Africa
It is possible to see that in Botswana r is decreasing (and the time is increasing), in the projection in the period 2005-2010 r will be under zero (so the time is half time). Algeria has a different situation, with a more standard way for r (now is decreasing for the aging of population and not for a disease).
9
The growth of this population is independent from its initial age structure.
10
22 Chapter 2: AFRICAN DATA ANALYSIS
To better understand the Botswana’s situation we can look to Figure 2.12 (in Figure 2.12(a) Lotka’s r and the time for doubling or half the population; in Figure 2.12(b) the impact of this phenomenon on the age structure through the Botswana’s age pyramid).
(a) Lotka’s r in Botswana (b) Age pyramid of Botswana
Figure 2.12: Lotka’s r: the case of Botswana’s population
We can see the same effects in other countries with age pyramids. In Figure 2.13(a) we can observe the actual situation and the UN projection for Congo; while Figure 2.13(b) represents the South Africa’s situation.
In Figure 2.14, and 2.15 we can appreciate the sequence of Lotka’s r for Africa in next fifty years as UN projects actual situation. Lotka’s r in next years are going to decrease in the northern countries for the aging of population and the 3rd stage of Demographic Transition, but in southern countries the decreasing is due to the diffusion of HIV/AIDS and other diseases.
(a) age pyramids in Congo (b) Age pyramid of south Africa
2.7 Lotka’s r and the impact of HIV/AIDS 23
Figure 2.14: Lotka’s r between 1996 and 2010.
Chapter 3
The demographic dividend
"AIDS is an extraordinary kind of crisis; it is both an emergency and a long-term development issue. This takes us directly beyond the epi-demiological aspects of the disease to the social and economic dimension. HIV/AIDS is not simply a biomedical or demographic problem. It is a development issue, and so incorporates economic wellbeing and human growth."
(UNAIDS, 2004d)
Previous chapters reviewed the Demographic Transition theory and real data for Africa. From these data it is possible to conclude that African population, especially the southern Africa, is in some initial or middle stage of Demographic Transition. We also understood that, in some way, the HIV/AIDS pandemic has got a great impact on this phenomenon. Chapter 5 analyses the epidemiological models to describe important diseases in general and HIV/AIDS as particular field of interest for this dissertation.
This chapter, looking to the developed countries experience, motivates why we need an age structured model to understand the African opportunities in economy. The Demographic Transition during the second-third stage produce a boom gen-eration. In this stage society population has the opportunity, under the right con-ditions, to take advantage from the "Demographic dividend"1
.
The first part of this chapter is to understand, through the literature, what is this phenomenon and how it can influence the economic growth, the second part analyses the African context.
After a review of economic growth models and after the epidemiological chapters I’ll look through the literature for a new economic growth model able to take into account the HIV/AIDS epidemiology and its impacts on economy.
1
for more information Bloom et al. (2003) and Bloom et al. (2005)
26 Chapter 3: THE DEMOGRAPHIC DIVIDEND
3.1
Understanding the demographic dividend:
a literature review.
The expression "demographic dividend" is normally considered originated in a study of East Asian growth carried out by David Bloom and Jeffrey Williamson2
.
The expression refers to the opportunity for economic growth that Demographic Transition offers to developing countries through changing age structure of the pop-ulation especially through the proportion of the workforce rising. Indeed in these countries, while population growth has a negative effect on the per capita income growth, this effect is counteracted by the positive effect from growth in the share of the population that is economically active.
This phenomenon occurs when a falling birth rate changes the age distribution, so that fewer investments are needed to meet the needs of the youngest age groups and resources are released for investment in economic development and family welfare.
Added to this phenomenon, Demographic Transition could be able to contribute to economic growth by providing women an increased opportunity of participating in the labour market. Increasing labour force participation of women will add to labour supply and reinforce the effect of demographic dividend. On the other hand, the female population aged 15 and above remains as a promising source of future labour force as the younger generation becomes more educated, more participatory, and more attached to their own work career, thanks to their delayed marriage, very low fertility, and small number of children to be taken care of.
Recent studies improved the original concept of demographic dividend describing it as divided into two parts. Firstly, there is a "pure" age-structure impact on labour supply and total GDP: the demographic transition induces changes in population age structure that increase the share of the population concentrated at the productive ages.
These changes in population and its age structure must have been beneficial to economic growth by supplying a growing but young labour force to the economy. In Figure 3.1 we can see the size of the economically active population, in Africa.
Secondly there is a life cycle savings and investment component identified and called by Bloom and Williamson "behavioural effects3
".
Indeed the larger generations who work their way through the labour force as the age pyramid changes favour greater personal and national saving. This ability to save becomes even greater as the "baby boom cohort" moves into their 40s, especially as in the first instance the generation-span is smaller, and their own children rapidly become wage-earners themselves and hence soon require less support. Thus personal savings continue to grow and are able to serve as a source of investment funds. Countries steadily move from being heavily dependent on external finance, to a position of relative financial self-sufficiency.
2
Bloom and Williamson (1998) and Bloom and Sachs (1998).
3
3.1 Understanding the demographic dividend: a literature review. 27
Recently, some authors identified a third effect as an educational and human capital component. Having fewer children normally enhances the health of both mother and child. Female participation in the labour force, in turn, enhances the social status and personal and financial independence of women. Also fewer children normally means fewer and better educated ones. More investment is allocated to each individual child.
Thus Demographic Dividend can also give a great contribute to poverty reduc-tion4
.
3.1.1
How does the demographic dividend work?
The demographic dividend is delivered through several mechanisms. • Labour Supply:
The generations of children born during periods of high fertility finally leave the dependent years and can become workers.
• Savings:5
Working-age adults tend to earn more and can save more money than the very young. The shift away from a very young age distribution favours greater personal and national savings. The ability to save money is even greater when individuals born during periods of high fertility move into their 40s, when their own children are mainly on their own and require less support6
. • Human Capital:
Having fewer children enhances the health of women. Their participation in the labour force, in turn, enhances their social status and personal independence. They tend to have more energy to contribute both to their families and to the society. Parents are under less strain to provide for many children. Family income can be focused more upon better food for infants. Incomes can go toward prolonged education for girls, and for teenagers of both sexes to improve their life prospects.
It is clear: this phenomenon is not permanent. There is a limited window of opportunity. Additionally, the dividend is not automatic. Institutional structures, policies and opportunities matter in this phenomenon.
4
Andrew Mason and Sang-Hyop Lee - UN millennium goals
5
see the chapter on economic growth to understand the importance of savings
6