Published by Canadian Center of Science and Education
Determinants of Bank Profitability in the Euro Area:
What Has Changed During the Recent Financial Crisis?
Simone Rossi1, Mariarosa Borroni1, Andrea Lippi1 & Mariacristina Piva2 1
Department of Economic and Social Sciences, Università Cattolica del Sacro Cuore, Piacenza, Italy 2
Department of Economic Policy, Università Cattolica del Sacro Cuore, Piacenza, Italy
Correspondence: Andrea Lippi, Department of Economic and Social Sciences, Università Cattolica del Sacro Cuore, Piacenza, Italy.
Received: February 22, 2018 Accepted: March 12, 2018 Online Published: March 14, 2018 doi:10.5539/ibr.v11n5p18 URL: https://doi.org/10.5539/ibr.v11n5p18
Abstract
During the recent financial crisis, bank profitability has become an element of strong concern for regulators and policymakers; in fact both self-financing strategies and capital increases – necessary to provide higher level of capitalization – rely on the ability of a bank to generate profits. However, the determinants of bank profitability, that seemed to be unequivocally identified by previous literature, appear to have changed under the effect of regulatory and competitive dynamics. We test this hypothesis on commercial, cooperative and saving banks, employing a random effect panel regression on a dataset comprising bank-level data and macroeconomic information (covering the period 2006-2013) for 9 countries of the Euro area. Our findings suggest that, after a period of “irrational exuberance” in which credit growth and high leverage were seen as proper and fast ways to boost profitability, a sound financial structure and a wiser and objective credit portfolio management have become the main drivers to ensure higher returns.
Keywords: financial crisis, bank profitability, Euro area 1. Introduction and Brief Literature Review
The banking sector plays a crucial role in the modern economies; this statement is especially true for countries in which the transmission of purchasing power is not widely guaranteed by traded securities. Therefore, it’s not surprising that the soundness of the banking system, and in particular bank profitability, is a relevant element of concern for policymakers and regulators. The new regulatory framework introduced by Basel III has strengthened this assumption; in fact, the choice for the banks that need to improve their regulatory capital ratio is between self-financing (i.e. retaining a major part of net profits) and capital increases. The success of both these strategies relies on the ability of a bank to produce an adequate return on capital; this result will be hard to meet in a sector in which the competition and the costs generated by the compliance to new regulation are soaring over time.
Since the seminal works of Short (1979) and Bourke (1989), academic literature has widely investigated the main determinants of bank profitability. Competitive dynamics, continuously changing regulation, introduction of new accounting standards have contributed in subsequent years to make challenging the research activity, giving birth to different streams of literature. From a geographical point of view, we can divide works based on a cross-country comparison (Molyneux & Thornton, 1992; Demirguc-Kunt & Huizinga, 1999; Goddard, Molyneux, & Wilson, 2004a; Athanasoglou, Delis, & Staikouras, 2006; Pasiouras & Kosmidou, 2007; Goddard, Liu, Molyneux, & Wilson, 2011; Dietrich & Wanzenried, 2014; ElKelish & Tucker, 2015; Weigand, 2015) from others that focuses on a single country (Athanasoglou, Brissimis, & Delis, 2008; Alexious & Sofoklis, 2009; Alper & Anbar, 2011; Dietrich & Wanzenried, 2011; Trujillo-Ponce, 2013; Lusignani & Onado, 2014; Brighi & Venturelli, 2014; Chronopoulos, Liu, McMillan, & Wilson, 2015).
In the past, expected differences in the behaviour of the banks and in their ability to obtain profits were seen as correlated with their dimension and geographical scope (e.g., small vs. big banks, domestic vs. multinational players); more recently, the focus has been switched toward features linked to elements of governance and market relevance (e.g., cooperatives vs. savings vs. commercial banks, listed vs. unlisted intermediaries, systemic vs. non systemic players). As expected, bank specific factors are considered as crucial determinants of
profitability by a wide literature (Bourke, 1989; Demirguc-Kunt & Huizinga, 1999; Goddard, Molyneux, & Wilson, 2004b; Pasiouras & Kosmidou, 2007). These measures include bank size, bank specialization, loan share, revenues diversification, leverage, credit quality and efficiency. A relevant role in explaining bank profitability is also attributed to competitive and macroeconomic conditions (Bourke, 1989; Athanasoglou et al., 2008; Demirguc-Kunt & Huizinga, 1999; Molyneux & Thornton, 1992; Demirguc-Kunt & Huizinga, 2000; Beckmann, 2007; Albertazzi & Gambacorta, 2009; Genay & Podjasek, 2014; Saeed, 2014). This latter group of explanatory variables includes financial markets capitalization, GDP growth, inflation levels, market concentration.
More recently, interest has been raised on peripheral and emerging economies (Flamini, McDonald, & Schumacher, 2009; Javaid, Anwar, Zaman, & Gafoor, 2011; Olson & Zoubi, 2011; Misra, 2015) and on the effect of the crisis on bank profitability; however existing literature on this latter theme is still limited (Bolt, de Haan, Hoeberichts, van Oordt, & Swank, 2012; Beltratti & Stulz, 2012; Kasselaki & Tagkalakis, 2014).
This variety observed in literature is in line with the developing business model of the banks, which nowadays must compete in a challenging environment, much more segmented and complex than in the past. Moreover, the financial crisis of the last years has dramatically evidenced the risks underlying some competitive and operative strategies previously carried on by part of the banking system. For example, the fast expansion of credit and a high leverage had been seen in the past as good schemes to improve bank profitability; during the crisis, these same strategies has been widely considered (also by prudential regulation) as a potential dangerous source of instability. Furthermore, the starting point of the recent crisis has nearly coincided with the advent of significant changes in banking regulation (for example the rules introduced by Basel II in 2008). These latter innovations have the potential to permanently modify the way to perform the banking business, changing at the same time the fundamental drivers of banking profitability.
In particular, the advent of the recent financial crisis has dramatically reduced banks’ margins, lowering the yields structure (the so called “new normal”) and increasing the share of non-performing loans in banks’ balance sheets. In this new framework, macroeconomic/competitive conditions and cost-efficiency should emerge as main determinants of bank profitability. During harsh times, the lack of opportunities to boost revenues requires a wise cost management; moreover, the economic cycle has an immediate effect over financial dynamics, including credit supply and demand. These outcomes are likely to be particularly relevant for banks focused on the traditional “commercial banking” activities. In effect, the surrounding economic environment (through the credit channel) directly influences income statement figures of these players. Then, our hypothesis is that the advent of the recent crisis has increased the importance of variables like GDP growth, market concentration, cost income ratio and loan loss provisions in explaining bank profitability.
Our work, using bank-level data covering the period 2006-2013, aims to test this hypothesis, highlighting which have been – and how they have changed over time – the main determinants of bank profitability just before and during the crisis in 9 countries in the Euro area. The choice of this geographical and economic context is due to several reasons. First of all, in the Euro area the traditional commercial banking activity still prevails. Moreover, the presence of numerous and sometimes large mutualistic players allows us to investigate the bank type dimension in explaining profits generation. Finally, during the time span 2009-2013 European banks have experimented a severe crisis period started with the negative spillovers of the great global financial crisis and continued with the European debt crisis.
We contribute to literature in different ways. First of all, the time span under investigation allows us to better explore the effect of the crisis on bank profitability. Moreover, the geographical scope of our sample reduces the heterogeneity problems usually linked to cross country analysis. In effect, the common monetary system and the shared adoption of regulatory frameworks like Basel Accords, MIFID, Banking Union, etc. have progressively strengthened this harmonization in the Euro Area.
2. Data and Methodology
In order to investigate the determinants of bank profitability before and during the crisis, we use bank-level data derived from individual bank balance sheets and income statements, as available from BvD Bankscope database. We consider only commercial, cooperative and saving banks. For macroeconomic and competitive conditions we use data from World Bank, European Central Bank and Eurostat. Our data set covers the eleven ‘first entrant’ countries of the Euro-area (Austria, Belgium, Finland, France, Germany, Ireland, Italy, Luxembourg, Netherlands, Portugal and Spain); however two of them (Ireland and Netherlands) are not included in the final sample given the widespread presence of missing values in domestic banks balance sheets. We investigate the period 2006-2013. There is wide evidence that the global financial crisis started in late 2007; however, it is quite difficult to determine the exact starting point of the negative effect of the crisis on banks profitability. In effect,
what really counts in modelling an econometric analysis is not the official beginning of the crisis, but the moment from which the bank balance sheets have been affected by the crisis itself. According to this statement, we split our sample in two different periods (Pre-crisis and Crisis) using the mean and median values of our banks profitability measures over time as a reference; data show that profitability measures mainly drop in 2009 balance sheets, so we consider this year the starting point of the crisis.
Table 1 lists and describes the variables used in this study and indicates the expected effect of them on bank profitability. Table 2 summarizes the descriptive statistics of these variables, highlighting the mean-median values before and during the crisis. Panel composition is outlined in Table 3.
Table 1. Variables definition
Variable Description Expected
effect Source
ROAA Return on average assets Bankscope
ROAE Return on average equity Bankscope
NIM Net interest margin over average earning assets Bankscope
Loans_TA Net Loans over total assets +/- Bankscope
Loans growth Loans growth + Bankscope
Loanimpch_Loans Loan impairment charges to average gross loans - Bankscope
Total assets Natural Logarithm of total assets +/- Bankscope
Eq_TA Equity over total assets +/- Bankscope
Cost Income Cost income ratio - Bankscope
Nonintinc_grev Non-interest income over gross revenues +/- Bankscope
Cooperative Dummy variable: 1 for cooperative banks - Bankscope
Saving Dummy variable: 1 for saving banks - Bankscope
GDP growth rate Annual real GDP growth + Eurostat
HICP Harmonized index of consumer prices – Euro Area +/- Eurostat
HHI Herfindahl Hirschman index for credit institutions Total Assets +/- European Central Bank
MktCap_GDP Market capitalization over GDP – 1 lag +/- World Bank
Table 2. Descriptive statistics PRE-CRISIS PERIOD
Variable Obs Median Mean Std. Dev. Min Max
ROAA 375 0.542 0.566 0.553 -3.986 2.442 ROAE 375 7.948 8.406 13.201 -106.938 83.592 NIM 375 1.796 1.794 0.786 -1.072 4.934 Loans_TA 375 62.868 58.455 20.667 8.293 91.415 Loans growth 375 9.980 13.778 22.365 -30.670 180.460 Loanimpch_Loans 375 0.370 0.464 0.513 -1.120 3.540 Total assets 375 16.560 17.038 1.342 13.904 21.533 Eq_TA 375 6.421 6.816 3.148 0.377 16.830 Cost Income 375 62.874 64.064 18.092 18.343 198.394 Nonintinc_grev 375 36.980 38.106 41.073 -84.960 662.680 GDP growth rate 375 2.400 1.988 1.545 -1.000 8.400 HICP 375 2.200 2.430 0.741 1.300 4.500 HHI 375 0.068 0.060 0.047 0.018 0.316 MktCap_GDP 375 102.482 89.671 36.323 33.949 144.561 CRISIS PERIOD
Variable Obs Median Mean Std. Dev. Min Max
ROAA 625 0.321 0.310 0.562 -5.882 3.116 ROAE 625 4.691 4.475 10.090 -84.757 73.447 NIM 625 1.547 1.579 0.590 -0.766 4.155 Loans_TA 625 63.705 59.072 20.401 8.521 93.155 Loans growth 625 2.840 3.314 10.617 -56.370 127.630 Loanimpch_Loans 625 0.370 0.527 0.758 -6.080 5.020 Total assets 625 16.745 17.231 1.290 14.496 21.354 Eq_TA 625 7.102 7.211 3.045 1.192 18.013 Cost Income 625 63.332 62.746 14.812 24.184 145.124 Nonintinc_grev 625 38.060 37.415 14.414 -30.250 208.560 GDP growth rate 625 0.400 -0.010 2.638 -8.300 5.700 HICP 625 1.700 1.640 0.953 -0.900 3.700 HHI 625 0.055 0.058 0.048 0.021 0.370 MktCap_GDP 625 42.067 43.145 14.225 13.476 86.540
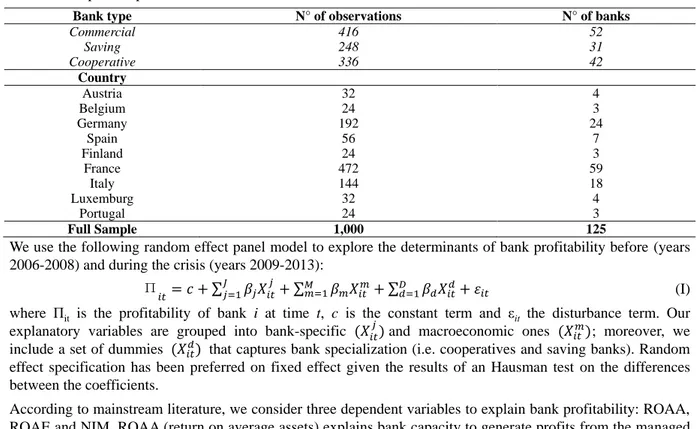
Table 3. Sample composition
Bank type N° of observations N° of banks
Commercial 416 52 Saving 248 31 Cooperative 336 42 Country Austria 32 4 Belgium 24 3 Germany 192 24 Spain 56 7 Finland 24 3 France 472 59 Italy 144 18 Luxemburg 32 4 Portugal 24 3 Full Sample 1,000 125
We use the following random effect panel model to explore the determinants of bank profitability before (years 2006-2008) and during the crisis (years 2009-2013):
Π
𝑖𝑡= 𝑐 + ∑ 𝛽𝑗𝑋𝑖𝑡 𝑗 𝐽
𝑗=1 + ∑𝑚=1𝑀 𝛽𝑚𝑋𝑖𝑡𝑚+ ∑𝑑=1𝐷 𝛽𝑑𝑋𝑖𝑡𝑑+ 𝜀𝑖𝑡 (I) where Πit is the profitability of bank i at time t, c is the constant term and εit the disturbance term. Our
explanatory variables are grouped into bank-specific (𝑋𝑖𝑡𝑗) and macroeconomic ones (𝑋𝑖𝑡𝑚); moreover, we include a set of dummies (𝑋𝑖𝑡𝑑) that captures bank specialization (i.e. cooperatives and saving banks). Random effect specification has been preferred on fixed effect given the results of an Hausman test on the differences between the coefficients.
According to mainstream literature, we consider three dependent variables to explain bank profitability: ROAA, ROAE and NIM. ROAA (return on average assets) explains bank capacity to generate profits from the managed assets and it’s widely considered the key ratio to evaluate bank profitability (Golin, 2013). ROAE (return on average equity) reveals how much profit a company generates with the shareholders’ capital. NIM (net interest margin over average earning assets) may be considered a proxy for the income generation capacity of the traditional banking business, i.e., lending and borrowing money.
The following bank-specific characteristics are used as internal determinants of performance.
Eq_ta: the ratio of Equity to Total Assets is a measure of capital strength. High ratios indicate a low level of leverage, and therefore low riskiness: consequently, on the basis of the conventional risk-return hypothesis, they are associated with lower expected profitability. However, as noted in Dietrich and Wanzenried (2014), lower levels of risk strengthen bank soundness and reduce funding costs, with a positive effect on its profitability. Given these opposite effects, the impact of bank’s capitalization on profitability is not theoretically determinate. Cost income: calculated as the ratio between operating costs (which include administrative costs, staff expenses, and property costs) and gross revenues, this indicator is a measure of efficiency: a lower level of this ratio has an expected positive effect on bank profitability (among others, Molyneux & Thorton, 1992; Goddard et al., 2013; Dietrich & Wanzenried, 2014).
Loans_ta: the Net Loans to Total Assets ratio measures the weight of loans (net of reserves) on total assets. It shows bank’s traditional approach towards lending activities and, indirectly, it’s experience/specialization in granting credit to customers, leading to a deeper consciousness in credit risk evaluation. In this sense, we expect a positive effect of this variable on profitability (in line with Goddard, Liu, Molyneux, & Wilson, 2013; Abreu & Mendes, 2001; Demirguc-Kunt & Huizinga, 2000).
Loans growth: this variable indicates the growth rate of gross loans between the previous and the current year. Being a way to expand business opportunities, loans growth - where not ‘abnormal’ (Foos, Norden, & Weber, 2010) - may promote bank profitability (Kok, Moré, & Pancaro, 2015); hence we expect positive sign for the coefficient associated to this variable.
Nonintinc_grev: the ratio Non-Interest Income to Gross revenues is a measure that allows us to identify the level of income diversification of a bank. The higher the ratio, the more important are activities different from traditional lending and borrowing. This kind of business diversification has two opposite effects on profitability. On the one hand, it can promote a reduction in profit volatility, due to a ‘portfolio effect’; on the other hand, it may distract the bank from its core business. In literature are found very different diversification measures and the impact of them on profitability is mainly empirically determined (Kok et al., 2015).
Total assets: we use the natural logarithm of bank assets to control for bank size. An increase in the bank dimension brings two opposite effects: on the one hand the opportunity to exploit scale and scope economies and on the other hand the costs associated with bureaucracy and complexity. Hence, the expected sign of the coefficient associated to this variable is undetermined.
Loanimpch_loans: Loan impairment charges to average gross loans are part of the overall cost of lending activity; in this sense they have a negative impact on bank profitability (Chronopoulos et al., 2015) as measured by ROAA and ROAE. This is not likely to occur for NIM that can instead benefit from a riskier portfolio.
Our model controls for bank specialization through three dummies that identify commercial (Commercial), cooperatives (Cooperative) and savings banks (Saving); this allows us to focus on the impact of a mutualistic nature on profitability before and during the crisis. Cooperatives and saving banks usually provide credit lines to small and medium enterprises and therefore are considered more close to the local economy (Goddard et al., 2013; Goddard et al., 2004a); we expect that this commitment can lower bank profitability, due to the difficulty to enforce ‘flight to quality’ strategies.
Our set of external indicators includes different coincident and lagged country-specific variables that are likely to influence the bank profitability. Undoubtedly, the strength of competition in the banking sector, the soundness of the surrounding economic environment and other external factors impact on the costs and revenues of a bank, on the quality of its assets and hence on its financial stability.
To capture the fluctuations of the economic cycle we use the real GDP growth for each country under investigation. Previous studies have found a positive relationship between this variable and the banking sector profitability (Goddard et al., 2011; Kanas, Vasiliou, & Eriotis, 2012; Albertazzi & Gambacorta, 2009; Athanasoglou et al., 2006; Beckmann, 2007); improved market conditions are associated with a better quality of the loans portfolio and with an increase of net interest margin. The growth of credit demand raises interest rates, while liquidity abundance on the market reduces funding costs for banks; naturally, the worsening of economic conditions brings to an opposite result, compressing the banks’ profit margins.
The choice to select countries that are part of the Euro Area allows us to have a homogeneous environment with regard to monetary policy; nevertheless, there are still differences in the level of inflation and interest rates of each country. To deal with this source of heterogeneity we use the national HICP index observed in each country; inflation influences different items in the bank balance sheets, like assets value, funding costs and interest rates on loans. However, in existing literature there is no clear evidence about the final effect of inflation on bank profitability (Beltratti & Stulz, 2012; Demirguc-Kunt & Huizinga, 2000; Trujillo-Ponce, 2013; Pasiouras & Kosmidu, 2007); the expected sign of the coefficient in our regressions is therefore indeterminate.
The traditional theories about the effect of competition on firm profitability have been applied to the banking sector leading to different approaches. Among them we find the Structure - Conduct - Performance hypotheses, the Efficient - Structure hypotheses, the Expense Preference hypotheses, the Galbraith - Caves Risk-avoidance hypotheses (for a review of literature about these topics see Rasiah, 2010). Usually a higher degree of market concentration is associated with the opportunity of extracting oligopolistic rents through collusive behaviours. However, a concentrated banking market can be the result of a fierce competition between intermediaries: this could compress their profit margins, for example in the traditional activity of borrowing and lending, reducing bank profitability. As a result, the expected effect of concentration on profitability is uncertain. It’s worth observing that is difficult to find an uncontroversial measure of market concentration; previous studies have used a wide set of indicators (e.g. the market share of the first 3-5 players, the Lerner Index, etc.). In our paper we use the Herfindahl Hirschman Index (HHI) of total assets for each country, which is the measure of market concentration used by European Central Bank.
In addition, we control for the ‘competition’ between banks and financial markets. To do this, we use a measure of relative importance of capital markets for the economy of a country, built as the ratio of market capitalization over GDP (mktcap_GDP). Where financial markets are underdeveloped, there is room for the banking system to exploit its bargaining power towards the customers, for example in credit supply: in this sense, poor financial markets fail in counterbalancing a concentrated banking market. On the contrary, efficient markets can compete with the banking sector in providing financial resources to borrowers and opportunities to investors. At the same time, banks can expand their business lines toward financial consulting and trading services, raising their non-interest incomes; as a result, the expected effect of financial market development over bank profits is undetermined. Since a relevant share of market capitalization is attributable to large listed banks, we prevent endogeneity problems using a lagged version of this variable.
3. Results
Estimation results are presented in Table 4. Table 4. Estimation results
ROAA ROAE NIM
Pre-crisis (1) Crisis (2) Pre-crisis (3) Crisis (4) Pre-crisis (5) Crisis (6)
Bank specific variables
total assets -0.003 0.012 -0.687 0.377 -0.139*** -0.118*** (0.023) (0.032) (0.777) (0.670) (0.050) (0.042) eq_ta 0.055*** 0.034*** -0.566 -0.223 0.061*** 0.048*** (0.011) (0.009) (0.448) (0.194) (0.018) (0.009) loans_ta -0.001 0.003 0.026 0.074 0.014*** 0.005*** (0.002) (0.002) (0.051) (0.047) (0.003) (0.002) loans growth 0.003 0.002 0.089*** 0.012 0.003*** 0.003** (0.001) (0.002) (0.032) (0.039) (0.001) (0.001) loanimpch_avgloan -0.195** -0.229*** -6.011** -4.091*** 0.184*** 0.051*** (0.087) (0.088) (2.446) (1.136) (0.050) (0.016) cost income -0.015*** -0.021*** -0.269*** -0.408*** -0.002 -0.006*** (0.004) (0.003) (0.095) (0.067) (0.002) (0.001) nonintinc_grev -0.002*** 0.000 -0.046*** -0.002 -0.002** -0.014*** (0.000) (0.001) (0.014) (0.022) (0.001) (0.003) cooperative -0.228** -0.233*** -4.565* -5.803*** -0.364** -0.288** (0.113) (0.087) (2.298) (1.667) (0.169) (0.118) saving -0.231** -0.243*** -4.919** -4.710*** -0.156 -0.212* (0.101) (0.077) (2.367) (1.424) (0.151) (0.118) Macroeconomic variables GDP growth rate -0.086*** 0.072*** -2.163** 1.360*** -0.042 0.018* (0.029) (0.025) (0.859) (0.384) (0.035) (0.010) hicp -0.083 0.159* -2.427 2.325* 0.007 0.034 (0.105) (0.083) (2.809) (1.205) (0.031) (0.028) hhi 2.358 -4.819*** 116.671 -73.098** 5.211*** -2.340** (4.163) (1.623) (115.035) (30.622) (1.715) (1.074) mktcap_gdp 0.007** -0.004 0.118 -0.097*** -0.004 -0.000 (0.003) (0.002) (0.095) (0.036) (0.003) (0.001) Constant 0.391 1.518** 24.716* 27.199* 0.131 3.906*** (0.611) (0.689) (13.770) (15.237) (0.321) (0.816)
Wald test on time dummies 14.65***
(0.00) 9.05* (0.06) 23.38*** (0.00) 12.18** (0.02) 11.76*** (0.00) 22.00*** (0.00)
Wald test on country
dummies 8.67 (0.37) 19.82** (0.01) 5.90 (0.66) 17.37** (0.03) 37.33*** (0.00) 36.74*** (0.00) R-squared overall 0.57 0.55 0.32 0.50 0.65 0.62 Banks 125 125 125 Observations 375 625 375 625 375 625
The recent crisis has emphasised the importance of credit dynamics for the soundness of the banking system; this both from a quantitative and qualitative point of view. In line with this observation, we use three measures, to highlight the importance of lending (net loans to total assets and loans growth) and the quality of credit portfolio (Loan impairment charges to average gross loans) for the banks included in our sample. The share of loans over total assets has a positive and significant coefficient in NIM regression, but not in ROAE and ROAA estimations; bank specialization in the traditional lending activity seems to have a positive and stable effect on the net interest margin.
Loans growth has a positive and significant sign over all our pre-crisis regressions; in that period the attitude to increase credit was considered a good health indicator of a bank and one of the most crucial driver to boost profitability. However, recent studies (Foos et al., 2010) have demonstrated that an abnormal credit growth can generate more loan loss provisions (LLPs) and a reduction of the overall bank profitability; this is what happened across the crisis period.
The worsening quality of the outstanding credit portfolio, as measured by loan impairment charges to average gross loans, reduces ROAA and ROAE - that are more sensitive to LLPs - but not NIM that does not take into account this item. NIM may rather be increased from a riskier outstanding credit portfolio; however this effect should be negative from a risk-adjusted point of view.
Table 4 reports a negative and significant coefficient on total assets in NIM estimations; larger banks have experimented a lower profitability in the period under examination. This should be explained by different point
of views. On the one hand, immediately after the beginning of the financial crisis, the blackout of the interbank market has penalized much more the borrowers than the lenders (usually represented by institutions with a high ability to collect money on the market, i.e. small local banks). On the other hand, smaller banks typically present a wider interest rate spread between borrowing and lending.
Equity over total assets has a positive and significant coefficient in NIM and ROAA regressions; it has negative but not significant coefficients in ROAE table. Banks with a lower leverage are perceived as more stable by the market and can pay lower risk premium; this has a positive effect on NIM and net income. The results obtained in ROAE regressions can be explained considering that in this profitability measure the equity represents the denominator. A higher level of equity, ceteris paribus, reduces the expected level of ROAE.
Cost Income ratio, as expected, presents steadily negative and significant sign. Banks effort to improve their efficiency has granted a higher level of profitability before and during the crisis.
We find a negative and significant coefficient on non-interest income over gross revenues in NIM estimation; we find mixed results in ROAA and ROAE regressions. As expected, lower levels of specialization in traditional banking activity reduce the NIM of the banks included in our sample. ROAA and ROAE regressions show negative and significant coefficients during the pre-crisis period and positive and not significant coefficient during the crisis. These results are coherent with a two-tier period; the first one, in which the leading strategy to boost profitability was expanding the lending portfolio, and the second one – i.e., during the crisis – that required the banks to find alternative sources of profits.
Table 4 reports negative and significant coefficients on our two specialization dummies (cooperatives and saving banks) in almost all the regressions. Results are consistent with the typical attitude of these types of banks, which favour long lasting relationships instead of short-term profitability; the wide time span of the crisis and the frequent small and medium enterprises bankruptcy have exacerbated these results.
With regard to macroeconomic conditions, we find significant and positive coefficients on GDP growth during the crisis, while negative and significant before. This latter result appears trickier to explain. Probably, during the pre-crisis period the delayed recognition of the worsening of macroeconomic conditions in banks’ balance sheets (through a higher level of LLPs) has weakened the link between banking profitability and economic growth. Estimations report positive and weakly significant coefficients on HICP in ROAA and ROAE regressions for the crisis period; however it must be noted that during the time span under investigation, HICP has experienced a high volatility, even reaching negative values.
HHI has negative – where significant – coefficient in ROAA and ROAE regressions. Estimation results appear coherent with a market framework in which concentration leads to tougher competition between banks, reducing profitability. This is true particularly in troubled periods, when rivalries are fiercer. For NIM we find a positive and significant coefficient in the pre-crisis period, while negative and significant during the crisis. These mixed results suggest that the extraction of oligopolistic rents is likely to occur only during economic upturns, while during a crisis period the ‘life-and-death struggle’ severely erodes the margins.
Finally, coefficients associated to market capitalization over GDP are positive before the crisis and negative in the following period in ROAA and ROAE regression, while negative and not significant in NIM columns. A high development of financial markets can be used by the banking system to increase profitability. However, during economic downturns, the perceived riskiness of the banking business rises; in this context, financial markets may become a potential competitor of banks, offering a wide set of alternative financial opportunities to investors. Overall, empirical evidence supports our research hypothesis. The pattern of coefficients before and during the crisis period confirms that macroeconomic conditions (including competitive pressure, as measured by the variable HHI) and cost-efficiency have increased their relevance in explaining bank profitability. This effect is evident both in the magnitude and in the statistical significance of the coefficients associated to the variables of main interest. Operating costs and loan loss provisions play a crucial role in determining the banks’ profit margins when the market yields drops, as happened after the recent global crisis. The resulting weakened income statements are much more sensible to exogenous factors: estimations confirm that the crisis has reinforced the effects on banks’ profits deriving from the economic cycle and the dynamics of inflation. Since the exogenous forces linked to the “new normal” could maintain the market yields near to zero for a long time, banks should work on the variables under (at least in part) their control: operating costs and credit standards.
4. Conclusions
The new regulatory framework introduced by Basel III has strengthened the importance of bank profitability; this both to promote self-financing and to ease capital increases. In effect the success of these strategies relies on
banks’ ability to generate profits in order to retain a major part of them or attract new investors. In this sense, European Central Bank [ECB] (2015) issued a recommendation to banks “to base their dividend policies on conservative and prudent assumptions to cover their current capital requirements and prepare to meet more demanding capital standards”. This statement has a very crucial implication for countries strongly relaying on the banking sector; in fact, any lack of regulatory capital implies the need for reducing the amount or riskiness of credit granted to customers.
In recent years, lending policies have been taken to the forefront of academic and political debate, due to the primary role that credit expansion has played in the recent crisis. Our results confirm that rigorous behaviours in granting credit to borrowers improve bank profitability. A greater level of net loans over total assets seems to improve profitability with a positive effect on NIM, but not necessarily on ROAA and ROAE (which takes directly into account LLPs). Moreover, we find that loans growth can improve bank profits; coherently with Foos et al. (2010), this growth must be conscious and wisely based on a risk-return approach to mitigate potential adverse effect over LLPs.
As expected, lower cost income ratios have a positive effect over profitability. Moreover, results indicate that banks profits are associated to higher capital resources (i.e. low leverage); this outcome explains the concerns of the authorities about regulatory capital adequacy of the banking system. On the contrary, dimension per se (as measured by total assets), does not show a significant impact over bank profitability in the period under investigation; a more crucial role is played by bank specialization.
Saving e Cooperative banks are in fact associated to lower profitability levels in our dataset; being strongly close to the territory makes banks more sensitive to local shocks. Their mutualistic nature emphasizes the commitment to local environment, leading these banks to act as a social security cushion, especially during harsh times. Moreover, the reduced importance of soft information in the process of credit evaluation introduced by Basel II (and confirmed by Basel III) may permanently mitigate the historical advantages of a relationship banking approach, which has been always the ‘ace in the hole’ of these types of banks.
We find a discontinuity between different profitability measures, which often have been used in literature to provide reciprocal robustness checks to regressions: in effect NIM shows results that are sometimes really different from ROAA and ROAE. This fact may raise concerns about the impact of non-recurring elements in banks income statements on traditional profitability measures and hence may open a debate about the best key performance indicator. In this line, ECB (2010) has stated that “a consistent framework for measuring banks’ performance may incorporate more insider data than those used for ROE, but may also provide a good equilibrium between providing a reasonable level of insider information (namely as regards business strategy and risks associated with each business line) and relatively simple and comparable indicators”.
We need to bear in mind that beside the traditional dynamics related to competition and the costs linked to the compliance to the new regulatory frameworks, also the ‘long wave’ of non-performing loans and LLPs deriving from the recent economic downturn are likely to affect bank profitability still in the future. Improving efficiency and finding a sound competitive positioning will be fundamental to deal with these problems, maintaining a sufficient profitability in order to meet capital requirements and be attractive on capital markets.
References
Abreu, M., & Mendes, V. (2001). Commercial bank interest margins and profitability: evidence for Some EU Countries, Proceedings of the Pan-European Conference Jointly organized by the IEFS-UK & University of Macedonia Economic and Social Sciences, Thessaloniki, Greece, May 17-20.
Albertazzi, U., & Gambacorta, L. (2009). Bank profitability and the business cycle. Journal of Financial
Stability, 5, 393-409. https://doi.org/10.1016/j.jfs.2008.10.002
Alexious, C., & Sofoklis, V. (2009). Determinants of Bank Profitability: Evidence from the Greek Banking Sector. Economic Annals, LIV(182), 93-118. https://doi.org/10.2298/EKA0982093A
Alper, D., & Anbar, A. (2011). Bank specific and macroeconomic determinants of commercial bank profitability: Empirical evidence from Turkey. Business and Economic Research Journal, 2(2), 139-152.
Athanasoglou, P., Brissimis, S. N., & Delis, M. (2008). Bank-specific, industry-specific and macroeconomic determinants of bank profitability. Journal of International Financial Markets, Institutions and Money, 18, 121-136. https://doi.org/10.1016/j.intfin.2006.07.001
Athanasoglou, P., Delis, M., & Staikouras, C. (2006). Determinants of Bank Profitability in the South Eastern European Region, MPRA Paper No.10274. Retrieved from http://mpra.ub.uni-munchen.de/10274/
Beckmann, R. (2007). Profitability of Western European banking systems: panel evidence on structural and cyclical determinants, Deutsche Bundesbank Discussion Paper, Series 2: Banking and Financial Studies No.17/2007.
Beltratti, A., & Stulz, R. M. (2012). The credit crisis around the globe: Why did some banks perform better?
Journal of Financial Economics, 105(1), 1-17. https://doi.org/10.1016/j.jfineco.2011.12.005
Bolt, W., de Haan, L., Hoeberichts, M., van Oordt, M. R. C., & Swank, J. (2012). Bank profitability during recession. Journal of Banking and Finance, 36, 2552-2564. https://doi.org/10.1016/j.jbankfin.2012.05.011 Bourke, P. (1989). Concentration and other determinants of bank profitability in Europe, North America and
Australia. Journal of Banking and Finance,13(1), 65-79. https://doi.org/10.1016/0378-4266(89)90020-4 Brighi, P., & Venturelli, V. (2014). How do income diversification, firm size and capital ratio affect performance?
Evidence from bank holding companies. Applied Financial Economics, 24, 1375-1392. https://doi.org/10.1080/09603107.2014.925064
Chronopoulos, D. K., Liu, H., McMillan, F. J., & Wilson, J. O. S. (2015). The dynamics of US bank profitability.
The European Journal of Finance, 21(5), 426-443. https://doi.org/10.1080/1351847X.2013.838184
Demirguc-Kunt, A., & Huizinga, H. (1999). Determinants of Commercial Bank Interest Margins and Profitability: Some International Evidence. The World Bank Economic Review, 13(2), 379-408. https://doi.org/10.1093/wber/13.2.379
Demirguc-Kunt, A., & Huizinga, H. (2000). Financial Structure and Bank Profitability, World Bank Policy Research Working Paper, no.2430, august.
Dietrich, A., & Wanzenried, G. (2011). Determinants of bank profitability before and during the crisis: Evidence from Switzerland. Journal of International Financial Markets, Institutions & Money, 21, 307-327. https://doi.org/10.1016/j.intfin.2010.11.002
Dietrich, A., & Wanzenried, G. (2014). The determinants of commercial banking profitability in low-,middle, and high-income countries. The Quarterly Review of Economics and Finance, 54, 337-354. https://doi.org/10.1016/j.qref.2014.03.001
ElKelish, W. W., & Tucker, J. (2015). Property Rights Institutions and Bank Performance Across Countries.
Managerial Finance, 41, 80-101. https://doi.org/10.1108/MF-10-2013-0288
European Central Bank. (2010). Beyond ROE – How to measure bank performance. Appendix to the Report on EU Banking Structures, September.
European Central Bank. (2015). Recommendation on dividend distribution policies, January.
Flamini, V., McDonald, C., & Schumacher, I. (2009). The determinants of commercial bank profitability in Sub-Saharan Africa, IMF Working Paper, No. 09/15.
Foos, D., Norden, L., & Weber, M. (2010). Loan growth and riskiness of banks. Journal of Banking and Finance,
34, 2929-2940. https://doi.org/10.1016/j.jbankfin.2010.06.007
Genay, H., & Podjasek, R. (2014). What is the impact of a low interest rate environment on bank profitability? Chicago Fed Letter, The Federal Reserve Bank of Chicago, n.324, July.
Goddard, J., Liu, H., Molyneux, P., & Wilson, J. O. S. (2011). The persistence of bank profit. Journal of Banking
and Finance, 35, 2881-2890. https://doi.org/10.1016/j.jbankfin.2011.03.015
Goddard, J., Liu, H., Molyneux, P., & Wilson, J. O. S. (2013). Do Bank Profits Converge? European Financial
Management, 19(2), 345-365. https://doi.org/10.1111/j.1468-036X.2010.00578.x
Goddard, J., Molyneux, P., & Wilson, J. O. S. (2004a). The profitability of European Banks: A Cross-Sectional and Dynamic Panel Analysis. The Manchester School, 72(3), 363-381. https://doi.org/10.1111/j.1467-9957.2004.00397.x
Goddard, J., Molyneux, P., & Wilson, J. O. S. (2004b). Dynamics of Growth and Profitability in Banking.
Journal of Money, Credit and Banking, 36(6), 1069-1090. https://doi.org/10.1353/mcb.2005.0015
Golin, J. (2013). The Bank Credit Analysis Handbook: A Guide for Analyst, Bankers and Investors, John Wiley & Sons.
Javaid, S., Anwar, J., Zaman, K., & Gafoor, A. (2011). Determinants of bank profitability in Pakistan: Internal factor analysis. Mediterranean Journal of Social Sciences, 2(19), 59-78.
Kanas, A., Vasiliou, D., & Eriotis, N. (2012), Revisiting bank profitability: A semi-parametric approach. Journal
of International Financial Markets, Institutions & Money, 22, 990-1005.
https://doi.org/10.1016/j.intfin.2011.10.003
Kasselaki, M. T., & Tagkalakis, A. O. (2014), Financial soundness indicators and financial crisis episodes.
Annals of Finance, 10(4), 623-669. https://doi.org/10.1007/s10436-013-0233-6
Kok, C., Moré, C., & Pancaro, C. (2015), Bank profitability challenges in euro area banks: the role of cyclical and structural factors, Financial Stability Review, May, 134-145.
Lusignani, G., & Onado, M. (2014). A long-term approach to Italian banks’ profitability. Paradise lost? The
Journal of Financial Perspectives, 2, 1-26.
Misra, S. D. (2015), Determinants of bank profitability in India. The International Journal of Indian Culture and
Business Management, 10(2), 193-211. https://doi.org/10.1504/IJICBM.2015.068170
Molyneux, P., & Thornton, J. (1992). Determinants of European bank profitability: A note. Journal of Banking
and Finance, 16, 1173-1178. https://doi.org/10.1016/0378-4266(92)90065-8
Olson, D., & Zoubi, T. (2011) Efficiency and bank profitability in MENA countries. Emerging Market Review,
12, 94-110. https://doi.org/10.1016/j.ememar.2011.02.003
Pasiouras, F., & Kosmidou, K. (2007). Factors influencing the profitability of domestic and foreign commercial banks in the European Union. Research in International Business and Finance, 21, 222-237. https://doi.org/10.1016/j.ribaf.2006.03.007
Rasiah, D. (2010), Review of Literature and Theories on Determinants of Commercial Bank Profitability.
Journal of Performance Management, 23(1), 23-49.
Saeed, M. S. (2014). Bank-related, Industry-related and Macroeconomic Factors Affecting Bank Profitability: A Case of the United Kingdom. Research Journal of Finance and Accounting, 5, 42-50.
Short, B. (1979). The relation between commercial bank profit and banking concentration in Canada, Western Europe and Japan. Journal of Banking and Finance 3(3), 209-219.
https://doi.org/10.1016/0378-4266(79)90016-5
Trujillo-Ponce, A. (2013). What determines the profitability of banks? Evidence from Spain. Accounting and
Finance, 53, 561-586. https://doi.org/10.1111/j.1467-629X.2011.00466.x
Weigand, R. A. (2015). A Tale of Two Banking Systems: The Performance of U.S. and European Banks in the 21st Century. Investment Management and Financial Innovations, 11(1), 8-24. https://doi.org/10.2139/ssrn.2547758
Copyrights
Copyright for this article is retained by the author(s), with first publication rights granted to the journal.
This is an open-access article distributed under the terms and conditions of the Creative Commons Attribution license (http://creativecommons.org/licenses/by/4.0/).