UNIVERSITY OF SASSARI
PhD School in Biomedical Sciences
Curriculum in Physiology, Morphology and Physiopathology of the Nervous System
Cycle XXVIII
Director: Professor Andrea Fausto Piana
Translational approaches in
neurorehabilitation:
from Researc
her’s bench to Patient’s bedside
Supervisor:
Prof. Franca Deriu
PhD Candidate:
Dr. Andrea Manca
2
Dr. Manca Andrea - “Translational approaches in neurorehabilitation: from Researcher’s bench to Patient’s bedside” PhD Thesis in Physiology, Morphology and Physiopathology of the Nervous System - PhD School in Biomedical Sciences
UNIVERSITY OF SASSARI
Introduction 6
Study 1. Isokinetic testing of muscle performance: new concepts for strength
assessment. 9
1.1 ABSTRACT 10
1.2 INTRODUCTION 11
1.3 METHODS 13
1.3.1 Participants 13
1.3.2 Muscle Performance Testing 13
1.3.3 Data analysis 14
1.3.4 Correlation analysis 15 1.3.5 Principal component analysis (PCA) 15
1.4 RESULTS 15
1.5 DISCUSSION 16
1.5.1 Linear correlation analysis 17 1.5.2 Principal Component Analysis 18
1.6 CONCLUSIONS 19
1.7 Table And Figure 21
1.8 REFERENCES 23
Study2 : Characterization of ankle dorsiflexors performance in healthy subjects following maximal-intensity isokinetic resistance training 26
2.1 Abstract 27
2.2 Introduction 27
2.3 Methods 29
2.3.1 Participants 29
2.3.2 Study design 29
2.3.3 Muscle Performance Testing 30 2.3.4 Intervention protocol 30
2.3.5 Data analysis 31
2.4 Results 32
2.4.1 Changes in muscle performance after training 32 2.4.2 Linear correlation analysis 33 2.4.3 Principal component analysis 34
2.5 Discussion 34
2.5.1 Training-induced changes in muscle performance 35
3
Dr. Manca Andrea - “Translational approaches in neurorehabilitation: from Researcher’s bench to Patient’s bedside” PhD Thesis in Physiology, Morphology and Physiopathology of the Nervous System - PhD School in Biomedical Sciences
UNIVERSITY OF SASSARI
2.5.3 Principal component analysis 37 2.5.4 Response of dynamometric variables to high-intensity exercise 38
2.6 Conclusions 39
2.7 Table And Figure 41
2.8 References 46
Study 3: A comprehensive assessment of the Cross-training effect in ankle
dorsiflexors of healthy subjects: a randomized controlled study 49
3.1 Abstract 50
3.2 Introduction 50
3.3 Methods 52
3.3.1 Participants 52
3.3.2 Trial design and protocol 53 3.3.3 Muscle Performance Testing 53
3.3.4 Intervention 54
3.3.5 Contralateral transfer of strength and muscle work 55 3.3.6 Statistical analysis 55
3.4 Results 56
3.4.1 Cross-Training of muscle performance by PT 57 3.4.2 Cross-Training of muscle performance by MW 57 3.4.3 Work-to-peak torque relationship 58
3.5 Discussion 59
3.5.1 The Cross-Training effect in ankle dorsiflexors 59 3.5.2 Relationship between peak torque and maximal work 61
3.6 Conclusions 62
3.7 Table And Figure 63
3.8 References 68
Study 4: Isokinetic cross-training effect in foot drop following common peroneal
nerve injury 71 4.1 Abstract 72 4.2 Background 73 4.3 Methods 73 4.3.1 Case Description 73 4.3.2 Intervention 74 4.3.3 Assessment procedures 74
4
Dr. Manca Andrea - “Translational approaches in neurorehabilitation: from Researcher’s bench to Patient’s bedside” PhD Thesis in Physiology, Morphology and Physiopathology of the Nervous System - PhD School in Biomedical Sciences
UNIVERSITY OF SASSARI
4.4 Results 75
4.5 Discussion 76
4.6 Table And Figure 77
4.7 References 78
Study 5: Reproducibility and responsiveness of strength measurements in patients
with multiple sclerosis 79
5.1 Abstract 80
5.2 Introduction 80
5.3 Methods 82
5.3.1 Participants 82
5.3.2 Muscle Strength Testing 83
5.3.3 Data analysis 84
5.4 Results 85
5.4.1 Difference by means 86
5.4.2 Reproducibility and responsiveness 86
5.5 Discussion 87
5.5.1 Reproducibility 87
5.5.2 Responsiveness 89
5.6 Conclusions 89
5.7 Table And Figure 91
5.8 References 94
Study 6: Time-course and implications of strength adaptations following high
intensity resistance training in patients with multiple sclerosis 98
6.1 Abstract 99
6.2 Introduction 100
6.3 Methods 101
6.3.1 Participants 101
6.3.2 Muscle strength assessment 102
6.3.3 Intervention 103
6.3.4 Data analysis 104
6.4 Results 105
6.4.1 Reproducibility and responsiveness of maximal strength measurements 105 6.4.2 Time course of changes in maximal strength following training 106
5
Dr. Manca Andrea - “Translational approaches in neurorehabilitation: from Researcher’s bench to Patient’s bedside” PhD Thesis in Physiology, Morphology and Physiopathology of the Nervous System - PhD School in Biomedical Sciences
UNIVERSITY OF SASSARI
6.5.2 Study Limitations 110
6.6 Conclusions 110
6.7 Table And Figure 111
6.8 References 113
Study 7: The effect of contralateral strength training on muscle weakness in people with multiple sclerosis: a proof-of-concept case series. 117
7.1 Abstract 118
7.2 Introduction 119
7.3 Materials and methods 120
7.3.1 Subjects 120
7.3.2 Design 121
7.3.3 Muscle Strength Testing 122 7.3.4 Clinical and functional assessment 122
7.3.5 Intervention 123 7.3.6 Data analysis 123 7.4 Results 125 7.4.1 Group results 125 7.4.2 Individual results 127 7.5 Discussion 128 7.5.1 Group-level analysis 128 7.5.2 Individual-level analysis 130 7.5.3 Strengths and limitations of the study 131
7.6 Conclusions 132
7.7 Table And Figure 133
7.8 References 144
6
Dr. Manca Andrea - “Translational approaches in neurorehabilitation: from Researcher’s bench to Patient’s bedside” PhD Thesis in Physiology, Morphology and Physiopathology of the Nervous System - PhD School in Biomedical Sciences
UNIVERSITY OF SASSARI
Introduction
7
Dr. Manca Andrea - “Translational approaches in neurorehabilitation: from Researcher’s bench to Patient’s bedside” PhD Thesis in Physiology, Morphology and Physiopathology of the Nervous System - PhD School in Biomedical Sciences
UNIVERSITY OF SASSARI
Exercise physiology studies the acute and chronic responses of biological systems to exercise. It provides sports and medical practitioners with updated evidence-based tools to optimize and fine-tune the training process in order to obtain the highest and most appropriate adaptations to a wide range of exercise conditions. Scientific reports on this topic provide guidance on the proper assessment of motor functions as well as on the best methodologies to improve them through training regimens. While such approach is conventionally employed when the athlete’s performance is scheduled for analysis and enhancement, this is not the case of individuals presenting with neurological conditions whose functional impairments and consequent disability are generally addressed through quite elementary training approaches. In the consideration of such discrepancy, the endeavor of the present work was to verify the feasibility of translating evidence-based methodologies and techniques from exercise and sports physiology to the neurological environment.
Is this approach feasible? Is it appropriate?
Is it dangerous? Is it effective?
To answer these question we started focusing on muscle strength since muscle weakness is among the most frequently reported disabilities induced by neurological disorders and dramatically affects the activities of daily living and, consequently, the quality of life of this category of patients.
Therefore, the project of the author’s PhD had as its primary objective the functional assessment and treatment of patients with diseases of the nervous system through the employment of methodologies developed and used in sports and exercise physiology research and their translation in the rehabilitation of neurological disorders. In this perspective, the main focus of this doctoral program was the appraisal of muscle strength in its biomechanical and functional components, first in populations of healthy subjects and immediately after in populations of individuals with neurological conditions, with a specific emphasis on multiple sclerosis. The rationale behind the project was that neurological patients do not fully benefit from the opportunities offered by functional assessment techniques that are crucial for the optimal quantification of disability but also of the best training methodologies which are essential to structure evidence-based and effective neurorehabilitation paths.
8
Dr. Manca Andrea - “Translational approaches in neurorehabilitation: from Researcher’s bench to Patient’s bedside” PhD Thesis in Physiology, Morphology and Physiopathology of the Nervous System - PhD School in Biomedical Sciences
UNIVERSITY OF SASSARI
In the author’s intention, the present PhD project report is meant to be viewed as a 7-stage journey, with seven published papers on muscle strength stepping from the healthy paradigm into the neurological patient’s bedside.
9
Dr. Manca Andrea - “Translational approaches in neurorehabilitation: from Researcher’s bench to Patient’s bedside” PhD Thesis in Physiology, Morphology and Physiopathology of the Nervous System - PhD School in Biomedical Sciences
UNIVERSITY OF SASSARI
Study 1. Isokinetic testing of muscle
performance: new concepts for
10
Dr. Manca Andrea - “Translational approaches in neurorehabilitation: from Researcher’s bench to Patient’s bedside” PhD Thesis in Physiology, Morphology and Physiopathology of the Nervous System - PhD School in Biomedical Sciences
UNIVERSITY OF SASSARI
1.1 ABSTRACT
Background: Peak torque (PT) is considered the most representative parameter of muscle performance in isokinetic dynamometry while other computable parameters such as mean peak torque (MPT), maximal work (maxW) and mean work (meanW) are generally neglected.
Objectives: This cross-sectional study reassessed whether PT is the only necessary parameter in isokinetic testing and weighed the contribution of each variable to muscle performance.
Methods: Thirty apparently healthy volunteers underwent unilateral isokinetic assessment of the ankle dorsiflexion of both legs at 45 and 90°/s. Bivariate relationships and multivariate associations between PT, MPT, maxW and meanW were examined employing Pearson’s analysis and principal component analysis (PCA), respectively.
Results: At both velocities, Pearson’s coefficients were very high between PT and MPT as well as between maxW and meanW (r>0.9; p<0.0001) and fair-to-good (r=0.65-0.73; p<0.0001) between torque and work measures. At 90°/s the PT and MPT mostly contributed to muscle performance while at 45°/s, MPT and meanW exhibited the highest component loadings, whereas PT performed poorly.
Conclusions: Isokinetic variables contributed with different loadings to muscle performance of ankle dorsiflexors, depending on the angular velocity employed. In particular, work measures may usefully complement the conventional PT-only analysis, especially in rehabilitative settings where low speeds are recommended.
11
Dr. Manca Andrea - “Translational approaches in neurorehabilitation: from Researcher’s bench to Patient’s bedside” PhD Thesis in Physiology, Morphology and Physiopathology of the Nervous System - PhD School in Biomedical Sciences
UNIVERSITY OF SASSARI
1.2 INTRODUCTION
Strength assessment allows accurate quantification of training or treatment efficacy as it provides baseline and post-intervention data [1]. Isokinetic dynamometry is considered the "gold standard" in the assessment of muscle strength with modern devices supplying trainers and clinicians with a plethora of parameters [2].Among these, the peak torque (PT) is conventionally considered the most consistent and reliable as well as the most commonly reported index in isokinetic tests [2, 3]. Although incorporated in testing reports other parameters such as the mean peak torque (MPT), work and power, are generally neglected [2, 4]. Several studies have analyzed the relationship between PT and the other strength parameters in lower limb muscle groups, including ankle plantar flexors and dorsiflexors [4] as well knee flexors and extensors in both physiological [5] and pathological conditions [7, 8]. In these reports, the finding of a moderate to high Pearson’s r correlation coefficient (in excess of 0.7) of PT with MPT, work and power, has led to the general belief that PT may be the only necessary parameter for isokinetic muscle performance testing [7]. Conversely, Kramer and MacDermid [8] stated that these measures were not identical and, in agreement with them, Dvir and David [9] specified that a high linear correlation per se does not necessarily render the interchangeable use of these parameters legitimate.
PT is defined as the highest muscular moment output along the tested range of motion and stands for the muscle’s maximum strength capability [3]. MPT represents, instead, the average moment based on a set of maximal repetitions. While PT and MPT are expected to be highly related, the relationships of PT with power and work deserve separate mentions.
Some devices measure the instantaneous peak power, while most of the available machines only report the average power. Since average power is calculated dividing the amount of work of a movement by the time required to accomplish it, its use in the interpretation of isokinetic data may raise collinearity concerns.
Regarding work, the average of the 'works' recorded over a set of repetitions is also known as the mean work (meanW); it h has been associated with endurance/fatigue
12
Dr. Manca Andrea - “Translational approaches in neurorehabilitation: from Researcher’s bench to Patient’s bedside” PhD Thesis in Physiology, Morphology and Physiopathology of the Nervous System - PhD School in Biomedical Sciences
UNIVERSITY OF SASSARI
analysis where the meanW of the last 3-5 repetitions is compared to the meanW of the initial 3-5 repetitions. However, the meanW is seldom if ever considered in isokinetic strength assessment. Maximal work (maxW) is the total muscular force output for the repetition with the greatest amount of work. A specific debate has been raised whether it should be reported along with PT or neglected since they have been shown to be equivalent, rendering the necessity of each measurement questionable [2, 4, 7]. Although PT and maxW are simultaneously recorded from the same repetition/joint movement, they provide quite different information: PT represents the single highest point of the curve whereas maxW is the total area under the best torque curve [5]. While PT is an instantaneous measure of strength exerted at one single point, maxW is the average measure of the torque output throughout the entire range of motion [6]. Morrissey suggested that performing only a PT-based analysis may lead to overestimation of the muscular torque output throughout the remaining range of motion [6]. For these reasons, maxW is considered a better indicator of muscle function than PT, particularly in rehabilitative settings [3, 9]. Although several reports have addressed this topic, to date and to our knowledge the relationships between PT, MPT, maxW and meanW have been investigated exclusively in terms of Pearson’s correlation coefficients.
The present study proposes, therefore, to reassess the conventional position whereby PT may be the only necessary parameter in isokinetic strength testing and to weigh the contribution of each variable to muscle performance. Such aim was pursued: i) using the ankle dorsiflexion muscles in view of their unique role in human locomotion functioning and of the clinical implications of their impairment [10]; ii) employing isokinetic dynamometry whose validity and reliability was verified by calculation of intraclass correlation coefficient (ICC); iii) employing the principal component analysis (PCA), which is a multivariate technique well-suited to find the most informative or explanatory data features, without needing an a priori knowledge [11]. This statistical approach converts a set of possibly correlated variables into a smaller set of values of linearly uncorrelated variables, called principal components, which retain most of the variation present in the original data set.
13
Dr. Manca Andrea - “Translational approaches in neurorehabilitation: from Researcher’s bench to Patient’s bedside” PhD Thesis in Physiology, Morphology and Physiopathology of the Nervous System - PhD School in Biomedical Sciences
UNIVERSITY OF SASSARI
1.3 METHODS
1.3.1 Participants
Thirty healthy untrained subjects were selected among university students and staff (21 males, 9 females; 26.7±4.6 years old; 70.5±12.0 kg) and deemed eligible to be enrolled in the present cross-sectional study. Participation in any sporting activity on a regular basis, even recreational, was set as a criterion for exclusion. All subjects signed an informed consent before enrollment. The study (ClinicalTrials.gov identifier: NCT02010398) was conducted in accordance with the Declaration of Helsinki and approved by the local Bioethics Committee of ASL n.1-Sassari, Italy (ID: Prot. 1160/L). All testing procedures were performed at a consistent time of the day and by the same operator. No verbal encouragements were provided during data collection, to avoid any bias deriving from the operator-subject interaction [12]. Data were collected in the laboratory of Human Physiology and Applied Neurophysiology of the Department of Biomedical Sciences, University of Sassari, from September 2013 to May 2014.
1.3.2 Muscle Performance Testing
Muscle performance of the ankle dorsiflexors (DF) was assessed using an isokinetic dynamometer (Biodex System 3 PRO, Biodex Medical Systems, Shirley, NY, USA). In a separate session, participants were allowed to become familiar with the dynamometer and with the proposed motor task consisting of isolated submaximal dorsiflexion of the ankle joint. Such procedure was employed to minimize the potential effects of learning associated to strength-testing procedures [13]. The apparatus was calibrated and assembled with the ankle attachment according to the manufacturer's specifications; gravity compensation analysis was performed by the software provided with the machine [14]. The dynamometer shaft was aligned with the assumed axis of rotation of the ankle (lateral malleolus). The subject was positioned with the knee flexed at 30° and
14
Dr. Manca Andrea - “Translational approaches in neurorehabilitation: from Researcher’s bench to Patient’s bedside” PhD Thesis in Physiology, Morphology and Physiopathology of the Nervous System - PhD School in Biomedical Sciences
UNIVERSITY OF SASSARI
the ankle in full plantar flexion taken as starting point. The position of the ankle was firmly secured to the dynamometer with supplied straps. Extraneous body movements were minimized by restraining each subject with shoulder harnesses, hip belts, mid-thigh and ankle restraint straps. During the tests subjects were not allowed to grasp the bench handles. Arms were placed across the chest with hands holding on to the straps [15].Before testing, participants underwent a predefined 5-minute warm up practise by performing one set of 6-8 submaximal repetitions at 45 and 90°/s, with a 2-3-minute rest in between. After a 5-minute rest, the following primary outcome parameters were recorded at both angular velocities: PT, MPT, maxW, meanW and average power. A retest procedure was performed within one week from the initial assessment, to estimate the reliability and consistency of the measurements. To this aim the intra-class correlation coefficients were calculated taking an ICC value <0.4 as an index of poor reliability, 0.4 to 0.75 fair to good reliability, and >0.75 excellent reliability [16].
1.3.3 Data analysis
Statistical analyses were performed using STATA 12 (StataCorp, College Station, Texas). Validity and reliability of measurements provided by the Biodex System 3 PRO were assessed employing a two-way random single measures intra-class correlation coefficient (ICC2,1) according to Shrout and Fleiss [16]. Sixty measures obtained from
the two limbs of thirty subjects were analyzed and considered together for statistical analysis since the variability of the distributions of the two limbs, previously calculated by the coefficient of variation, was not different between sides. Descriptive analyses were carried out for variables studied at each angular velocity. The Shapiro-Wilk test was used to assess normality of the variables. Since this assumption was met for all variables, the parametric Student’s t test was employed to evaluate the difference between the average measurements of muscle performance variables at both velocities. Prior to the multivariate approach, a preliminary regression analysis was performed to
15
Dr. Manca Andrea - “Translational approaches in neurorehabilitation: from Researcher’s bench to Patient’s bedside” PhD Thesis in Physiology, Morphology and Physiopathology of the Nervous System - PhD School in Biomedical Sciences
UNIVERSITY OF SASSARI
explore the appropriateness of the model [17]. This exploratory analysis revealed collinearity between average power and maximal work leading to discarding power from the subsequent analyses.
1.3.4 Correlation analysis
Pearson’s correlation analysis was used for bivariate correlation between PT, MPT, maxW and meanW at the two velocities.
1.3.5 Principal component analysis (PCA)
Principal component analysis was performed as a multivariate correlation approach aimed at finding the eigenvectors (factors) and eigenvalues, which indicate the amount of variance accounted for each component.
Kaiser-Meyer-Olkin measure of sampling adequacy was found to be meritorious (KMO index = 0.84) [18]. A scree plot of the eigenvalues associated with each factor was employed to determine the number of factors to retain: only those factors whose eigenvalues were greater than 1 were retained, according to the Kaiser method [19]. A variable was clearly considered to load on a factor if the loading on the factor was >0.5.
1.4 RESULTS
No drop-outs occurred in this study so data obtained from the 30 subjects screened and enrolled were analyzed. Descriptive statistics and the results of reliability analyses are both reported in Table1.
Mean values of performance at 45°/s were significantly higher than those recorded at 90°/s for all variables (p <0.0001). Concerning reliability, ICC coefficients were higher than 0.9 at both angular velocities.
16
Dr. Manca Andrea - “Translational approaches in neurorehabilitation: from Researcher’s bench to Patient’s bedside” PhD Thesis in Physiology, Morphology and Physiopathology of the Nervous System - PhD School in Biomedical Sciences
UNIVERSITY OF SASSARI
The correlation matrix of Pearson’s coefficients is reported in Table 2 at 90°/s and 45°/s. Statistically significant correlations between all muscle performance variables (PT, MPT, maxW and meanW) were observed at both angular velocities (p<0.0001). MPT and PT showed the highest correlation coefficients (Pearson’s r=0.96-0.97; p<0.0001). At both angular velocities, a fair-to-good Pearson’s correlation coefficient (Pearson’s r=0.65-0.73; p<0.0001) was found between torques (PT and MPT) and work measures (maxW and meanW).
Regarding PCA, only the first principal component of the total variance showed an eigenvalue >1 and was therefore extracted. The component extracted accounted for the largest amount of total variance in percentage (81% and 83% at 90°/s and 45°/s, respectively). The loading factors onto the first principal component are detectable by the one-dimensional representation in Figure 1. At 90°/s of angular velocity, the weights of the variables onto the component 1 were different, with torques (PT and MPT) and work measures (maxW and meanW) being organized in two clusters. Only PT and MPT showed loadings >0.50 (0.52 and 0.51, respectively). A different scenario was observed at 45°/s: all variables, in fact, are likely to contribute to muscle performance but, in this condition, only MPT and meanW showed a loading factor >0.50 (0.51 and 0.507, respectively).
1.5 DISCUSSION
The present study investigated in depth the relationships between PT, MPT, maxW and meanW and identified the parameters best describing muscle performance of the ankle DF. The classic linear correlation approach showed that these variables were highly associated, suggesting that they are equivalent in describing muscle performance. However, principal component analysis interestingly indicated that PT, MPT, maxW and meanW contributed with different weights to muscle performance, depending on the testing condition.
17
Dr. Manca Andrea - “Translational approaches in neurorehabilitation: from Researcher’s bench to Patient’s bedside” PhD Thesis in Physiology, Morphology and Physiopathology of the Nervous System - PhD School in Biomedical Sciences
UNIVERSITY OF SASSARI
1.5.1 Linear correlation analysis
Trial-to-trial reliability of measurements of the isokinetic Biodex System 3 PRO used in this study proved excellent (ICC= 0.93-0.98), both at 90°/s and 45°/s of angular velocity, confirming that this is a reliable and valid instrument for collection of dynamometric data [20, 21].
According to previous reports [2, 4, 6, 7]our study has yielded moderate to very high Pearson’s correlation coefficients between PT, MPT, maxW and meanW. This finding was expected since measurements were performed during the same muscle movement (PT and maxW) or the same repetition set (MPT and meanW). An acknowledged criterion for establishing interchangeability between different measurements is a correlation coefficient of at least 0.80 [22]. Consistently with data from knee extensors and flexors [6, 7] , the Pearson’s r >0.9 between PT and MPT we found in ankle DF suggests that these variables may be interchangeable, with one of the two finely representing the other, so that only one is strictly necessary, also when testing performance of this muscle group. The same applies to the relationship between maxW and meanW. As for the relationships between torque and work measures, the correlation coefficient we observed in the ankle DF was 0.6-0.7, in line with previous observations in the same muscle group [7]. In the light of the abovementioned criterion [22], interchangeability may not apply to these variables. Higher coefficients between PT and work were found in the knee flexors and extensors, which led to the conclusion that these variables are interchangeable [6, 23]. Discrepancies in the correlation coefficients reported in the literature raise issues on the role played by each variable contributing to muscle performance, which seems different depending on the muscle group [9]. As far as we know, no studies have examined yet the relationship between the anatomo-functional features of different muscle groups acting at different joints and the patterns of contribution to muscle performance in terms of PT, MPT, maxW and meanW.
Since Pearson’s coefficients between the variables were also quite similar at the two different angular velocities (90 and 45°/s), it seemed that linear correlation was unresponsive to changes in the testing condition. Such changes were instead revealed by
18
Dr. Manca Andrea - “Translational approaches in neurorehabilitation: from Researcher’s bench to Patient’s bedside” PhD Thesis in Physiology, Morphology and Physiopathology of the Nervous System - PhD School in Biomedical Sciences
UNIVERSITY OF SASSARI
the PCA approach, which better weighs the components of the total variance explained by each variable [24], thus defining the hierarchy of contributions to muscle performance more accurately than linear correlation analysis alone.
1.5.2 Principal Component Analysis
PCA, unlike linear correlation, proved to be quite sensitive in ranking the variables’ contributions to muscle performance depending on the angular velocity employed, which is a crucial concept in isokinetic testing and training. PCA works best when collinearity among variables is excluded [17] and when the variables in the original dataset are highly correlated [25]. In this case, fewer components are required to capture common information [26]. For these reasons, PCA was well-suited to our muscle performance variables which were highly correlated and with only one principal component extracted for analysis. This does not apply to average power which was found to be collinear with maximal work and, therefore, inappropriate for the PCA model.
At 90°/s the PT showed the highest loading factor on muscle performance being, therefore, the parameter best explaining its variability. This is consistent with previous reports that acknowledged PT as the most consistent and reliable parameter in isokinetic testing [2, 4]. However, this pattern was not confirmed at the testing condition of 45°/s, where MPT was the variable showing the highest loading factor, followed by meanW. In this testing condition, meanW and maxW performed better than PT, showing higher loading factors. This finding is in disagreement with previous works that, based on moderate to high correlation coefficients between the above considered variables, conventionally support PT-based analysis alone, acknowledging PT as well-representative of any other variable and possibly the only necessary parameter for isokinetic muscle performance testing [2, 4, 6, 7]. This opinion was questioned by other authors [8, 9], who stated that high linear correlations did not necessarily enable the
19
Dr. Manca Andrea - “Translational approaches in neurorehabilitation: from Researcher’s bench to Patient’s bedside” PhD Thesis in Physiology, Morphology and Physiopathology of the Nervous System - PhD School in Biomedical Sciences
UNIVERSITY OF SASSARI
interchangeable use of variables and concluded that muscle performance may be better represented by average than peak moments, depending on the muscle group and on the level of exertion [9]. In agreement with these reports our PCA-based data suggest that the considered variables contribute to muscle performance of ankle dorsiflexion muscles with a different weight, depending on the angular velocity. In particular, PT and MPT are likely to play a major role at intermediate velocities, which require a lower muscle effort, while MPT and meanW appear mainly involved at lower speeds requiring a higher level of exertion.
In this context, work analysis may offer valuable additional information to that attained by the conventional PT analysis, especially when low speed muscle contractions are employed, such as in the rehabilitation of neurological disorders [27, 28] and early phases of orthopaedic conditions [5].
However, extending these findings to muscle groups other than ankle DF could be inappropriate, since these muscles, particularly the tibialis anterior, are considered atypical from both the physiological and biomechanical points of view [29]. In this regard, it is worth mentioning that the tibialis anterior has a unique role in human locomotion during early stance phase, for preventing high-velocity plantarflexion, and during swing phase to ensure precision when the toe clears the floor [10, 29].
When choosing the variables best describing muscle performance, factors other than muscle group, angular velocity or level of exertion should be taken into proper account. For instance, work depends on the joint range of motion while PT is largely independent and, therefore, more reliable [30, 31, 32], whereas work and PT could be equally effective in endurance/fatigue analysis [33].
1.6 CONCLUSIONS
Despite the limited sample size that will need independent validation with further studies also in other muscle groups, the PCA findings, firstly reported in this study, may prove useful in choosing the most informative parameters of muscle performance in
20
Dr. Manca Andrea - “Translational approaches in neurorehabilitation: from Researcher’s bench to Patient’s bedside” PhD Thesis in Physiology, Morphology and Physiopathology of the Nervous System - PhD School in Biomedical Sciences
UNIVERSITY OF SASSARI
isokinetic strength testing and when assessing the efficacy of rehabilitative interventions. The analysis of not only the PT but also mean torques and work measures, depending on the velocity of contraction employed, may prove of interest both in sports science scenarios as well as in rehabilitation settings. Particularly, in the assessment of ankle DF, the critical role of PT as the gold standard in isokinetic analysis is well maintained at intermediate angular velocities, while, at lower angular velocities, work measures can complement the PT in providing a more comprehensive picture of muscle performance.
23
Dr. Manca Andrea - “Translational approaches in neurorehabilitation: from Researcher’s bench to Patient’s bedside” PhD Thesis in Physiology, Morphology and Physiopathology of the Nervous System - PhD School in Biomedical Sciences
UNIVERSITY OF SASSARI
1.8 REFERENCES
1. Stark T, Walker B, Phillips JK, Fejer R, Beck R. Hand-held dynamometry correlation with the gold standard isokinetic dynamometry: A systematic review. PM&R. 2011; 3(5):472-479.
2. Kannus P. Isokinetic evaluation of muscular performance: Implications for muscle testing and rehabilitation. Int J Sports Med. 1994; 15(1):11-18.
3. Davies, GJ. A Compendium of Isokinetics in Clinical Usage and Rehabilitation Techniques. 4th ed. Onalaska, WI. S. & S Publishers; 1992.
4. Woodson C, Bandy WD, Curis D, Baldwin D. Relationship of isokinetic peak torque with work and power for ankle plantar flexion and dorsiflexion. J Orthop Sports Phys Ther. 1995; 22(3):113-115.
5. Perrin DH, Robertson RJ, Ray RL. Bilateral isokinetic peak torque, torque acceleration energy, power, and work relationships in athletes and nonathletes. J Orthop Sports Phys Ther. 1987; 9(5):184-189.
6. Morrissey MC. The relationship between peak torque and work of the quadriceps and hamstrings after meniscectomy. J Orthop Sports Phys Ther. 1987; 8(8):405-408.
7. Bandy WD, Timm KE. Relationship between peak torque, work, and power for knee flexion and extension in clients with grade I medial compartment sprains of the knee. J Orthop Sports Phys Ther. 1992; 16(6):288-292.
8. Kramer JF, MacDermid J. Isokinetic measures during concentric-eccentric cycles of the knee extensors. Aust J Physiother. 1989; 35(1):9-14.
9. Dvir Z, David G. Average or peak moment: Which of the two is more suitable to represent isokinetic muscle strength? Isokinet Exerc Sci. 1995; 5(2):93-97.
10. Petersen NT, Pyndt HS, Nielsen JB. Investigating human motor control by transcranial magnetic stimulation. Exp Brain Res. 2003; 152(1):1-16.
11. Jolliffe IT. Choosing a Subset of Principal Components or Variables. In: Jolliffe IT, Principal Component Analysis. 2nd ed. Springer, 2009.
24
Dr. Manca Andrea - “Translational approaches in neurorehabilitation: from Researcher’s bench to Patient’s bedside” PhD Thesis in Physiology, Morphology and Physiopathology of the Nervous System - PhD School in Biomedical Sciences
UNIVERSITY OF SASSARI
12. Gandevia SC. Spinal and supraspinal factors in human muscle fatigue. Physiol Rev. 2001; 81(4):1725-1789.
13. Carroll TJ, Herbert RD, Munn J, Lee M, Gandevia SC. Contralateral effects of unilateral strength training: Evidence and possible mechanisms. J Appl Physiol. 2006; 101(5):1514-1522.
14. Biodex, Biodex System 3 Pro Manual (#835-000) Applications/Operations. Biodex Medical Systems, Inc, Shirley, NY; 1988.
15. Stumbo TA, Merriam S, Nies K, Smith A, Spurgeon D, Weir JP. The effect of hand-grip stabilization on isokinetic torque at the knee. J Strength Cond Res. 2001; 15(3):372-377.
16. Shrout PE, Fleiss JL. Intraclass correlation: uses in assessing rater reliability. Psychol Bull. 1979; 86(2): 430-428
17. Johnson RA, Wichern DW. Applied Multivariate Statistical Analysis. 6th Ed. Pearson, 2007.
18. Kaiser HF. A second generation Little Jiffy. Psychometrika. 1970; 35, 401-416. 19. Kaiser HF. The application of electronic computers to factor analysis. Educ Psychol
Meas. 1960; 20: 141-151
20. Drouin JM, Valovich-McLeod TC, Shultz SJ, Gansneder BM, Perrin DH. Reliability and validity of the biodex system 3 pro isokinetic dynamometer velocity, torque and position measurements. Eur J Appl Physiol. 2004; 91(1):22-29. 21. Örtqvist M, Gutierrez-Farewik EM, Farewik M, Jansson A, Bartonek Å, Broström
E. Reliability of a new instrument for measuring plantarflexor muscle strength. Arch Phys Med Rehab. 2007; 88(9):1164-1170.
22. Burdett RG, Van Swearingen J. Reliability of isokinetic muscle endurance tests. J Orthop Sports Phys Ther. 1987; 8(10):484-488.
23. Kannus VP, Latvala K. Torque acceleration energy, power and peak torque in thigh muscles after a previous knee sprain. Can J Appl Sport Sci. 1989; 14(2):103-106. 24. Jolliffe IT. Choosing a Subset of Principal Components or Variables. In: Principal
25
Dr. Manca Andrea - “Translational approaches in neurorehabilitation: from Researcher’s bench to Patient’s bedside” PhD Thesis in Physiology, Morphology and Physiopathology of the Nervous System - PhD School in Biomedical Sciences
UNIVERSITY OF SASSARI
25. Delis I, Berret B, Pozzo T, Panzeri S. A methodology for assessing the effect of correlations among muscle synergy activations on task-discriminating information. Front Comput Neurosci. 2013; 13: 7:54.
26. Manly BFJ. The material of multivariate analysis. In: Manly BFJ, Multivariate statistical methods: a primer, 3rd ed., Chapman & Hall/CRC, 2005.
27. Griffin JW, McClure MH, Bertorini TE. Sequential isokinetic and manual muscle testing in patients with neuromuscular disease. A pilot study. Phys Ther. 1986; 66(1):32-35.
28. El Mhandi L, Bethoux F. Isokinetic testing in patients with neuromuscular diseases: A focused review. Am J Phys Med Rehabil. 2013; 92(2):163-178.
29. Tallent J, Goodall S, Hortobágyi T, St Clair Gibson A, Howatson G. Corticospinal responses of resistance-trained and un-trained males during dynamic muscle contractions. J Electromyogr Kinesiol. 2013; 23(5):1075-81.
30. Reichard LB, Croisier JL, Katz-Leurer M, Malnati M, Dvir Z. Testing knee extension and flexion strength at different ranges of motion: an isokinetic and electromyographic study. Eur J Appl Physiol. 2005; 95:371-376.
31. Croisier JL, Malnati M, Reichard LB, Peretz C, Dvir Z. Knee extension and flexion strength and electromyographic activity at different ranges of motion: a reproducibility study. J Electromyogr Kinesiol. 2007; 17:484-492.
32. Reichard B, Katz-Leurer M, Rubinstein M, Croisier JL, Dvir Z. Short range of motion isokinetic testing of wrist flexors and extensors strength in normal subjects and patients with carpal tunnel syndrome. J Strength Cond Res. 2010; 24:1866-1873.
33. Porter MM, Holmbäck AM, Lexell J. Reliability of concentric ankle dorsiflexion fatigue testing. Can J Appl Physiol. 2002; 27(2):116-127.
26
Dr. Manca Andrea - “Translational approaches in neurorehabilitation: from Researcher’s bench to Patient’s bedside” PhD Thesis in Physiology, Morphology and Physiopathology of the Nervous System - PhD School in Biomedical Sciences
UNIVERSITY OF SASSARI
Study2 : Characterization of ankle
dorsiflexors performance in healthy
subjects following maximal-intensity
27
Dr. Manca Andrea - “Translational approaches in neurorehabilitation: from Researcher’s bench to Patient’s bedside” PhD Thesis in Physiology, Morphology and Physiopathology of the Nervous System - PhD School in Biomedical Sciences
UNIVERSITY OF SASSARI
2.1 Abstract
The objectives of this study were: to bilaterally characterize the performance of ankle dorsiflexion muscles (DF) in terms of peak moment (PM), mean PM (MPM), maximal work and mean work (meanW), before and after a unilateral 4-week isokinetic-concentric training of the dominant DF; to examine the inter-relationships among these isokinetic measures using linear correlation and principal component analysis.
Thirty healthy subjects (26.7±4.6 years old) were randomly assigned to a control or a training group. All dynamometric parameters increased significantly only in the training group for the trained leg (p<0.05), with greater gains in work (32-47% at 45°/s and 31-41% at 90°/s) than moment variables (14-18% at 45°/s and 14-28% at 90°/s). Similar increases in strength were also noted at both velocities in the untrained leg (p<0.01) for both work and moment parameters, depicting a cross-education effect. Correlations between ‘moments’ and ‘works’ increased in both legs after training from 0.59-0.77 to 0.79-0.95. Principal component analysis indicated that, at baseline, PM showed the highest weight on DF performance; after training, meanW at 90°/s and MPM at 45°/s exhibited the highest loadings.
High-intensity training of DF increased the ability in generating energy throughout the entire range of motion rather than maximizing the PM.
2.2 Introduction
Isokinetic dynamometry is considered the reference method for evaluating muscle performance (Dvir, 2004) which can be described in terms of several outcome parameters (Woodson et al., 1995) such as the peak moment (PM), mean peak moment (MPM), maximal work (maxW) and the mean work (meanW). Based strictly on linear correlation analysis, past research has indicated that the PM, also known as peak torque,
28
Dr. Manca Andrea - “Translational approaches in neurorehabilitation: from Researcher’s bench to Patient’s bedside” PhD Thesis in Physiology, Morphology and Physiopathology of the Nervous System - PhD School in Biomedical Sciences
UNIVERSITY OF SASSARI
was highly correlated with the other outcome variables and could efficiently serve as the only representative parameter required for the interpretation of isokinetic data (Woodson et al., 1995; Bandy and Timm, 1992; Morrissey, 1987; Kannus, 1994). However, using principal component analysis (PCA) a recent study has indicated that PM, MPM, maxW and meanW contributed with different weights to ankle dorsiflexors (DF) performance, depending on the angular velocity employed (Manca et al., 2015a). The authors have further suggested that in ankle DF, the critical role of PM as the gold standard in isokinetic analysis was well maintained at intermediate angular velocities. However, at lower angular velocities, work measures could complement PM in providing a more comprehensive picture of DF performance. This assumption of complementarity rather than interchangeability of the PM and work supports previous arguments arguing that these parameters were not identical (Kramer and MacDermid, 1989) despite being highly correlated (Dvir and David, 1995).
However, whether the notion of complementarity may be extended to cover different experimental conditions has not been subjected to scientific scrutiny so far. Indeed, past research focused merely on baseline conditions through observational studies (Morrissey, 1987; Kramer and MacDermid, 1989; Bandy and Timm, 1992; Kannus, 1994; Woodson et al., 1995; Dvir and David, 1995; Manca et al., 2015a) while none had analysed variations following the administration of a training protocol.
In the light of the above, clinicians should be encouraged to question the independence of these parameters by analyzing their inter-relationships both in physiological and pathological conditions.
Therefore, the objectives of this study were: to bilaterally characterize the performance of ankle dorsiflexion muscles (DF) in terms of PM, MPM, maxW and meanW, before and after a unilateral 4-week isokinetic-concentric training of the dominant DF; to examine the inter-relationships among these isokinetic measures using linear correlation and principal component analysis (PCA), a multivariate statistical technique which allows the retention of the most informative features in data without losing valuable information in the process of reduction analysis (Jolliffe, 2009).
29
Dr. Manca Andrea - “Translational approaches in neurorehabilitation: from Researcher’s bench to Patient’s bedside” PhD Thesis in Physiology, Morphology and Physiopathology of the Nervous System - PhD School in Biomedical Sciences
UNIVERSITY OF SASSARI
2.3 Methods
2.3.1 Participants
Thirty healthy untrained subjects were recruited among university staff (21 males, 9 females; 26.7±4.6 years old; 70.5±12.0 kg). The demographic characteristics of the participants are reported in Table 1. All participants were requested to avoid any regular sporting or recreational activity during the study. Participants signed an informed consent form. This study (ClinicalTrials.gov identifier: NCT02010398) was conducted in accordance with the Declaration of Helsinki and approved by the local Bioethics Committee of the Local Health Authority (ASL) n.1-Sassari, Italy (ID: Prot. 1160/L).
2.3.2 Study design
This was a parallel-group case-control study in a randomized 1:1 allocation ratio. After baseline evaluation, 30 envelopes were numbered consecutively and randomly assigned to an intervention (Training; n=15) or to a no-intervention (Control; n=15) group, with a blocking procedure employing Research Randomizer 3.0 software. Testing procedures were performed before (PRE) and after (POST) the experimental period by the same operator at the same time of the day. Both outcome assessors and statistician were blinded to the allocation group. Data were collected in the Department of Biomedical Sciences, University of Sassari (January-December 2014).
30
Dr. Manca Andrea - “Translational approaches in neurorehabilitation: from Researcher’s bench to Patient’s bedside” PhD Thesis in Physiology, Morphology and Physiopathology of the Nervous System - PhD School in Biomedical Sciences
UNIVERSITY OF SASSARI
2.3.3 Muscle Performance Testing
The primary outcomes, PM, MPM, maxW and meanW, were bilaterally assessed from the ankle DF on an isokinetic dynamometer (Biodex System 3 PRO, Biodex Medical Systems, Shirley, NY, USA) at baseline and within 1 week from the completion of the 4-week intervention. For each subject lower limb dominance was determined according to Hoffman et al. (1998). Before the actual testing participants were familiarized with the dynamometer in a separate session to abate the potential practice-based improvements associated with strength-testing procedures (Dvir and David, 1995). The device was calibrated and assembled with the ankle attachment positioned according to the manufacturer's specifications. The subject was seated with the knee flexed at 30° and the ankle in full plantar flexion as starting position. Gravity compensation was performed. Extraneous body movements were minimized by restraining each subject with shoulder harnesses, hip belts and mid-thigh straps. During the tests subjects’ arms were placed across the chest with hands holding on to the straps. Before testing, participants underwent a 5-min warm-up realized by performing 1 set of 6-8 submaximal repetitions at 45 and 90°/s, with a 3-min rest between the 2 angular velocities. After a 5-min rest the criterion test took place and consisted of 4 maximal repetitions at 45°/s and 6 repetitions at 90°/s. The dominant leg was tested first with a 6-min rest between do6-minant and non-do6-minant side. No visual feedback or verbal encouragements were provided during testing (Gandevia, 2001). For reproducibility purposes, a retest procedure was executed within 1 week from the initial evaluation.
2.3.4 Intervention protocol
The DF of the dominant leg were arbitrarily chosen to be trained in the intervention group. The training protocol consisted of a 4-week unilateral isokinetic/concentric training, 4 days/week (Monday-Tuesday-Thursday-Friday), with an overall 25-minute
31
Dr. Manca Andrea - “Translational approaches in neurorehabilitation: from Researcher’s bench to Patient’s bedside” PhD Thesis in Physiology, Morphology and Physiopathology of the Nervous System - PhD School in Biomedical Sciences
UNIVERSITY OF SASSARI
duration per session. After a light warm-up subjects performed 3x4 and 3x6 maximal concentric repetitions at 45°/s and 90°/s, respectively, with a 2-min rest between sets. Participants were verbally encouraged during exercise and provided with a visual feedback displaying the real-time moment-angular position curve to motivate the achievement of maximal performance.
2.3.5 Data analysis
STATA 12 (StataCorp, College Station, Texas) was used for the statistical analysis. An a priori sample power analysis was performed assuming an expected effect size (Cohen’s d) of 0.6 and a statistical power of 0.80 at a 0.05 alpha level. For assessing test-retest relative reliability the 2-way random intra-class correlation coefficient for single measures (ICC2,1) was performed (Shrout and Fleiss, 1979). Absolute reliability
was also estimated with the standard error of measurement (SEM) (Weir, 2005). ICC and SEM scores were assessed separately in women and men to avoid gender-related bias deriving from between-gender strength differences (Almosnino et al., 2012). Sixty measures obtained from the 2 limbs of the 30 subjects were pooled since the coefficient of variation was not different between sides.
Demographic variables were analyzed at baseline with Student t-test or Chi-Square test, when appropriate. The Shapiro-Wilk test was used to assess normality. PRE to POST changes at each angular velocity were analyzed with a repeated-measures analysis of variance (ANOVA) with GROUP (training, control) and TIME (PRE, POST) as factors. When significance was achieved, pairwise comparisons with Bonferroni adjustment were used. The smallest real difference (SRD) was calculated to obtain a cut-off value for meaningful training-based gains (Lexell, 2005). Any training-based gain less than the cut-off value was attributed to a measurement error and discarded even if statistically significant. Cohen’s d effect size magnitudes (small≤0.5; moderate 0.51-0.79; large≥0.8) were also used to quantify differences in the data after intervention.
32
Dr. Manca Andrea - “Translational approaches in neurorehabilitation: from Researcher’s bench to Patient’s bedside” PhD Thesis in Physiology, Morphology and Physiopathology of the Nervous System - PhD School in Biomedical Sciences
UNIVERSITY OF SASSARI
Linear correlation coefficients (Pearson’s r) were used to evaluate the degree of linear relationship between all variables with respect to both the PRE- and POST assessments. The PCA was performed at PRE and POST to find the eigenvectors (factors) and eigenvalues. Sampling adequacy was established employing the Kaiser-Meyer-Olkin (KMO) measure (Kaiser, 1970). A scree plot of the eigenvalues associated with each factor was used to determine the number of factors to retain and only those showing eigenvalues greater than 1 were retained. A variable was clearly considered to load on a factor if the loading on the factor was >0.5.
2.4 Results
At baseline the 2 groups were statistically homogeneous for gender, age and weight (Table 1). In all thirty subjects the dominant leg proved to be significantly stronger than the non-dominant leg for all the outcome variables (PM, MPM, maxW and meanW) at 90°/s (all p<0.05) and 45°/s (all p<0.01). At baseline, no difference in the outcome parameters was detected between groups, in either limbs and at both velocities (Table 2).
Relative and absolute reliability measures (Table 2) indicate high reproducibility of measurements both at 45 and 90°/s, as indicated by ICC coefficients and SEM values, reported only for men, who made the majority of the group (21 out of 30). Regarding women, ICC coefficients were 0.87 at 45°/s and >0.92 at 90°/s, while SEM ranged ±0.5–1.1 at 45°/s and ±0.3–0.8 at 90°/s.
The value of the SRD was 9.8%, rounded conservatively to 10%. As a consequence, any training-based gain <10% was attributed to a measurement error and discarded even if statistically significant.
33
Dr. Manca Andrea - “Translational approaches in neurorehabilitation: from Researcher’s bench to Patient’s bedside” PhD Thesis in Physiology, Morphology and Physiopathology of the Nervous System - PhD School in Biomedical Sciences
UNIVERSITY OF SASSARI
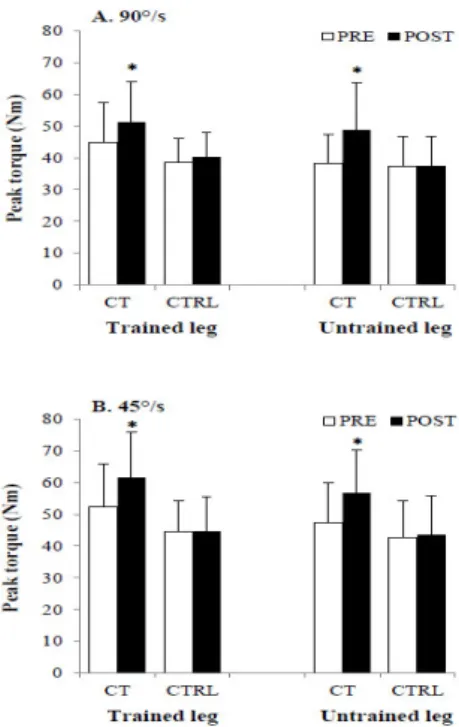
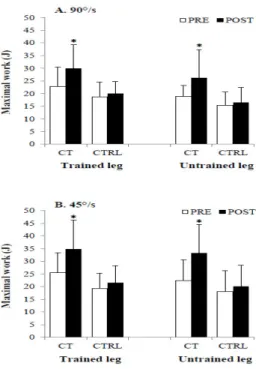
In the training group significant improvements in muscle performance occurred with high effect sizes (Cohen’s d >0.9) at both velocities in the trained side (Table 3) as well as in the contralateral untrained side (Table 4). All percent changes were above the 10% SRD value which served as the cut-off to discriminate true meaningful changes from random findings.
Greater gains were recorded for the work-related (maxW and meanW) compared to the moment-related (PM and MPM) outcome parameters in the trained side: 31-41% versus 14-28%, at 90°/s, and 32-47% versus 14-18% at 45°/s, respectively. In the untrained side, these improvements were even higher: 34-39% versus 26-27% at 90°/s, and 48-53% versus 11-20%, at 45°/s, respectively. No parallel significant gains were detected for any of the parameters in the control group. Significant main effects and interactions were found and detailed in Table 5.
2.4.2 Linear correlation analysis
Correlation analysis showed that all variables (PM, MPM, maxW and meanW) were significantly associated (p<0.0001). PRE to POST changes in correlations between all pairs of variables, expressed as Pearson’s r coefficients, are outlined in Table 6 by group, side and angular velocity.
At baseline the correlations between moment (PM versus MPM) and work (maxW versus meanW) parameters showed the highest correlation coefficients (0.74-0.97) at both velocities. However, the correlations between moment and work measures were only fair-to-good (0.59-0.77). Following training, an increase in the magnitude of the coefficients, both in the trained and untrained limb, was observed for all variables, particularly between moment and work measures at both velocities. By contrast, in the control group no parallel changes were observed. The correlation between PM and maxW, chosen as representative of the relationships between all variables which followed the same pattern, is graphically displayed at 90 (Figure 1) and 45°/s (Figure 2) for the training group.
34
Dr. Manca Andrea - “Translational approaches in neurorehabilitation: from Researcher’s bench to Patient’s bedside” PhD Thesis in Physiology, Morphology and Physiopathology of the Nervous System - PhD School in Biomedical Sciences
UNIVERSITY OF SASSARI
2.4.3 Principal component analysis
Only the first principal component of the total variance showed an eigenvalue >1 and was therefore extracted. The component extracted accounted for the largest amount of total variance in percentage (81% at 90°/s and 83% at 45°/s). The loading factors onto the first principal component were detected by the one-dimensional representation which showed changes in the contributions to muscle performance of each considered variable from PRE- to POST assessments at both angular velocities (Figures 3 and 4). In both groups at the PRE assessment, the weights of moment and work parameters onto the component 1 were different, depending on the angular velocity. The training group exhibited remarkable PRE to POST variations in loading factors as well as in the hierarchy of contributions of PM, MPM, maxW and meanW to muscle performance (Figures 3a and 4a). These variables appeared clearly scattered at baseline while gathered and packed around the cut-off value of 0.5 after training in the trained (Figure 3) and untrained (Figure 4) legs. On the other hand the control group evidenced no variation in the general pattern of distribution of the variables (Figure 3b and 4b).
2.5 Discussion
The present study characterized dynamometric parameters contributing to muscle performance of ankle DF in physiological baseline conditions and explored how resistance training of such muscles influenced the relationships among the isokinetic variables under scrutiny.
35
Dr. Manca Andrea - “Translational approaches in neurorehabilitation: from Researcher’s bench to Patient’s bedside” PhD Thesis in Physiology, Morphology and Physiopathology of the Nervous System - PhD School in Biomedical Sciences
UNIVERSITY OF SASSARI
2.5.1 Training-induced changes in muscle performance
PM, MPM, maxW and meanW significantly increased in the trained and untrained DF muscles after a 4-week maximal-intensity training of the dominant leg. SRD and SEM scores indicate that these changes are to be considered true rather than random findings. Changes in dynamometric parameters observed in the trained muscles following high-intensity training were expected (Heggelund et al., 2013). Work measures exhibited greater gains than moments at 90°/s (31-41% versus 14-28%) and 45°/s (32-47% versus 14-18%), as previously described (Manca et al., 2015b). These data suggest that maximal-intensity training of the DF exerts a higher impact on ‘works’ than ‘moments’ at both angular velocities.
A concomitant increase in these measures in the untrained side was expected as well, consistently with the occurrence of a cross-education phenomenon, i.e. the performance improvement in the untrained limb after training of the contralateral side (Zhou, 2000; Munn et al., 2004). Strength increases were greater in the untrained than trained leg, both in terms of work and moment measures. These findings are surprising since it is generally accepted that the gain of strength in the untrained limb is a 25-50% of that in the trained one (Zhou, 2000; Munn et al., 2004). Such apparently striking results may be explained by the high-intensity feature of the exercise employed in this study which highly impacts on neural factors considered responsible for the cross-education effect (Enoka, 1997; Zhou, 2000; Munn et al., 2004; Hortobágyi, 2005). Similar findings have been previously reported in the upper limbs where the preferential direction from dominant to non-dominant side has been accounted for the asymmetric response of the 2 limbs to training (Farthing et al., 2007). However, this might not apply to lower limbs where dominance is still controversial (Gentry and Gabbard, 1995). The physiological strength asymmetry between the 2 legs here observed at baseline might account for the proportionally higher response of the non-dominant (“weaker”) leg to training, since it may have wider margins for changes than the dominant (“stronger”) leg. Although isolated dorsiflexion employed in our protocol is a relatively simple motor task, we
36
Dr. Manca Andrea - “Translational approaches in neurorehabilitation: from Researcher’s bench to Patient’s bedside” PhD Thesis in Physiology, Morphology and Physiopathology of the Nervous System - PhD School in Biomedical Sciences
UNIVERSITY OF SASSARI
hypothesize that the occurrence of the cross-education effect may have occurred not only as a transfer of strength but also of motor skills in terms of optimal strategy to execute a maximal dorsiflexion against resistance along the isokinetic range of motion. It is noteworthy that the estimation of the magnitude of the training-induced improvements in muscle performance should take into proper account the familiarization/learning-effect, which is a serious concern in strength testing (Dvir and David, 1995). We are confident that the results were not substantially affected by the familiarization effect, since in DF muscles its magnitude was estimated as a non-significant 0.2-2.1% increase in PM and 9.8-11% in maxW, depending on the angular velocity (Manca et al., 2015b).
2.5.2 Linear correlation
After training the correlation between moment and work measures increased from fair-to-good (r=0.59-0.77) to very high (r=0.79-0.95), at 45 and 90°/s. These data on the relationship between PM and maxW in baseline conditions are consistent with previous reports (Woodson et al., 1995; Bandy and Timm, 1992; Morrissey, 1987; Kannus, 1994; Dvir and David, 1995; Kramer and MacDermid, 1989), while changes in correlation coefficients following training have not been addressed before. Remarkably, in the intervention group, the variation in linear coefficients calculated for the untrained DF followed the same pattern as the directly trained muscles. This is the first evidence of the occurrence of the cross-education phenomenon not only in terms of strength changes in the untrained limb but also as modifications in the relationships between variables contributing to the ‘cross-transferred’ muscle performance. Notably, the correlations PM versus MPM and maxW versus meanW were unchanged after training, probably due to a ceiling effect, being their Pearson’s r coefficients very high in baseline conditions already.
37
Dr. Manca Andrea - “Translational approaches in neurorehabilitation: from Researcher’s bench to Patient’s bedside” PhD Thesis in Physiology, Morphology and Physiopathology of the Nervous System - PhD School in Biomedical Sciences
UNIVERSITY OF SASSARI
2.5.3 Principal component analysis
The PCA approach proved well-suited to outline a hierarchical ranking among the 4 independent dynamometric variables here considered, allowing the retention of the most informative parameters describing the ankle DF muscle performance. To this regard, the loading factors of PM, MPM, maxW and meanW were employed to weigh their relative contributions to muscle performance. Our PCA-based data evidence that these parameters contribute to muscle performance of DF with different weights at baseline and that their loadings are remarkably influenced by training. In more detail, at 90°/s, PM showed the highest loading on muscle performance at baseline, thus being the parameter best explaining its variability in this condition, consistently with a previous PCA study (Manca et al., 2015a) and other reports based on linear correlation analysis (Woodson et al., 1995; Bandy and Timm, 1992; Morrissey, 1987; Kannus, 1994; Dvir and David, 1995; Kramer and MacDermid, 1989). After the intervention, the pattern of contributions of each variable to muscle performance changed, so that meanW was its best contributor, suggesting that high-intensity training may impact more on work than moment measures, in line with the observed percent changes in muscle performance (see above). At 45°/s the hierarchy of contributions was different in the 2 limbs of the training group: in the dominant trained leg PM proved to be the best determinant of muscle performance both at the PRE- and POST-assessments; in the non-dominant untrained leg the highest loadings were exhibited by MPM and PM at baseline and only by MPM after intervention. These different patterns suggest that the 2 legs may adopt different strategies which can be viewed in the perspective of the different roles they play while executing a motor task. In fact, it has been shown that the dominant and non-dominant lower limbs are differently specialized, with the former more involved in mobility and the latter in stability (Gentry and Gabbard, 1995).
The above findings indicate that PM, MPM, maxW and meanW are not interchangeable in line with previous studies (Dvir and David, 1995; Kramer and MacDermid, 1989)
38
Dr. Manca Andrea - “Translational approaches in neurorehabilitation: from Researcher’s bench to Patient’s bedside” PhD Thesis in Physiology, Morphology and Physiopathology of the Nervous System - PhD School in Biomedical Sciences
UNIVERSITY OF SASSARI
and in disagreement with other reports which acknowledged PM as the only parameter worthy to be retained (Bandy and Timm, 1992; Woodson et al., 1995).
2.5.4 Response of dynamometric variables to high-intensity exercise
The morphological variations detected by the correlation scatterplots as well as in the PCA loading plots evidenced a dynamic behavior of PM, MPM, maxW and meanW in response to maximal resistance training. In the training group these variables moved from PRE- to POST in a scatter-to-gather fashion, while no variation was detected in the controls in terms of ranking and/or morphological properties of their one-dimensional representation. This scatter-to-gather trend confirms that dynamometric parameters contribute differently to muscle performance (Manca et al., 2015a) depending on external conditions such as the angular velocity employed or the training administered. Notably, in the training group and with respect to both velocities, all variables showed a tendency to gather operating at the trained as well as the untrained sides and supporting the occurrence of the cross-education effect.
With specific regard to the lower angular velocity (45°/s), a different bilateral pattern of behavior was revealed in baseline conditions with variables showing a more packed distribution around the cut-off value of 0.5 in the dominant side and a clearly dispersed distribution in the contralateral leg. In particular, at baseline the work-related variables of the non-dominant DF contributed to muscle performance to a lesser extent than moments, compared to the dominant DF where all variables exhibited almost equal loadings, thus exerting quite similar weights on muscle performance. This discrepancy tended to diminish after the intervention since the bilateral distribution of the dynamometric variables became more symmetrical and packed around the cut-off value. After training, loadings exerted by work measures converged to the critical 0.5 cut-off value, further confirming that lower angular velocity training affected work- more than moment-related measures. These assumptions should be cautiously generalized to