Air transport connectivity of remote regions: The impacts of public
policies
Xavier Fageda (University of Barcelona)
Ancor Suárez-Alemán (Inter-American Development Bank) Tomás Serebrisky (Inter-American Development Bank) Reinaldo Fioravanti (Inter-American Development Bank)
Abstract: In this paper, we examine the impact of different public policies on air connectivity in
remote regions. In particular, we estimate price and supply equations using route level data for several countries around the world that have implemented route-based policies (public service obligations, traffic distribution rules), airline-based policies (state-owned airline) or passenger-based policies (discounts to residents). We find that policies generally achieve affordable prices and high frequency levels in protected routes in comparison to unprotected routes. However, the implementation of these policies may also be associated with some costs.
Key Words: remote regions; air transport; public service obligations; air connectivity.
Introduction
Air transport plays an important role in fostering development, particularly in facilitating economic integration, generating trade, and creating employment opportunities (The World Bank, 2018). It enables interaction on a global scale, thereby catalyzing globalization (Hummels, 2007) and spurring social and economic development (Brueckner, 2003; Bilotkach, 2015). Such importance may be particularly strong in remote areas where mobility is particularly difficult and costly. Air transportation is usually the only viable means of mobility in remote regions, which turns air transport services into a social right of communities.
However, not all air transport routes are economically attractive for airlines. The high fixed costs of operation mean that some routes will not be served under free market conditions. This may be the case in remote regions where airlines must operate with low traffic levels and/or
serve areas with low levels of development. Thus, public policy needs to play a significant role to support air connectivity in remote areas (ACRA).
The existing evidence shows a strong correlation between air connectivity and economic growth. Although, overall, the direction of causality is not always clear (Green 2002; Button et al. 2010), when it comes to remote regions the literature proves that air transport indeed boosts development (Özcan, 2014a; Baker et al, 2015). From an economic perspective, it must be acknowledged that the positive impact of improving connectivity is conditional on the existence of comparative advantages in the considered region – otherwise more connectivity could just lead to more imports to the area and an outflow of productive capacity (e.g. labor).
Most analyses on the economic impact of air transportation on regional economic and social connectivity typically only address the direct financial effects from aviation employment and spending (Tam and Hansman, 2002). However, there are wider economic effects to be acknowledged. Following Venables (2017), transport a) fosters intense economic interaction that raises productivity; b) shapes the level and location of private investment, unlocking residential development and triggering large scale redevelopment; and c) impacts the labor market, potentially enabling more workers to access jobs. These could also constitute additional motivations to subsidize air transport in certain areas. Also, one cannot fail to notice that some remote areas get subsidies since they are populated by the wealthy that can lobby for good access and/or are served by specific airlines.
Overall, the expected positive effects derived from connecting remote communities have led to the development of different public policies to support air connectivity in these regions. Fageda et al. (2018) group these policies into four categories:
• route-based policies: i.e., ensuring air connectivity in some specific routes (public service obligations-PSO) or establishing rules to distribute traffic among routes.
• passenger-based policies: i.e., through discounts to residents in some routes. • airline-based policies: i.e., establishing state-owned firms.
• airport-based policies: i.e., developing carrier incentive schemes or subsidizing airports. These policies have very different impacts. The appropriate policy instrument depends on the specific policy objectives, which could be summarized in facilitating the provision of affordable services (through prices) or guaranteeing service supply (through frequent flight schedule). Public service obligations in Europe, Malaysia and in the United States (known as essential air services); airport grants in the United States; discount to residents in Spain; traffic distribution rules in India; and state-owned airline in Colombia; provide air connectivity when the market does not solve the problem itself.
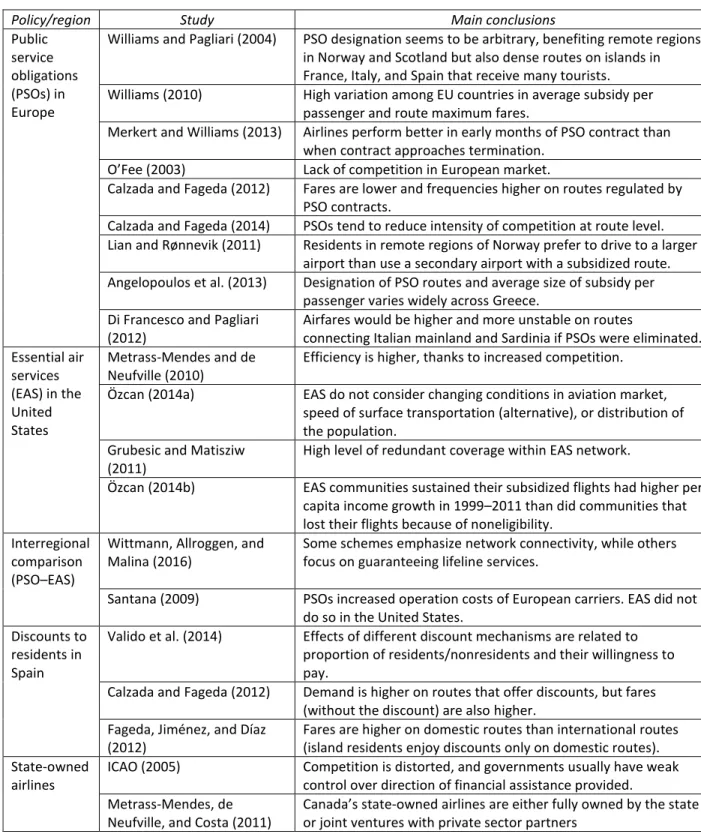
Whether these policies are or have been successful is not clear. Researchers have analyzed ACRA policies in single countries (see table A.1 in the Annex A for a detailed list of references and a summary of their findings). A few studies compare policies. Santana (2009), for example, compares public service obligations and essential air services policies, and Merkert and Hensher (2013) analyze differences between the public service obligation schemes in Europe and Australia.
This paper develops two empirical equations at the carrier-route level to estimate the impact of ACRA policies on the two most valued attributes of air services by passengers (Doganis 1985): prices and frequencies.
To this point, the potential positive impacts of these policies must be weighed against their costs. The amount of public subsidies used to implement these policies may be very high. Furthermore, they are not always implemented in remote regions as some protected routes can be served by other transportation modes and/or the level of air traffic in a free market scenario could be high. Finally, these policies may create a barrier for fear competition and provide weaker incentives for efficiency.
Several empirical papers have estimated the determinants of prices and frequencies using route level data. Regarding the determinants of prices, some remarkable examples include the works of Starkie and Starrs (1984), Windle and Dresner (1999), Goolsbee and Syverson (2008) and Bilotkach and Lakew (2014), among others. Regarding the determinants of frequencies, some remarkable examples include the works of Schipper et al. (2002), Bilotkach et al. (2010), Pai (2010), and Brueckner and Luo (2013). 1 The aim of these studies is to examine the role of route competition, airport dominance or low-cost carrier entry on fare and frequency choices of airlines. To this point, we would like to stress that only the works of Starkie and Stars (1984) and Bitzan and Junkwood (2006) put the attention on thin routes. Furthermore, none of the mentioned studies analyze the effects of ACRA policies.
We use similar control variables and a similar functional form as that used in these papers. Note that most of previous papers about prices and frequencies in the air transport market use data for United States obtained from the Department of Transportation. As far as we know, only Calzada and Fageda (2009) estimate the impact of PSOs in Spain using a similar econometric approach as that used here. Data in this latter study is from 2001-2009 and prices are obtained manually from airline websites.
Thus, we add to the previous literature by examining the impact on prices and frequencies of five different policies implemented in twelve countries to support air services in remote 1 For a detailed list and description of empirical papers on determinants of prices and frequencies, see Calzada and Fageda (2014).
regions by means of a multivariate econometric analysis. This paper is novel by studying the impact of different ACRA policies on prices and frequencies under a common analytical framework. So far, the literature has been mainly focused on the analysis of specific policies on a case-study basis. We use price and traffic data from Official Airlines Guide (OAG) that consider both local and connecting passengers and supply data that come from RDC aviation. Data is for the period 2010-2016. Previous studies focus generally the attention on PSOs in some European country or United States and they do not provide econometric estimates about the impact of these policies on prices and frequencies.
The rest of this paper is organized as follows. In Section 1, we explain the sample of countries and policies considered in the empirical analysis and provide some descriptive statistics of protected routes. In the next section, we develop the empirical models and deal with some econometric issues. Then, we explain the results of the regressions. The last section is devoted to providing the concluding remarks.
1. Sample and data
The empirical analysis focuses on countries in which a large number of routes are affected by some public policy and for which data are available. Table 1 indicates the countries considered in our analysis.
(table 1)
Public service obligations in Europe and essential air services in the United States represent the most documented policies. In the European Union, all programs are governed by a common legal framework defined by the European Commission, but national governments have autonomy in designating protected regions and determining service levels, fares, and the size of the subsidies. The aim of the legislation by the European Commission is to guarantee air services in poor regions or on thin routes where air transportation provides vital economic links. Other objectives, such as maintaining social cohesion and promoting tourism, may also guide the policy (Williams 2010). The regulation explicitly states that surface transportation should not be a viable option; the definition of a poor region or a thin route is left to the interpretation of the national governments that implement the program. In this paper, we examine the effect of this policy in the European countries where the scale of the program is higher; France, Greece, Italy, Norway, Portugal, Sweden and United Kingdom.
We also consider the effect of public service obligations in United States. The essential air services program in United States provide subsidies to airlines that serve 115 eligible communities (outside of Alaska) and 44 communities in Alaska. Congress established the program as part of the Airline Deregulation Act of 1978. Under the program, if an airline cannot provide air service to eligible communities without incurring a loss, the federal government
provides the airline with a subsidy to serve those communities. The scale of the scheme is similar to the entire EU program. We also consider the impact of the Small Community Air Service Development Grant Program in which the federal government may provide grants to small-hub or non-hub airports. Airports in Europe may also benefit from grants but, in contrast to US, there is not an official program and these grants may affect both small and large airports. In any case, data regarding airport grants is not available outside of US.
The use of discounts to residents in remote regions is another policy that can be used by countries. Countries that provide discounts to residents in remote areas include Ecuador, Portugal, Scotland, and Spain. Spain, the country analyzed in this study, devotes the most resources to provide such discounts in domestic links from/to islands (Fageda et al. 2018).
Another instrument to support air services in remote regions is the traffic distribution rules. The main example of this policy is India. India supports air services in remote regions through the Route Dispersal Guidelines (RDGs) program, which require airlines to distribute traffic across three categories of airports. Under this program, which is in effect since 1994, routes are classified into three categories. The program states that any airline that operates scheduled air transport service on one or more of the routes in Category I (the densest routes in the country) is required to provide service in Categories II and III. Several routes in category II serve remote areas.
Social services provided by state-owned airlines is another policy to support air services in remote regions. For our purposes, our interest here is in those countries that have remote regions and that have a state-owned regional airline that only operate in small airports of the national system. Taking this into account, the countries considered here are Colombia and Malaysia. In the case of Malaysia, the protected routes analyzed are operated by a state-owned airline through a contract with the government that determine price and supply decisions. Thus, the case of Malaysia is a combination of public services obligations with a state-owned firm.
The paper uses route-level data provided by the Official Airline Guide for traffic and fares and RDC Aviation for supply-side data. The Official Airline Guide provides Marketing Information Data Tapes (MIDT) through its Traffic Analyzer product.2 This dataset includes quarterly information since 2010 on total traffic and fares (in U.S. dollars) for both nonstop and connecting passengers. Data on traffic include all passengers. Data on fares include only bookings made through global distribution systems; bookings made directly with an airline are excluded. We consider mean fares so that we do not account for tariff structure or price discrimination. This is a limitation of our data that must be taken into account as fares charged by airlines are usually demand based
2 MIDT provide information about the origins and destinations of passengers, including data for local and connecting traffic by each operating airline between two airports.
through dynamic fare discrimination (yield management.) In this regard, one of the problems of publicly supporting air services is that there is not easy way of doing this efficiently in a free market where there is price discrimination. Usually it is the average fare that is supported in practice and this may be sub-optimal.
RDC Aviation provides data on the number of seats, flight frequency, size of the plane, and route distance (in kilometers). This dataset includes annual data for 2010–16. The routes covered in the two databases are not necessarily the same, because some routes are missing for one of the databases but not for the other.
The analysis compares fares and frequency of flights on protected and unprotected routes.3 Most policies were implemented before the initial year for which data are available, so that a before-and-after analysis could not be undertaken. The econometric analysis exploits the full panel data, using the period 2010–16. These data are unbalanced, because some pairs of airline routes do not have traffic in some periods.
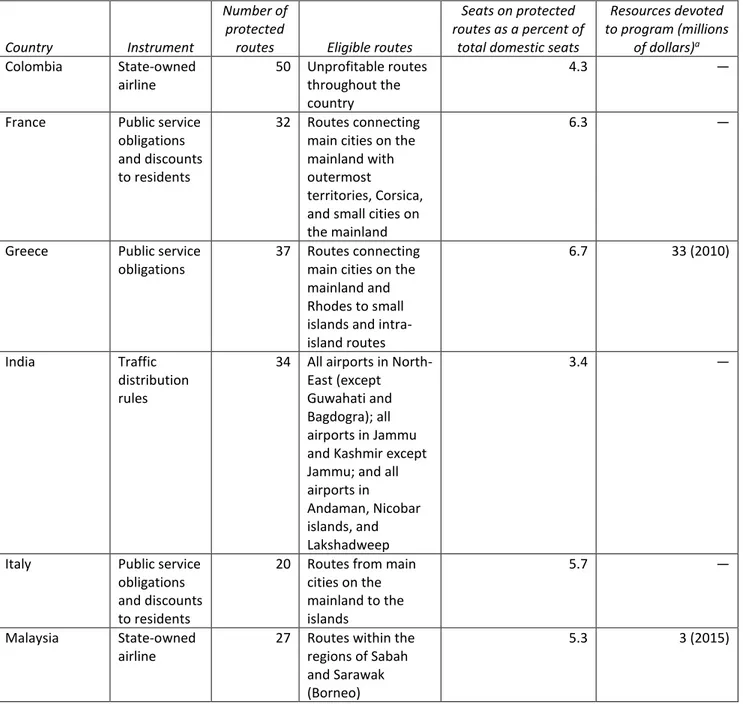
Tables B1 and B2 in appendix B describes and compares the protected routes included in the sample. The data used in these tables are for the most recent available year (2016), which may be more illustrative than mean values for the whole period. Table B1 provides details on the scale of the program in each country analyzed.
Spain and the United States have the most extensive network of routes covered by subsidies and spend the most resources on air connectivity. However, the percentage of seats on protected routes is tiny in the United States (0.2 percent) and very large in Spain (22 percent). The European countries with the largest number of routes covered by public service obligations are France (50), Norway (43), and Greece (37). Portugal (12) and Sweden (8) have more modest programs in terms of the number of routes covered. Within Europe, spending on public service obligations is highest in Norway ($82 million), Portugal ($68 million), and Greece ($33 million).
Protected routes represent about 5–7 percent of total domestic capacity in European countries, except in Sweden and the United Kingdom, where the share is less than 1 percent. The number of routes protected and the share they represent of total capacity is significant in Colombia, India, and Malaysia.
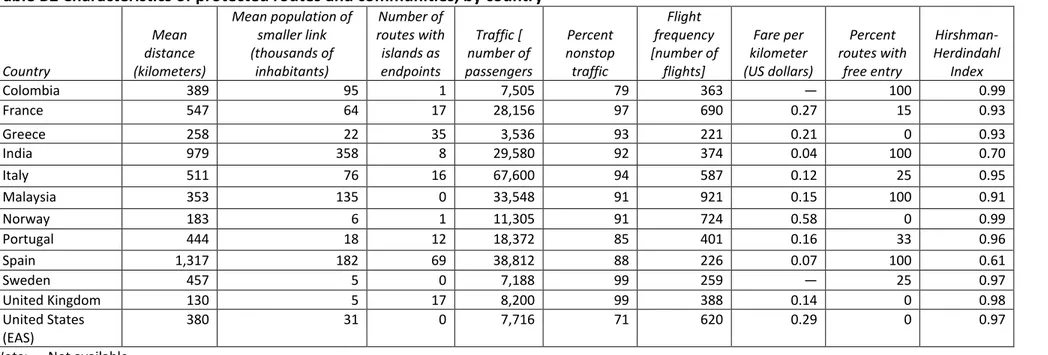
Table B2 reports data on the characteristics of protected routes. These routes are relatively thick in France, India, Italy, Malaysia, and Spain. Endpoints in these countries are often medium-size cities and/or places with high tourism intensity. In the other countries, protected routes are thin and serve areas with low populations (except in Colombia). Most traffic on protected routes 3 Fares could not be analyzed for Sweden or Colombia, because the dominant airlines on protected routes in both countries do not report fare data to the Official Airline Guide.
is point-to-point; the percentage of connecting traffic is very low. Only in Colombia and the United States network connectivity is relevant.
In Colombia, Malaysia, Norway, and the United States, protected routes are located in regions that are not remote. The mean distance on protected routes of these countries is relatively low, a high proportion of routes are shorter than 400 kilometers, and neither of the endpoints is an island. Surface transportation may be a viable option in such cases. In other countries, the level of remoteness is higher.
Finally, entry is not restricted in countries that do not use public service obligations: Colombia, Malaysia, India, and Spain.4 Among countries with public service obligations, entry is restricted in Greece, Norway, the United Kingdom, and the United States. In the other countries with public service obligations, the proportion of open routes is 15 percent in France, 25 percent in Italy and Sweden, and 33 percent in Portugal. In any case, the Hirshman-Herdindahl Index is high or very high in all countries. Note that in open routes airlines must fulfill the frequency and fare regulations without subsidies.
2. The empirical analysis
Two empirical equations are used to estimate the impact of ACRA policies on fares and frequency. All continuous variables are expressed in logarithms, so that the coefficients can be interpreted as elasticities. Our sample of routes is based on directional airport pairs being the origin airport the smaller one. The selection of control variables and the policies examined is based on data availability. Note also that any omitted variable that is time-invariant should be captured by the different fixed effects included in the regressions.
The pricing equation for airline a on route k in period t is as follows:
Log(Fares)akt = α + β1Log(Total traffic)akt-1 + β2 percentNonstop_trafficakt + β3Log(Distance)k +
+ β4Log(HHI)kt + β5Treated_routeskt + η’ap + η’a + ηyt + ηqt + (1)
Fare data are quarterly. Control variables include route characteristics related with the costs for airlines of operating in the route. In this regard, we include the total traffic that identify the potential exploitation of density economies; route distance that identify the potential exploitation of distance economies; and the percentage of nonstop traffic because the costs of serving nonstop travelers may be lower than those for connecting passengers. We also include a 4 Spain has public service obligations, but they are not analyzed here.
variable that provides a partial measure of competition. In particular, we include the Hirshman-Herdindahl Index (HHI) that is built as the sum of the squares of the shares of airlines operating on a route in terms of flight frequencies. Note here that a limitation of this variable is that it cannot control for airport competition as in some cases, particularly in the United States,there are plenty of small airports within easy driving distance of each other.
The frequency equation for airline a on route k in period t is as follows:
Log(Flight_frequency)akt = α + β1Log(Total traffic)akt-1 + β2Log(Distance)k + β3Log(Plane_size)k + β3Log(HHI)kt + Β4Treated_routeskt + η’ap + η’a + ηyt + εakt (2)
Frequency data are annual. Control variables include the total traffic in the route because supply is related positively with demand. We also include route distance as we can expect a negative relationship between frequency and route length. Furthermore, we include the plane size used by airlines because they may offer the same number of seats by using smaller planes at higher frequencies. Furthermore, we include the same measure of competition as in the fare equation.
The main variable of the analysis both in the fare and frequency equations is that refereed to the policy variable that differs for each country analyzed. The policy variable takes the value 1 for routes protected by any of the considered policies. Control routes are routes not affected by any of these policies. Note that for France, Italy and Portugal we can differentiate between two types of PSOs: 1) PSOs with restricted entry and with subsidies for the monopoly airline 2) PSOs with open market access and without subsidies. For United States, we can differentiate between two types of policies: 1) PSO with restricted entry, 2) The Small Community Air Service Development Program that provides grants to small airports to improve its facilities or execute specific incentive packages to carriers. This latter variable takes the value 1 from the year in which the small airport of the route has benefited from the grants.
The variable of total traffic is potentially endogenous. To deal with the potential simultaneous determination bias, we use the total number of seats offered at both airports of the route as instruments. This variable may work as a proxy of the demographic and economic size of both endpoints of the route.
In both equations (1) and (2), we add airport (η’ap), airline (η’a), year (ηyt), and quarter (ηqt) fixed effects (the latter applicable only in the fare equation) as controls. Doing so may allow us to control for unobserved heterogeneity that is time invariant.5
For the European countries that use PSOs on specific routes, treated routes are those affected by the imposition of this policy. Control routes are all domestic routes not affected by the policy. For India, the analysis is also for the whole domestic market. Treated routes are routes of category II. Control routes are routes of category I and III.
Treated routes for Malaysia are those routes served by MAswings under The Rural Air Services (RAS) scheme. Control routes are the domestic routes not affected by this scheme. The treated routes in Colombia are those monopolized by Satena while the control routes are the rest of domestic routes.
In Spain, we exploit the fact that discounts to residents of islands are applicable only to domestic routes. The sample is therefore restricted to domestic (treated routes) and international (control routes) routes originating from airports in the Canary and Balearic Islands. We also restricted the sample for the United States, because of its huge size and the fact that policies apply to very thin routes at small airports. For the United States, we focus on routes originating at nonhub primary airports (airports with more than 10,000 annual passengers but that represent less than 0.05 percent of total traffic in the United States) and nonprimary airports (airports with 2,500–10,000 passengers a year). Taking this into account, treated routes are those affected by the essential air services program and/or the small community air service development program.
To test for temporal and cross-sectional autocorrelation, we apply the Wooldridge test for autocorrelation in panel data. Such test show that autocorrelation may be present. Following Bertrand, Duflo, and Mullainathan (2004), we allow for an arbitrary variance-covariance structure by computing the standard errors in clusters by route to correct for autocorrelation in the error term at both the cross-sectional and temporal levels. Furthermore, the standard errors are robust to heteroscedasticity
3. Expected impacts of ACRA policies on prices and frequencies
We may expect to find differences in the impacts of the policies examined across the considered countries. Each country may have its specific goals, resources and tools to implement ACRA policies. Furthermore, the relative strength of the different interest groups affected by the 5 We do not include route fixed effects, because doing so would focus on the within-variation of the data, which is low or even null.
policy and the particularities of each air market may also explain differences in the results across countries. In this regard, government choices about which routes to protect, the amount of subsidies per passenger, entry restrictions, and the establishment of price caps and frequency floors are usually arbitrary. Taking this into account, we analyze below the expected impact of each of the different ACRA policies examined in the econometric analysis.
Public service obligations
In Europe, national governments have autonomy in implementing PSOs. Hence, one of the main criticisms of the European system are the high heterogeneity in the policy across countries and the discretional criteria for setting the levels of price-caps and frequency floors. In the United States, once it is demonstrated that the route cannot be operated on a commercial basis, airlines interested in receiving subsidies make proposals that include flight frequencies and fares. In contrast to the EU scheme, subsidies are calculated through objective parameters.
Taking this into account, we may expect similar prices and frequencies in protected and unprotected routes in the U.S. Indeed, the subsidies there are based on the costs of providing services so that the performance of protected routes should be similar to that expected on a free-market scenario. No clear a priori expectations may be derived for European countries. The subsidies are not necessarily based on the costs of providing services, and the levels of regulated prices and frequencies are usually a “political” decision. Hence, the impacts of the PSO policies in Europe will be linked to the specific objectives of that policy in each country.
Airport grants
The Small Community Air Service Development Grant Program in the United States provides funds for small airports to execute specific incentive packages to market existing air services or to gain additional service. In this regard, these U.S. grants may be applied to fund revenue guarantees, airport charges discounts, marketing initiatives, studies of air service feasibility, new airport equipment and infrastructure, and other incentives. Thus, the main expected effect of this policy should be an increase of traffic in routes departing from the beneficiary airports which is already captured by our demand variable. However, this program may also have a positive effect on frequencies if the grants are devoted to the improvement of airport equipment and infrastructure.
Discounts to Residents
The expected effect of the government subsidy to island residents in Spain is not clear a priori. On the one hand, we could expect lower fares given that an important proportion of travelers (island residents) are paying half of the full price. On the other hand, non-residents may be paying a higher price given that the discounts make the demand of island residents less elastic
and, consequently, airlines can set higher fares (without the subsidy). The effect of the discounts on frequencies is less clear, given that the potential effect on demand is already captured by the demand variable.
Traffic distribution rules
The implementation of traffic distribution rules in India implies a cross-subsidization between dense and thin routes. Taking this into account, we should expect similar frequencies in protected and unprotected routes since airlines are forced to increase capacity proportionally in dense routes with respect to routes that cover remote areas. Furthermore, the airlines that must fulfill this program operate with a fleet based on big aircrafts. The expected effect on prices is unclear.
State-owned airlines
State-owned airlines in Malaysia and Colombia provide services on a social basis so that they are not necessarily subject to the strong budgetary restrictions of private airlines that operate on a market basis. Hence, they could be providing services with lower fares and at higher frequencies than those they would offer in a free market scenario. However, entry into the routes in which these airlines operate is not restricted so that this could discipline their decision-making.
4. Estimation and Results
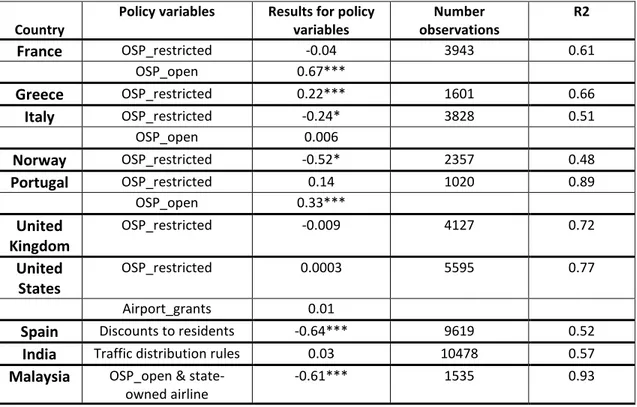
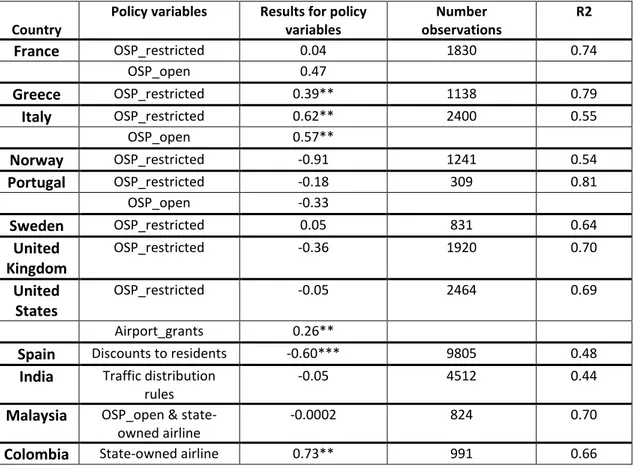
Tables 2 and 3 show the results of the main variable of interest, the policy variable, for the fare and frequency equations, respectively.
(table 2) (table 3)
For those countries implementing PSOs that involve public subsidies and restricted entry, the most common result is that prices and frequencies are similar for protected and unprotected routes. This result holds for France, Portugal, Sweden, United Kingdom and, as expected, for the United States. Frequencies are also similar in Norway but prices in protected routes are lower. In the case of Greece, fares and frequencies are higher for protected routes. For Italy, we find lower fares and higher frequencies in routes benefited from restricted PSOs.
The relatively good performance of protected routes is particularly remarkable in United Kingdom and Sweden as the PSO programs there spend a modest amount of resources and the protected routes are considerably remote or thin. In contrast, it is not clear that airlines cannot provide air services on a free subsidy basis on many protected routes in France, Italy, and to lower extent Portugal. Covered regions are not particularly poor, and route traffic density is high, because of tourist flows. Protected routes in countries like Norway or the United States are thin but intermodal competition may be feasible. In this regard, the amount of public resources devoted to PSOs in countries like Norway, Portugal or United States is important. Finally, note that we only find significant higher prices in protected routes for Greece but protected routes there are the thinnest in our sample and surface transportation is not viable because they usually connect the mainland with small islands. In addition, these higher prices are accompanied by higher frequencies.
The performance of routes affected by PSOs with free entry and without public subsidies is poorer for France and Portugal as we find evidence of higher prices while it seems to assure higher frequencies for Italy. In any case, note that the potential distortions involved in open PSOs should be minimal.
Furthermore, the performance of routes with airports that has been benefited from grants in United States is good as we find evidence that they allow for higher frequencies in routes departing for beneficiary airports. This result may be explained by the use of such grants to improve airport equipment and infrastructure. As we mention above, the amount of resources devoted to this program is modest and it does not restrict competition.
For India, we do not find significant differences neither in prices nor, as expected, in frequencies. This suggest that the traffic distribution rules policy can balance the offer of services between the different categories of routes. An advantage of this model is that it does not require the use of public funds. However, this policy is not exempt of costs as it involves a distortion on airline decisions on which routes operate and at which capacity. Furthermore, the implicit cross-subsidization between dense and thin routes may provide weak incentives to airlines to be efficient. Note also that protected routes are relatively dense, although intermodal competition from cars and trains may be weak.
When it comes to a state-owned airline, in Colombia, data availability only allows us to consider the impact of the state-owned policy on frequencies. Results suggest higher frequencies in routes operated by the state-owned airline on a social basis in comparison to the rest of domestic routes. For Malaysia, we find lower fares and no significant differences in frequencies. In contrast to the other PSO programs analyzed in this paper, the contract was awarded to a state-owned firm without competitive tendering. These results suggest that state-owned airlines
in Colombia and Malaysia may be effectively operating with soft budget constraints so that they set lower fares or higher frequencies that those set on a free-market basis.
A disadvantage of a state-owned airline is the lack of transparency in the use of public funds and the lack of incentives of the airline to be efficient. In Colombia and Malaysia, opportunities for competition (both among airlines and between airlines and other transportation modes) are high on protected routes, raising questions about the need for subsidies.
For Spain, fares and frequencies are substantially lower in routes affected by the resident discounts. Overall, the resident discount policy leads to lower fares (for island residents) but this result must be counterbalanced with an important fact; the amount of public resources devoted to the resident discount policy in Spain is higher than the whole PSO program in Europe – that affect to a much higher number of routes. Note also that routes benefited from discounts are relatively dense. Thus, a clear disadvantage of this policy is that it is costly and provides service on routes that are dense and on which competition is feasible. An advantage of the policy is that it does not restrict competition. The results suggest that the cost of the program could be reduced if the objective is to prevent residents of islands from paying higher fares than passengers on routes that (unlike islands) have intermodal competition.
Discussion and Concluding Remarks
We find that policies generally achieve the expected results in terms of ensuring affordable prices and high frequency levels in protected routes in comparison to unprotected routes. In our context, no significant differences between protected and unprotected routes is a relevant result. We could expect that protected routes, particularly if they serve to remote regions, are more vulnerable to being served with high prices and lower frequencies. In fact, policies in some cases could be even overprotecting routes when it comes to prices and frequencies. However, it is not entirely clear whether overprotection may be taken place as airlines in unprotected comparable routes could be engaged in a degree of market power abuse which raises prices and lowers frequency. Future research focused on specific cases studies and the exact nature of protection may expand the analysis.
The good performance of protected routes in terms of prices and frequencies is not exempt of costs: 1) these policies imply usually the use of public resources, 2) they may distort the decision-making of airlines and provide them with weak incentives to be efficient, and 3) they make restrict competition. In this regard, the use of PSOs may be preferable to other policies because any distortion is restricted to the specific routes affected by them and conditions are
well defined in a contract awarded through competitive tendering. In particular, the state-owned firm and resident discount policies may affect a high number of routes and they may involve a high amount of subsidies. Traffic distribution rules do not imply the use of public resources but the whole domestic market is affected by them. Finally, the limited scope of the airport grants program in United States suggest that any potential distortion should be modest for this particular case.
Furthermore, the positive impacts of the ACRA policies examined must be opposed to the fact that they are not always applied on routes that are remote and/or thin. While PSOs has a priori advantages in relation to other ACRA policies, it would be advisable that they were applied to routes where essential air services are not viable on a free-market scenario.
Overall, our analysis has covered a wide diversity of policies used to protect air services in remote regions. A common result is a good performance of protected routes in comparison to unprotected routes in terms of prices and frequencies. However, the outcomes of the analyzed policies could differ in other countries not included in this study depending on the specific implementation of such policy. In this regard, we find sharp differences in the magnitude of the coefficients of the policy variables across countries. This may be explained by the fact that government choices about which routes to protect, the amount of subsidies per passenger, and the determination of the fare and service levels are usually arbitrary.
References
Albalate, D., & Fageda, X. 2016. “High-tech employment and transportation: Evidence from the European regions”, Regional Studies, 50(9), 1564-1578.
Angelopoulos, J., C. Chlomoudis, P. Christofas, and S. Papadimitriou. 2013. “Cost Assessment of Sea and Air Transport PSO Services: The Case of Greece.” International Journal of Maritime, Trade & Economic Issues I (2): 3–40
Arvis, J. F., and B. Sheperd. 2011. “The Air Connectivity Index: Measuring Integration in the Global Transport Network.” Policy Research Working Paper 5722, World Bank, Washington, DC. Baker, D., Merkert, R. and Kamruzzaman, M., 2015. Regional aviation and economic growth:
cointegration and causality analysis in Australia. Journal of Transport Geography, 43, pp.140-150.
Bertrand, M., E. Duflo, and S. Mullainathan. 2004. “How Much Should We Trust Differences-in-Differences Estimates?” Quarterly Journal of Economics 119: 249–75.
Bilotkach, V. 2015. “Are Airports Engines of Economic Development? A Dynamic Panel Data Approach”, Urban Studies 52, 1577-1593.
Bilotkach, V., & Lakew, P.A. 2014. “On sources of market power in the airline industry: Panel data evidence from the US airports”, Transportation Research-A, 59 1, 288 – 305.
Bilotkach, V., Fageda, X. & Flores-Fillol, R. 2010. “Scheduled service versus personal transportation: The role of distance”, Regional Science and Urban Economics, 40, 60-72. Brueckner, J.K. 2003. “Airline traffic and urban economic development”, Urban Studies 40,
1455-1469.
Brueckner, J.K, & Luo. D. 2013. “Measuring Firm Strategic Interaction in Product-Quality Choices: The Case of Airline Flight Frequency”, Economics of Transportation, 24, 95-108.
Button, K., Doh, S. & Yuan, J. 2010. The role of small airports in economic development. Airport Management 4 (2): 125-136.
Calzada, J., and X. Fageda. 2012. “Public Services Obligations in the Airline Market: Lessons from Spain.” Review of Industrial Organization 40 (4): 291–312.
———. 2014. “Competition and Public Service Obligations in European Aviation Markets.” Transportation Research-A 70: 104–16.
Di Francesco, A., and R. Pagliari. 2012. "The potential impact of removing public service obligation regulations on air fares between the Italian Mainland and the island of Sardinia." Journal of Transport Geography 24: 332-339.
Fageda, X., J. L. Jiménez, and C. Díaz. 2012. “Fare Differences between Domestic and International Air Markets on Routes from Gran Canaria.” Journal of Air Transport Management 25: 8–10. Fageda, X., Suárez-Alemán, A., Serebrisky, T., Fioravanti, R. (2018). Air connectivity in remote
regions: A comprehensive review of existing transport policies worldwide. Journal of Air Transport Management, 66, 65-75
Green, R. 2007. Airports and economic development. Real Estate Economics 35:91-112.
Goldsbee, A., Syverson, C. 2008. “How do incumbents respond to the threat of entry? Evidence from the major airlines”, The Quarterly Journal of Economics, 1234, 1611-1633.
Grubesic, T. H., and T. C. Matisziw. 2011. “A Spatial Analysis of Air Transport Access and the Essential Air Service Program in the US.” Journal of Transport Geography 19: 93–105. Hummels, D., 2007. Transportation costs and international trade in the second era of
globalization. Journal of Economic Perspectives, 21(3), pp.131-154.
ICAO (International Civil Aviation Organization). 2005. A Study of an Essential Service and Tourism Development Route Scheme. Montreal, Canada.
Indian Civil Aviation. 2016. Draft Regional Connectivity Scheme. RCS or the Scheme. New Delhi. Lian, J .I., and J. Rønnevik. 2011. “Airport Competition: Regional Airports Losing Ground to Main
Airports.” Journal of Transport Geography 19: 85–92.
Merkert, R., and D. A. Hensher. 2013. “The Importance of Completeness and Clarity in Air Transport Contracts in Remote Regions in Europe and Australia.” Transportation Journal 52 (3): 365–90.
Merkert, R., and G. Williams. 2013. "Determinants of European PSO airline efficiency–Evidence from a semi-parametric approach." Journal of Air Transport Management 29: 11-16.
Metrass-Mendes, A., and R. de Neufville. 2010. “Air Transport Policy for Small Communities: Lessons from the U.S. Experience.” Proceedings of the 14th Air Transport Research Society Conference, Oporto, Portugal.
Metrass-Mendes, A., R. de Neufville, and A. Costa. 2011. “Air Accessibility in Northern Canada: Prospects and Lessons for Remoter Communities.” Proceedings of the European Regional Science Association. Newquay, UK.
Nolan, J., Ritchie, P., & Rowcroft, J. 2005. “Small market air service and regional policy”, Journal of Transport Economics and Policy, 39, 363-378.
O’Fee, B. 2003. “Tendering for a PSO Route: The Experience of a New Entrant Airline.” Paper presented at the Third Forum on Air Transport in Remoter Regions, Cork, Ireland.
Oliveira, A.V.M, Huse, C. 2009. “Localized competitive advantage and price reactions to entry: Full-service vs. low-cost airlines in recently liberalized emerging markets”, Transportation Research Part-E 45 2, 307–320.
Özcan, I. C. 2014a. “Economic Contribution of Essential Air Service Flights on Small and Remote Communities.” Journal of Air Transport Management 34: 24–29.
———. 2014b. “A Community Evaluation of Essential Air Services.” Journal of Air Transport Management 36: 110–19
Pai, V. 2010. “On the factors that affect airline flight frequency and aircraft size”, Journal of Air Transport Management, 16, 169-177.
Santana, I. 2009. “Do Public Service Obligations Hamper the Cost Competitiveness of Regional Airlines?” Journal of Air Transport Management 15: 344–49.
Schipper, Y., Rietveld, P., & Nijkamp, P. 2002. “European airline reform: an empirical welfare analysis”, Journal of Transport Economics and Policy, 36, 189-209.
Starkie, D. & Starrs, M. 1984. “Contestability and Sustainability in Regional Airline Markets”, Economic Record, 60, 274 - 283
Smyth, A., G. Christodoulou, N. Dennis, M. Al-Azzawi, and J. Campbell. 2012. “Is Air Transport a Necessity for Social Inclusion and Economic Development?” Journal of Air Transport Management 22: 53–59.
Tam, R. and Hansman, R.J., 2002. Impact of air transportation on regional economic and social connectivity in the United States, American Institute of Aeronautics and Astronautics, 1-11. Valido, J., M. P. Socorro, A. Hernández, and O. Betancor. 2014. “Air Transport Subsidies for
Resident Passengers When Carriers have Market Power.” Transportation Research Part E 70: 388–99.
Venables, A.J., 2017. Incorporating wider economic impacts within cost-benefit appraisal. ITF Roundtable Reports Quantifying the Socio-economic Benefits of Transport, p.109.
Williams, G. 2010. “European Experience with Direct Subsidization of Air Services.” Public Money and Management 25: 155–61.
Williams, G., and R. Pagliari. 2004. “A Comparative Analysis of the Application and Use of public service Obligations in Air Transport within the EU.” Transport Policy 11: 55–66.
Windle, R., & Dresner, M. 1999. “Competitive responses to low cost carrier entry”, Transportation Research Part-E 351, 59-75.
Wittman, M. D. 2014. “Public Funding of Airport Incentives in the United States: The Efficacy of the Small Community Air Service Development Grant program.” Transport Policy 35: 220–28. Wittman, M. D., F. Allroggen, and R. Malina. 2016. “Public Service Obligations for Air Transport
in the United States and Europe: Connectivity Effects and Value for Money.” Transportation Research-A 94: 112–26.
World Bank. 2018. Air transport annual report 2017 (English). World Bank Group Air Transport
Annual Report. Washington, D.C.: World Bank Group.
http://documents.worldbank.org/curated/en/107521524554748507/Air-transport-annual-report-2017.
Tables and figures
Table 1 Countries included in the sample
Policy Countries implementing policy Countries included in study sample
Public service obligations Australia, Chile, European Union, Malaysia, Norway, Peru, United States
France, Greece, Italy, Malaysia, Norway, Portugal, Sweden, United Kingdom, United States
Traffic distribution rules India India
Discounts to residents Ecuador, Portugal, Scotland, Spain Spain State-owned airlines Bolivia, Canada, Colombia,
Ecuador, and Malaysia
Colombia and Malaysia Airport grants Australia, Brazil, European Union,
United States
United States
Table 2 Effects of selected ACRA policies on airline fares
Country
Policy variables Results for policy variables Number observations R2 France OSP_restricted -0.04 3943 0.61 OSP_open 0.67*** Greece OSP_restricted 0.22*** 1601 0.66 Italy OSP_restricted -0.24* 3828 0.51 OSP_open 0.006 Norway OSP_restricted -0.52* 2357 0.48 Portugal OSP_restricted 0.14 1020 0.89 OSP_open 0.33*** United Kingdom OSP_restricted -0.009 4127 0.72 United States OSP_restricted 0.0003 5595 0.77 Airport_grants 0.01
Spain Discounts to residents -0.64*** 9619 0.52
India Traffic distribution rules 0.03 10478 0.57
Malaysia OSP_open & state-owned airline
Table 3 Effects of selected ACRA policies on airline frequencies
Country
Policy variables Results for policy variables Number observations R2 France OSP_restricted 0.04 1830 0.74 OSP_open 0.47 Greece OSP_restricted 0.39** 1138 0.79 Italy OSP_restricted 0.62** 2400 0.55 OSP_open 0.57** Norway OSP_restricted -0.91 1241 0.54 Portugal OSP_restricted -0.18 309 0.81 OSP_open -0.33 Sweden OSP_restricted 0.05 831 0.64 United Kingdom OSP_restricted -0.36 1920 0.70 United States OSP_restricted -0.05 2464 0.69 Airport_grants 0.26**
Spain Discounts to residents -0.60*** 9805 0.48
India Traffic distribution rules
-0.05 4512 0.44
Malaysia OSP_open & state-owned airline
-0.0002 824 0.70
Annex A Results from the Literature on Air Connectivity in Remote Areas (ACRA) Policies
Table A.1 Summary of the results of studies on Air Connectivity in Remote Areas (ACRA) policies
Policy/region Study Main conclusions
Public service obligations (PSOs) in Europe
Williams and Pagliari (2004) PSO designation seems to be arbitrary, benefiting remote regions in Norway and Scotland but also dense routes on islands in France, Italy, and Spain that receive many tourists. Williams (2010) High variation among EU countries in average subsidy per
passenger and route maximum fares.
Merkert and Williams (2013) Airlines perform better in early months of PSO contract than when contract approaches termination.
O’Fee (2003) Lack of competition in European market.
Calzada and Fageda (2012) Fares are lower and frequencies higher on routes regulated by PSO contracts.
Calzada and Fageda (2014) PSOs tend to reduce intensity of competition at route level. Lian and Rønnevik (2011) Residents in remote regions of Norway prefer to drive to a larger
airport than use a secondary airport with a subsidized route. Angelopoulos et al. (2013) Designation of PSO routes and average size of subsidy per
passenger varies widely across Greece. Di Francesco and Pagliari
(2012)
Airfares would be higher and more unstable on routes
connecting Italian mainland and Sardinia if PSOs were eliminated. Essential air services (EAS) in the United States Metrass-Mendes and de Neufville (2010)
Efficiency is higher, thanks to increased competition. Özcan (2014a) EAS do not consider changing conditions in aviation market,
speed of surface transportation (alternative), or distribution of the population.
Grubesic and Matisziw (2011)
High level of redundant coverage within EAS network.
Özcan (2014b) EAS communities sustained their subsidized flights had higher per capita income growth in 1999–2011 than did communities that lost their flights because of noneligibility.
Interregional comparison (PSO–EAS)
Wittmann, Allroggen, and Malina (2016)
Some schemes emphasize network connectivity, while others focus on guaranteeing lifeline services.
Santana (2009) PSOs increased operation costs of European carriers. EAS did not do so in the United States.
Discounts to residents in Spain
Valido et al. (2014) Effects of different discount mechanisms are related to proportion of residents/nonresidents and their willingness to pay.
Calzada and Fageda (2012) Demand is higher on routes that offer discounts, but fares (without the discount) are also higher.
Fageda, Jiménez, and Díaz (2012)
Fares are higher on domestic routes than international routes (island residents enjoy discounts only on domestic routes). State-owned
airlines
ICAO (2005) Competition is distorted, and governments usually have weak control over direction of financial assistance provided. Metrass-Mendes, de
Neufville, and Costa (2011)
Canada’s state-owned airlines are either fully owned by the state or joint ventures with private sector partners
Carrier incentive schemes
Smyth et al. (2012) The Route Development Fund in the United Kingdom significantly increased traffic at airports at which it was implemented. Wittman (2014) About 60–70 percent of grants to U.S. airports achieved their
goals.
Annex B
Table B1. Type and scale of programs in sample countries
Country Instrument
Number of protected
routes Eligible routes
Seats on protected routes as a percent of
total domestic seats
Resources devoted to program (millions of dollars)a Colombia State-owned airline 50 Unprofitable routes throughout the country 4.3 —
France Public service obligations and discounts to residents
32 Routes connecting main cities on the mainland with outermost
territories, Corsica, and small cities on the mainland
6.3 —
Greece Public service obligations
37 Routes connecting main cities on the mainland and Rhodes to small islands and intra-island routes
6.7 33 (2010)
India Traffic
distribution rules
34 All airports in North-East (except Guwahati and Bagdogra); all airports in Jammu and Kashmir except Jammu; and all airports in
Andaman, Nicobar islands, and Lakshadweep
3.4 —
Italy Public service obligations and discounts to residents
20 Routes from main cities on the mainland to the islands 5.7 — Malaysia State-owned airline
27 Routes within the regions of Sabah and Sarawak (Borneo)
Norway Public service obligations
43 Routes from main cities and nearby urban centers to isolated regions
4.6 82 (2010)
Portugal Public service obligations and discounts to residents
12 Routes from main cities on the mainland to islands and intra-island routes 7.3 68 (2010) Spain Discounts to residents 69 Domestic links to Spain’s islands 22.0 265 (2015) Sweden Public service
obligations 8 Routes from Stockholm to isolated regions 0.9 9 (2010) United Kingdom Public service obligations
20 Routes from nearby urban centers to isolated regions
0.5 6 (2010)
United States Public service obligations
129 Routes from hub airports to small towns on the mainland
0.2 250 (2015)
United States Small Community Air Service Development Program
37 Small hubs or non-hub airports
- 5 (2015)
Note:
a. Figures do not include resources spent on discounts to residents not embedded in public service obligations.
23
Table B2 Characteristics of protected routes and communities, by country
Country Mean distance (kilometers) Mean population of smaller link (thousands of inhabitants) Number of routes with islands as endpoints Traffic [ number of passengers Percent nonstop traffic Flight frequency [number of flights] Fare per kilometer (US dollars) Percent routes with free entry Hirshman-Herdindahl Index Colombia 389 95 1 7,505 79 363 — 100 0.99 France 547 64 17 28,156 97 690 0.27 15 0.93 Greece 258 22 35 3,536 93 221 0.21 0 0.93 India 979 358 8 29,580 92 374 0.04 100 0.70 Italy 511 76 16 67,600 94 587 0.12 25 0.95 Malaysia 353 135 0 33,548 91 921 0.15 100 0.91 Norway 183 6 1 11,305 91 724 0.58 0 0.99 Portugal 444 18 12 18,372 85 401 0.16 33 0.96 Spain 1,317 182 69 38,812 88 226 0.07 100 0.61 Sweden 457 5 0 7,188 99 259 — 25 0.97 United Kingdom 130 5 17 8,200 99 388 0.14 0 0.98 United States (EAS) 380 31 0 7,716 71 620 0.29 0 0.97