UNIVERSITÀ POLITECNICA DELLE MARCHE
PhD course in LIFE AND ENVIRONMENTAL SCIENCES
Curriculum MARINE BIOLOGY AND ECOLOGY
INVESTIGATION OF ACCLIMATION POTENTIAL OF ALGAL
CELLS
PhD Candidate PhD supervisor
Andrea Pessina Mario Giordano
XXX CICLO 2014-2017
i
TABLE OF CONTENT
1. SUMMARY……… 1
2. INTRODUCTION……….………2
2.1 Effects of perturbations on cell composition……….2
2.2 ATP production………...3
2.3 Origin of the energy required for acclimation of algal cells to environmental stimuli………10
3. MATERIALS AND METHODS………11
3.1 Experimental organisms……….11
3.2 Culture conditions………..12
3.3 Determination of cell number, growth rate and cell size………16
3.4 Cells dry weight and ash weight………16
3.5 Ananlysis of organic composition by Fourier-transformed infrared (FTIR)……….17
3.6 Chlorophyll a/b……….20
3.7 Protein determination……….21
3.8 Elemental composition………21
3.9 Chlorophyll fluorescence: maximum PSII quantum yield (Fv/Fm)……….23
3.10 RNA extraction, cDNA syntesis and real-time PCR……….. 24
3.11 ATP measurement………..27
3.12 Statistics ………28
4. RESULTS………..29
4.1 Impact of O2 concentration on the acclimation potential of C. reinhardtii to S starvation…….29
4.2 Impact of temperature variation on C. reinhardtii and D. tertiolecta cell composition in aerobic condition………32
4.2.1 ATP measurement………32
4.2.2 Cell number, cell volume……….32
4.2.3 Cell dry weight and ash weight………34
4.2.4 Chlorophyll fluorescence: maximum quantum yield (Fv/Fm).………..34
4.2.5 Chlorophyll a/b ………. 35
4.2.6 Protein content………..37
4.2.7 Organic composition determined by Fourier-transformed infrared (FTIR) Spectroscopy.38 4.2.8 Elemental cell quotas……….40
4.3 Impact of temperature variation on C. reinhardtii and D. tertiolecta cell composition in aerobic condition ………..46
4.3.1 Acclimation to Anaerobic condition……….46
4.3.2 ATP measurement………47
4.3.3 Cells number, cell volume………..48
ii
4.3.5 Maximum PSII quantum yield (Fv/Fm) ………..50 4.3.6 Chlorophyll a/b…………..………51 4.3.7 Protein content………..52 4.3.8 Organic composition determined by Fourier-transformed infrared (FTIR) Spectroscopy.53 4.3.9 Elemental composition……….55
5. DISCUSSION………..61 5.1 Impact of extracellular O2 concentration on acclimation possibility after S-starvation
in C. reinhardtii……….61 5.2 Impact of energy availability on acclimation potential in two green algae: C. reinhardtii
and D. tertiolecta……….62 6. CONCLUSION………64 7. REFERENCES.………65 8. INDEX OF FIGURES………74 9. INDEX OF TABLES………..80
1
1. SUMMARY
The project I have conducted intended to investigate the energetic requirements of acclimation and whether the cost of acclimation, understood as energy consumed, when the culture medium contains acetate (as in this case) is impinged mainly on photosynthesis or oxidative metabolism. Cell energy, as ATP and/or reducing power, is transformed in the mitochondria and/or in the chloroplasts. The energy production from chloroplast or mitochondria may depend on environmental conditions. For instance, the production of energy in the chloroplast will be affected by the availability of light (below saturating irradiance) and on the demand for electrons by the various competing sink of energy (e.g. assimilation of C, N, S, responses to stressogenic conditions). The mitochondrial energy depends on the availability of substrate for oxidative metabolism (it should not be forgotten that also chloroplasts are capable of substantial oxidative metabolism) and, in extreme cases, on the availability of O2. It is unclear to what extent a deficiency in the energetic metabolism in one of the two organelles can be compensated by the energy produced by the other.
In order to address these questions and test the hypothesis that acclimation can only occur when sufficient energy is available, I set up experiments in which algal cells were subject to an environmental perturbation. The acclimation to that perturbation (increased of growth temperature or S-starvation) was then studied in conditions of different energy availability, manipulating the capacity of both photosynthetic and oxidative metabolism.
My results showed that energy availability is a necessary precondition for acclimation and the energy availability determined either the direction of the change, and/or the acclimation timing, and/or the possibility to maintain the modifications at long-term. However, the effects of energy availability on biological response are correlated with the type of perturbation: i) The energy provided by the mitochondria seems essential for the long-term acclimation of C. reinhardtii to the S-starvation; ii) The biological response to temperature perturbation seem strictly species-specific. The variation of certain cell components (protein in C. reinhardtii; lipid for D. tertiolecta) appears crucial for the acclimation of algae since it occurs regardless of the external concentration of O2 and of the irradiance in the culture regime.
2
2. INTRODUCTION
2.1 Effects of perturbations on cell composition
Aquatic environments are dynamic and heterogeneous systems, in which abiotic variables such as light, temperature and nutrient availability interact with the biome. Light intensity, surface water temperature and other abiotic variables may have periodic, seasonal or daily (and in some case even shorter) variations, which, as Behrenfeld et al. (2008) reported, may also co-occur. Light, temperature and nutrient availability are certainly among the most important variables regulating productivity and growth of phytoplankton; for this reason, fluctuations of one of these variables can produce large effects in photosynthetic rate, in growth rate and in cell metabolism (Spilling et al. 2015).
Fluctuation of abiotic factors can be short or long - term. The perception of the duration of such environmental perturbations, at least in the range of hours to days, may depend on the growth rate of the organisms that experience them (Giordano 2013). After a perturbation, organisms can choose between two possible modes of response: the maintenance of the status quo, i.e. homeostasis (Giordano 2013), or a response enacted through rapid modification of the extant proteome (regulation), the change of the expressed proteome (acclimation) or of the genome (adaptation) (Raven and Geider 2003). Regulation, which does not require the synthesis of new protein, may occur in seconds to minutes (Woods and Wilson 2013). An example of this phenomenon is the enzymatic epoxydation-deepoxydation of xanthophylls in the thylakoidal xanthophyll cycles (Raven 2011). Acclimation, instead, consists of changes of quality and/or quantity of the proteome through the synthesis of new protein (and/or the degradation of existing ones). This change is possibly more demanding in terms of energy and requires more time (hours) to be completed, because the synthesis and accumulation of new protein is needed.
Finally, adaptation occurs when the genome is modified. Gene mutations are essentially instantaneous, but the time needed for the mutation to become a trait of a population can require numerous division cycles, depending on the growth rate and the frequency of the mutation (Raven and Geider 2003). Literally, the word "homeostasis" means the absolute absence of changes (Giordano 2013), for a cell, the homeostasis can be described as the opposition to intracellular changes despite strong perturbations in external environmental (Montechiaro et al. 2016); it is a rather elusive concept since absolute homeostasis is rarely observed. More typically, homoeostasis is maintained only for certain traits, whereas others undergo modifications (Giordano 2013). If the new condition persists for a time that is appreciably longer than the rate of reproduction, acclimation is almost unavoidable. In terms of interspecific competition, homeostasis may bring a competitive advantage when the duration of the perturbation is shorter than the time required for reproduction: under these circumstances, investing energy and material resources for acclimation would not be justified by the gain of a reproductive advantage (De La Rocha and Passow 2004). These concepts were experimentally addressed by Fanesi et al. (2013) who showed that, for a given perturbation, cells of the same species had a greater tendency to acclimate if their growth rate was faster, whereas slower growing cells were more prone to homeostasis.
3
If a cell responds to a perturbation by modifying its proteome and metabolome, it needs to have access to both nutrients and energy. Therefore, it may be hypothesized that acclimation is possible only when sufficient resources are available. It is unclear whether acclimation is only initiated when sufficient resources are available or if partial or incomplete acclimation responses are possible when there is a shortage of energy. Depending on the type of changes needed for acclimation, the energy may be supplied as 5’-adenosine triphosphate (ATP), as reducing power, or as both, in different ratios (Raven 1982).
2.2 ATP production
Acclimation usually produces modifications in the organic composition of cells and/or related functions, which require energy to be carried out. Raven (1982), published a list of common cellular functions and of their energy costs (Table 1.1).
Table 2.1: List of common cellular functions and of their energy costs (Raven 1982).
Cellular functions Cost
1 ATP generation from ADP and Pi, in vivo condition 55 kJ ·mol-1 (3 ATP + 2 NADPH) 2 NAD(P)+ reduction using equivalents from water 220 kJ·mol-1
3
CO2 fixation by the photosynthetic carbon reduction Cycle; product at redox level of
carbohydrate
605 kJ ·mol-1 4 CO2 accumulation by unicellular algal cell 55 kJ ·mol-1 5 The synthesis of 1 mol organic C from CO2 896 kJ ·mol-1 6 The synthesis of cell wall polyhexoses from CO2 669 kJ ·mol C in wall
polysaccharide
7 The synthesis of cell wall peptidoglycan from CO2 838 kJ ·mol C in peptidoglycan 8 The synthesis of cell wall lipid from CO2 946 kJ ·mol C in tripalmitin (5.84
ATP + 2.84 NADPH)
9 Protein synthesis from CO2 63 kJ ·mol C in protein (4.98 ATP +
2.77 NADPH)
It is possible to observe that the synthesis of new lipid (946 kJ ·mol C), protein (883 kJ ·mol C) and carbohydrate (605 kJ ·mol C) are among the most expensive activities for the cell.
In photosynthetic organisms, the two main processes for the production of energy are photosynthesis, which takes place in the chloroplast and aerobic (respiration) or anaerobic (fermentation) oxidative metabolisms, which take place in mitochondria and in the cytosol.
The interaction between the processes occurring in chloroplast and mitochondria have long been known (Krömer 1995, Hoefnagel et al. 1998) and more recently it has been shown how much these interactions are crucial also for fundamental processes such as photosynthesis: Bailleul et al. 2015 have demonstrated that in diatoms the CO2 fixation is limited by ATP availability, so that mitochondrial respiration becomes extremely important to adjust the ATP: NADPH ratio which support growth rate and carbon fixation. These considerations are true to diatoms used by Bailleul et al. 2015; other possibilities are discussed in the next paragraph.
4
During oxygenic photosynthesis, the two photosystems (PSI and PSII) work in series through linear electron flow, which generates the proton gradient that is then utilized by ATP synthase for the production of ATP (Mitchell 1966, Boyer 1975). Moreover, a cyclic electron transport, primarily around PSI, can be used to increase ATP production (Allen 2002, Cardol et al. 2009). The ratio between ATP and reducing power for the biosynthetic needs of the cells is constrained by a number of environmental (e.g. nutrient chemical form and availability) and intrinsic (e.g. reproduction) factors. Thus, the ratio of generation of ATP and reducing power can be modulated depending on the situation (e.g. Noctor and Foyer 1998 and reference thereinThe water water cycle (WWC), also called the Mehler reaction, can be used as well to regulate the ATP: NADPH ratio. In WWC the electrons from PSI are transferred from Fd to reduce oxygen and a superoxide is formed. The superoxide is catalyzed by superoxide dismutase and ascorbate peroxidase, consuming NADPH. The consumption of NADPH allows linear electron flow to continue, and thus produce new ATP (Asada 1999). WWC contributes also to reduces PSII photoinhibitory stress (Behrenfeld et al. 2008).
The interaction between chloroplast and mitochondrion can be influenced by external conditions. For instance, low irradiance can negatively affect photosynthesis (i.e. carbon fixation) and the production of ATP and reduce power in the chloroplast (Behrenfeld et al. 2008). Under these circumstances, mitochondrial oxidative phosphorylation can supply energy for plastidial processes. Acclimation to low irradiance often requires an increase in cellular pigment content, chloroplast membrane surface and thylakoid stacking (Falkowski et al. 1985). To promote ATP production and a high ATP :NAD(P)H ratio the electron flow between PSII and PSI can be decoupled; the WWC can be used to increase the transmembrane proton gradient necessary for ATP synthesis by water splitting at PSII. In this condition is generated a cyclic electron flow around PSI and so are developed two distinct pathways (i.e. WWC around PSII and cyclic electron flow around PSI) each supporting ATP production (Behrenfeld et al. 2008). Instead, when a light is saturating and the photosynthetic membranes are overstimulated and electron transport is limited downstream of PSII, it may be necessary to dissipate the excess of reducing power to avoid photoinhibition (Ohad et al. 2000, Andersson and Aro 2001). In both of these cases (low light or excess of reducing power) mitochondrial respiration can play important roles: it can elevate the intracellular level of CO2 (Saradadevi and Raghavendra 1992); it can provide extra energy to facilitate the fast turnover of D1 protein (Saradadevi and Raghavendra 1992, Andersson and Aro 2001); it can regulate the cell redox state and it can prevent the over-reduction of electron transport chain in the chloroplast (Saradadevi and Raghavendra 1992). The latter process is particularly important when photorespiration is restricted because of either metabolic control or mutations (Raghavendra and Padmasree 2003, Scheibe 2004). The chloroplasts can export excess reducing equivalents to be either stored (e.g. as malate) or to be oxidized by respiration (Scheibe, 2004). Various ways exist for the export of NA(D)PH/NAD(P)+ across membranes; they are mostly based on metabolic shuttles that operate through the reversible reduction/oxidation of organic substrates. Four main shuttles are known; the glyoxylate-glycolate shuttle; the malate/oxaloacetate shuttle (Heber 1974), the oxoglutarate/glutamate shuttle (Lea and Miflin 1975) and triose phosphate/sucrose shuttle (Raghavendra and Padmasree 2003). The ‘‘oxaloacetate-malate shuttle’’ (OAA-malate) and the ‘‘dihydroxyacetone phosphate-phosphoglyceric acid shuttle’’(DHAP-PGA) are the two more important shuttle systems to connect chloroplastic, cytosolic, and mitochondrial reductant pools. In the malate valve (Scheibe 2004) NADPH is consumed in the chloroplast to reduce OAA to malate. The malate is transported across the chloroplast membrane in the cytosol where it is converted in OAA, which is
5
exchanged with a new malate molecule and then it can return in the chloroplast. During this operation NADH is regenerated (Heber 1974 and references therein). During DHAP-PGA shuttle, PGA is reduced to GAP-DHAP by NADPH through an ATP-dependent intermediate step which involved glycerate-1, 3-bisphosphate. GAP-DHAP go through the chloroplast membrane and NADH, ATP, and PGA are generate in the cytosol from GAP-DHAP by a reverse sequence (Heineke et al. 1991, Raghavendra et al. 1994). Moreover, the mitochondria can use a modified TCA cycle to export isocitrate to the cytosol, where it is converted to oxoglutarate and transferred to chloroplasts (Padmasree et al. 2002), but no more than 50% of reducing power produced from mitochondria is exported to chloroplast (Krömer 1995).
Figure 1.1: Light-dependent reactions, ATP and NADPH productions. Brown arrows stand for electron (e-) transport along the chloroplast thylakoid membrane (yellow) by molecules of electron transport chain. Red arrows stand for protons (H+) movements; the H+ ions translocation from chloroplast stroma into chloroplast lumen produce a proton gradient which is dissipated from ATP synthase during ATP synthesis. The implied 3H+ :e- ratio is for non cyclic electron transport. The abbreviations as in thext mean: H2O = water, O2 = Oxygen, OEC = oxygen evolving complex, PSII = photosystem II, P680 = pigment 680, primary donor of PSII, PQ / PQH2 = “ Q cycles”, ubiquinone (PQ) /ubiquinol (QH2), Cytb6 - Cytf =
cytochrome complex b6-f, Cytc6 = cytochrome c6 can work in substitution of PC (Gupta et al. 2002), PC
= plastocyanin, PSI = photosystem I, P700= pigment 700, primary donor of PSI, Fd = ferredoxin, FNR = ferredoxin-NADP+-oxidoreductase, NADP+/H = nicotinamide adenine dinucleotide phosphate, CF0 = “coupling factor 0”, intrinsic domain, CF1 = “coupling factor 1”, water-soluble membrane-extrinsic domain, ADP = adenosine diphosphate, Pi = inorganic phophate, ATP = adenosine triphosphate. Redraw from Allen 2002.
6
Figure 1.2: Photosynthetic and electron transport pathways. NADPH can be processed in different metabolic pathways: first of all, through nitrogen reduction, glutamate (glu) synthesis (GS) and glutamine:2-oxyoglutarate aminotransferase (GOGAT) via the GS-GOGAT cycle in the chloroplast; secondly through glyceraldehyde 3-phosphate (GAP), exported from plastid to cytosol and, finally, into mitochondria, where it can be processed through oxidative phosphorylation, in order to produce ATP, or one other possible way to process NADPH is through substrate shuttles (Membrane-embedded rectangular with black bar) which link the chloroplast, cytosol, and mitochondria. The two shuttles represented in the picture are the oxaloacetate-malate (OAA-Malate) and the dihydroxyacetone phosphate-phosphoglyceric acid (DHAP-PGA) shuttles. GAP produced by the Calvin-Benson cycle can be used for carbon storage, for producing carbon skeletons needed to amino acid biosynthesis, or mitochondrial ATP synthesis by citric acid cycle. Blue arrows stand for transport across membranes; violet arrows stand for electrons (e-) transport; ETC = electron transport chain; RuBP = ribulose-1,5-bisphosphate; gln = glutamine; PEP = phosphoenolpyruvate; BPGA = glycerate-1, 3-bisphosphate. Redraw from Behrenfeld et al. 2004.
7
The enzymes Glyceraldehyde-3-phosphate dehydrogenase (GAPDH) and triosephosphate isomerase (TPI) play a crucial role during the glycolysis. In animals, both enzymes are cytosolic enzymes, however, in photosynthetic eukaryotes exist also isoforms of GAPDH and TPI in the chloroplast, furthermore, Liaud and colleagues (2000) in diatoms' mitochondria discovered a second isoform of GAPDH and TPI. With this enzyme the Glyceraldehyde 3-phosphate (GAP) can be easily processed in diatoms’ mitochondria to produce ATP (Kim et al. 2016). The mitochondrial metabolism becomes very important in the darkness when it produces 100% of cell energy from stored substrates (Hoefnagel et al. 1998). However, also in the light, with aerobic metabolism (TCA cycles and oxidative phosphorylation), mitochondria have a greater capacity than chloroplast to synthesize ATP, because the chemical conditions in this organelle generate a greater amount of energy from the oxidation of NAD(P)H than in the chloroplast (2.5 ATP equivalents per NADH, Raven and Beardall 2017, versus 1.28-1.5 ATP per NADH in the chloroplast, Kramer and Evans 2011). Furthermore, the molecular structure of mitochondrial ATPase allows it to produce more ATP for each electron moved to the electron transport chain compared to chloroplast ATPase (Allen 2002) (Table 2.2). However, this ATP production in mitochondria is true only if mitochondrial Complex I is present and functioning. In organisms with mutations in complex I and in dinoflagellates, which are lacking this complex, the production of ATP in the mitochondria is reduced of 30% compared to organisms with a functioning complex I (Raven and Beardall 2017). The mitochondrial ATP/ADP translocator operates at faster rates than its chloroplast counterpart (Hoefnagel et al. 1998, Heldt 1969). This is the reason why the cytosolic ATP pool is mainly maintained by mitochondrial oxidative phosphorylation (Krömer 1995).
Table 2.2: Different in ATP production between chloroplast and mitochondria per NADH
Several pathways exist for the conversion of pyruvate to acetyl-CoA in algae (Hemschemeier and Happe 2005; Atteia et al. 2006; Grossman et al. 2007): pyruvate formate lyase (PFL1), pyruvate ferredoxin oxidoreductase (PFR, often referred to as PFOR), and the pyruvate dehydrogenase (PDH) complex. In aerobic condition mitochondria, cells use PDH to convert pyruvate in acetyl-CoA which can be oxidated during the TCA cycle in CO2 (Catalanotti et al. 2013). In hypoxia or anoxia, eukaryotes can continue to produce ATP and consume the NAD(P)H, generated through catabolism, using alternative (to O2) electron acceptors (e.g. NO3−, SO42− or fumarate) and fermentation (Atteia et al. 2013). In anaerobic condition, the pyruvate is typically oxidate to acetyl-CoA by PFL1 and PFR. In Chlamydomonas spp, fermentation can produce ethanol, formate, glycerol and lactate (Mus et al. 2007). In hydEF-1 mutant, during fermentation, it is possible to find succinate (Dubini et al. 2008), while in pfl1 mutant, it can be
Chloroplast Mitochodria
Coupling Factor CF0 F1
Fold rotational
(1 fold rotational = 1 H+ binding sites) 14 12
H+ / ATP 4.67 4
N° of protons extruded in
lumen 6 10
Number of rotation 0.42 0.83
8
observed an increase of lactate (Catalanotti et al. 2012). Instead, in both genes PFL1 and ADH1 mutant, it is possible to find glycerol (Catalanotti et al. 2012).
Fermentation requires the synthesis of specific enzymes, whose genes are expressed only in hypoxic or anoxic condition (Catalanotti et al. 2013): PFL1 catalyzes the conversion of pyruvate to acetyl-CoA and formate, while the reaction catalyzed by PFR oxidizes pyruvate to acetyl-CoA and CO2 and reduces ferredoxin (FDX). The reduced FDX can be used as a substrate for nitrite and sulfate/sulfite reductases (Ghirardi et al. 2008). In Chlamydomonas reinhardtii, FDX is oxidized by the hydrogenase enzyme (HYDA1 and HYDA2), with the production of H2 as secondary metabolite (Happe and Naber 1993, Timmins et al. 2009) (Figure 1.3 A). The acetyl-CoA produced by PFL1 and PFR can be processed through the reaction catalyzed by Alcohol/aldehyde dehydrogenase1 (ADH1), which reduces acetyl-CoA to ethanol (Hemschemeier and Happe, 2005) (Figure 1.3 B). Alternatively, acetyl-CoA can be converted to acetate by sequential action of phosohotransacetylase, PTA or PAT (Atteia et al. 2006) and acetate kinase (ACK or AK) with the transformation of ATP (Atteia et al. 2006) (Figure 1.3 C).
Pyruvate can also be metabolized to ethanol thanks to the cartalysis of pyruvate decarboxylase (PDC3). PDC3 operates a direct decarboxylation of pyruvate to CO2 and acetaldehyde, which is then reduced to ethanol by an acetaldehyde dehydrogenase (ADH1 or ADH2) (Figure 1.3 D).
The two pathways to convert acetyl-CoA to ethanol produce different amount of NADH: 2 NADH molecules per acetyl-CoA are generated in the reaction catalyzed by ADH and only one in the PDC3 pathway (see figure 1.3).
9
Figure 1.3: Fermentation pathways in Chlamydomonas. Formate, acetate and ethanol, CO2 and H2 are the main products obtained in wild-type (WT) Chlamydomonas reinhardtii cells during fermentation. Green circle represents the chloroplast, while red circle represents the mitochondria. The single protein represented in figure means: ACK1 and ACK2 = acetate kinase 1 and 2; ADH1 = alcohol dehydrogenase; FDX = ferredoxin; GK = glycerol kinase; GDP = sn-glycerol-3-phosphate dehydrogenase; HYDA1 and HYDA2 = Hydrogenase 1 and 2; LDH = lactate dehydrogenase; PAT1 and PAT2 = phosphotransacetylase 1 and 2; PDC3 = pyruvate decarboxylase 3; PYK = pyruvate kinase. Redraw from Catalanotti et al. 2013.
10
2.3 Origin of the energy required for acclimation of algal cells to environmental stimuli The activity of the two main processes for energy production in photosynthetic organisms, i.e photosynthesis and oxidative metabolism, can be modulated respectively by irradiance and oxygen concentration (Lehninger 1962, Allen 2002 and reference therein). A low irradiance can decrease the GAP transformation in the chloroplast and, as a consequence, the substrates for both organic pools biosynthesis and mitochondrial metabolism (Behrenfeld et al. 2008), with a possible reduction of oxidative phosphorylation and production of energy. The total oxidation of glucose to CO2 and H2O in the mitochondrion produces about 2870 kJ ·mol-1 (Tran and Unden 1998); 27 mol ATP are produced through the tricarboxylic acid cycle (TCAC) for each mol of glucose oxidized to CO2 (Raven and Beardall 2017); if we assume that the hydrolysis of a phosphodiester bond in ATP yields 55 kJ ·mol-1 (Raven 1982), we can conclude that about 52% of the energy derived from the oxidation of each mole of glucose is stored in form of ATP during mitochondrial respiration. O2 is the final electron acceptor of oxidative phosphorylation (Lehninger 1962 and references therein). Therefore, in anaerobic condition, cells use fermentation to produce ATP. The energetic yield of fermentation is such that the oxidation of one glucose molecule produces up to 5 ATP (Atteia et al. 2013). Davies and colleagues (1993) using mung bean root had estimated that the free-energy released by ATP hydrolysis in anaerobic condition at pH 6.8 is 31.4 kJ ·mol-1 and not 55 kJ ·mol-1 as observed in cytosolic condition at pH7.3 (Raven 1982, Davies et al. 1993). pH, as well as ATP availability, has a big effect on free-energy released by ATP (Davies et al. 1993), and it is possible to observe a decrease of pH during anaerobic condition (Kennedy et al. 1992). Considering an average of 43 kJ ·mol-1 for ATP hydrolysis, it can be calculated that, with fermentation, only around 7% of the energy derived from the oxidation of glucose is stored in ATP, a value significantly lower compared to the energy stored in ATP with aerobic metabolism. Processes such as the assimilation of nitrate into glutamate (2255 kJ ·mol-1), of sulfate into cysteine (1815 kJ ·mol -1) (Giordano and Raven 2014), the fixation of CO2 in triose-P (605 kJ ·mol-1), and the synthesis of lipid from CO2 (946 kJ ·mol C in tripalmitin) (Raven 1982) are some of the most costly biological processes, which account for a major part of the cellular energy demand. Algal cells that respond to environmental perturbation by rearranging their cell composition need energy for acclimation. No energy is virtually required by algae that keep their cellular composition stable despite modifications in the external environment (i.e. homeostasis). Whether the energy required for acclimation originates from an equal contribution of chloroplast and mitochondrion is currently unknown.
In this context the project I have conducted intended to test the hypothesis that acclimation can only occur when sufficient energy is available in cells and whether the cost of acclimation impinges mainly on photosynthesis or oxidative metabolism. Considering the great importance of interaction between mitochondria and chloroplast (Bailleul et al. 2015 and Saradadevi and Raghavendra 1992), it is possible to hypothesize that cells living in anaerobic conditions with a low oxidative metabolism are more prone to be homeostatic than cells living under aerobic conditions. In both aerobiosis and anaerobiosis, cells that grow at a high irradiance (HL) should have more energy available to respond to environmental perturbations compared to cells grown at a low irradiance (LL). To verify the hypothesis I set up experiments in which algal cells were subject to an environmental perturbation, change in O2 availability or growth temperature. If the hypothesis true, more compositional changes are expected in cultures at HL in aerobic conditions, and no or little changes at LL in anaerobic conditions.
11
3. MATERIALS AND METHODS 3.1 Experimental organisms
Chlamydomonas reinhardtii cc-125 and Dunaliella tertiolecta ccap 19/24 were chosen as experimental
organisms.
Chlamydomonas reinhardtii cc-125 was obtained from the Chlamydomonas Resource Center
(University of Minnesota, Minneapolis, USA). Chlamydomonas reinhardtii is a unicellular green alga belonging to the phylum Chlorophyta, class Chlorophyceae, order of Chlamydomonadales, family Chlamydomonadaceae (Guiry, M.D. & Guiry, G.M. 2017. AlgaeBase). C. reinhardtii, are considered as a model organism for the study of photosynthesis and energetic metabolism, for the production of molecular hydrogen (H2) in anaerobic metabolism (Melis and Happe 2001; Catalanotti et al., 2013) and also for the structure, assembly, and function of flagella (Merchant et al. 2007). Chlamydomonas
reinhardtii is a green algae that inhabits freshwater and soil algae (Roberts et al. 1972). Its cell is
surrounded by a cellulosic cell wall, with two anterior flagella and contains multiple mitochondria and a cup-shaped chloroplast that occupies most of the cell volume (Merchant et al. 2007). The nuclear, plastidial and mitochondrial genomes of C. reinhardtii have been sequenced (Merchant et al. 2007, Gonzalez-Ballester et al. 2010) and this information makes C. reinhardtii a robust system for molecular studies (Catalanotti et al2013).
Dunaliella tertiolecta ccap 19/24 was obtained from the Culture Collection of Algae and Protozoa
(Scottish Marine Institute, Scotland, United Kingdom).
Dunaliella tertiolecta belongs to the phylum Chlorophyta, order Chlamydomonadales, family
Dunaliellaceae (Guiry, M.D. & Guiry, G.M. 2017. AlgaeBase). Dunaliella tertiolecta cells are a biflagellate green alga (Ben-Amotz et al. 1987), with a single cup-shaped chloroplast and numerous mitochondria (Ben-Amotz and Avron 1980). Besides, chloroplast and mitochondria, also pigments, Golgi apparatus, eyespot of Dunaliella spp. are similar to Chlamydomonas (Ben-Amotz and Avron 1990). Dunaliella cells are enclosed in a mucous coat (Ben-Amotz and Avron 1990) possibly derived from the glycoprotein cell wall of an ancestral chlamydomonadalean (Buccheim et al. 1996) D. teriolecta, like all its congeneric species, lacks of a proper cell wall. The genus Dunaliellais widely studied and used for biotechnological application mostly, due to its ability to produce a large amount of glycerol and β-carotene (Ben-Amotz and Avron 1990).
Dunaliellaceae are phylogenetically close to Chlamydomonadaceae (Merchant et al. 2007, Leliaert and Lopez-Bautista 2015). For this reason, Dunaliella spp. are good seawater equivalents of Chlamydomonas.
Moreover, BLAST similarity searches showed as unique sequences of D. tertiolecta produced by next-generation DNA pyrosequencing technology were more similarity at Chlamydomonas reinhardtii than at Dunaliella viridis or D. salina (Rismani- Yazdi et al. 2011). Similar results were obtained with phylogenetic analysis performed by Assunção and colleagues (2012); internal transcribed spacers (ITS1+ITS2) of genus Dunaliella showed that D. tertiolecta is closer to C. reinhardtii than other Dunaliella species such as D. salina or D. parva.
12
3.2 Culture conditions
Experimental 1:
Six cultures of C. reinhardtii were grown in Tris-Acetate-Phosphate medium (TAP; Table 3.1) (Harris 1989). On day 0 of the experiment, three cultures were washed and resuspended in fresh TAP medium to free sulfate (-S) (Table 3.1), the other three cultures in TAP medium were used as a control. Cultures grew in batch condition and they were maintained at 100 µmol photons m-2·s-1, under continuous light (PAR = λ = 400-700 nm) in 250-ml Erlenmeyer flasks containing 250 ml of algal suspension. Cultures were at constant temperature, 25°C. The experiment was conducted in aerobic and anaerobic conditions. Samples were collected over time to RNA analysis, from immediately after the application of the perturbation (time 0, T0), to six hours after the start of the perturbation (T6h), with intermediate sampling at 4 days after the start of perturbation (T4h). It has been chosen to use a photo-organo-trophic organism because this experiment wanted to study the genes involved in S-uptake in a condition which did not permit photosynthesis (-S and -O2) and the fermentation was possible only in TAP medium. In an attempt to minimize the variables which could produce biological effects also the control cultures have been grown in TAP medium.
Experimental 2:
In order to investigate the relative contribution of photosynthetic and respiratory energy to acclimation
C. reinhardtii and D. tertiolecta were grown at two different irradiances and in aerobic and anaerobic
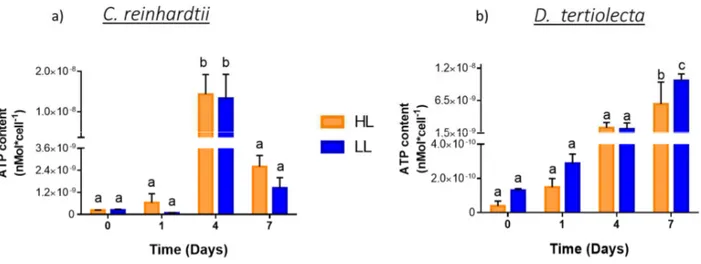
condition. C. reinhardtii grown in Tris-Phosphate minimal medium (TP; Table 3.2); the same medium was used for D. tertiolecta, but with the addition of 0.5 M NaCl, since D. tertiolecta is a marine species (Table 3.2). The irradiances were such that one would saturate growth (High Light – HL) and the other would limit growth (Low Light – LL). Preliminary tests were conducted to choose the photon flux densities for both species (Figure 3.1): for C. reinhardtii, HL was 250 µmol photons·m-2·s-1 and LL was 100 µmol photons·m-2·s-1; for D. tertiolecta, HL was 250 µmol photons·m-2·s-1 and LL was 50 µmol photons·m-2·s-1. Cultures were allowed to acclimate to each photon flux densities for 4 generations before starting the experiments.
In this case, the perturbation consisted in a change of temperature. The initial condition was 15 ° C; when the experiments started, the flasks were moved to 30 °C (start of perturbation).
In all cases, cell composition and cells physiology were monitored over time, from immediately before the application of the perturbation (time 0, T0), to seven days after the start of the perturbation (T7), with intermediate sampling at day 1 (24 hours after the start of perturbation – T1), and day 4 (96 hours after the start of perturbation – T4). Both species were cultured in 250 ml flasks with 200 ml of algal suspension; during the experiment, for each the sampling days, a volume of 100 ml of algal suspension was collected for analysis. In order to maintain the same ratio between gaseous and liquid phase and therefore to ensure the same anaerobiotic conditions through the experiment, cultures were refilled with 100 ml of the new medium after each sampling. The new medium used to refill cultures was preventively balanced with the same gaseous phase of the cultures by bubbling of N2
For both experiments, in aerobic condition algae were cultivated in autoclaved flasks provided with cotton plugs while in anaerobic conditions, the flasks were closed with silicone plugs, in which three tubes were inserted to allow gassing and sampling. The tubes were sealed with “water and gas-proof”
13
silicone (Incofar, Modena, Italy). To induce anaerobic condition, or at least hypoxic conditions hence considered to be anoxic, twenty-four hours prior to experimental manipulation, N2 gas was insufflated directly into the medium through a 0.2 µm gas filter. Preliminary tests with O2 electrode system (Chloroview 2, Hansatech, Kings Lynn, Norfolk, UK) based on a Clark-type O2 electrode, had demonstrated that a flow of 950 ml·min-1 for 40 minutes was enough to saturate the cultures with N2 (2ppm ≤ O2) and remove O2 present in the medium and headspace (Figure 4.17). In order to keep the anaerobic condition during the seven days the experiment lasted at HL and LL, N2 was bubbled each day. For each species/treatment combination, three independent biological replicates were used.
14
Table 3.1: Recipe for TAP (+S TAP) and free sulphate TAP media (-S TAP). Each stock solution was prepared separately and then mixed in the proportions indicated in the table (A). The salts that contain sulphate during the preparation of -S TAP medium were replaced with salts with Cl and they are listed on the left of /. The salts and the solutions were added in the same order they appear in the table. All media were autoclaved at 120° C for 20 minutes at 2 bars (and then cooled to growth temperature), before being used.
(A) Filner’s medium
for 1 L of growth medium +S TAP medium -S TAP medium
4 X Filner’s Beijerinks Solution (mL) 12.5 12.5
Modified Trace Mineral Solution (mL) 5 5
Potassium Phosphate Solution (mL) 1 1
Tris base (g) 2.42 2.42
C2H4O2 (mL)5 Adjust pH with HCl to 7,2 Adjust pH with HCl to 7,2
NaCl (g) 0 27.58
4 X Filner’s Beijerinks Solution Recipe for 1 L solution (+S / -S)
NH4Cl (g) 32 32
CaCl2 (g) 4 4
MgSO4·7H2O (g) / MgCl2 8 6.6
Modified Trace Mineral Solution Recipe for 500 ml solution ( / -S)
Na2EDTA (g) 5 g dissolved by
heating and stirring
5 g dissolved by heating and stirring
NaOH 5N Adjust pH with NaOH to 6.5 Adjust pH with NaOH to 6.5 FeSO4·7H2O (g) / FeCl2·4H2O 0,5 0.357 ZnSO4·7H2O (g) / ZnCl2 2.2 1.04 H3BO3 (g) 1.14 1.14 MnCl2·4H2O (g) 0.51 0.51 CuSO4·5H2O (g) / CuCl2 0.16 0.11 NaMoO4·2H2O (g) 0.073 0.073 CoCl2·6H2O (g) 0.16 0.16 1M Potassium Phosphate
1M KH2PO4 Mix them together
to have a final solution with a 7.2 pH
Mix them together to have a final solution
with a 7.2 pH
15
Table 3.2: Recipe for TP and modified TP media. Each stock solution was prepared separately and then mixed in the proportions indicated in the table (A). The salts and the solutions were added in the same order they appear in the table. All media were autoclaved at 120° C for 20 minutes at 2 bars (and then cooled to growth temperature), before being used.
(B) Filner’s medium
for 1 L of growth medium TP medium Modified TP medium
4 X Filner’s Beijerinks Solution (mL) 12.5 12.5
Modified Trace Mineral Solution (mL) 5 5
Potassium Phosphate Solution (mL) 1 1
Tris base (g) 2.42 2.42
HCl 12M (mL) Adjust pH with HCl to 7.2 Adjust pH with HCl to 7.2
NaCl (g) 0 27.58
4 X Filner’s Beijerinks Solution Recipe for 1 L solution
NH4Cl (g) 32 32
CaCl2 (g) 4 4
MgSO4·7H2O (g) 8 8
Modified Trace Mineral Solution Recipe for 500 ml solution
Na2EDTA (g) 5 g dissolved by
heating and stirring
5 g dissolved by heating and stirring
NaOH 5N Adjust pH with NaOH to 6.5 Adjust pH with NaOH to 6.5 FeSO4·7H2O (g) 0,5 0.5 ZnSO4·7H2O (g) 2.2 2.2 H3BO3 (g) 1.14 1.14 MnCl2·4H2O (g) 0.51 0.51 CuSO4·5H2O (g) 0.16 0.16 NaMoO4·2H2O (g) 0.098 0.098 CoCl2·6H2O (g) 0.16 0.16 1M Potassium Phosphate
1M KH2PO4 Mix them together
to have a final solution with a 7.2 pH
Mix them together to have a final solution
with a 7.2 pH
16
Figure. 3.1: Identification of the photon flux densities that saturates (250) or limits (100 or 50) the growth rate of C. reinhardtii (left) and D. tertiolecta (Right). Different letters indicate statistically different mean values (p < 0.05; 2-ways ANOVA and Fisher’s LSD test).
3.3 Determination of cell number, growth rate, and cell size
Cell number, cell volume and cell size were determined with an automatic cell counter (CASY® TT, Innovatis AG, Reutlingen, Germany). Aliquots of 100 μl of algal cultures were mixed with 10 ml of an electrolyte solution (CASYton, Innovatis AG, Reutlingen, Germany). A small volume of this mix was pumped into a capillary with a 60 μm pore size, at a constant flow. The capillary separates two electrodes, the inner electrode in silver and outer electrode in platinum. The silver electrode is closed in the capillary, while the platinum one is immersed in the electrolyte solution. The two electrodes produce a cyclic low voltage field of 1 MHz; when a cell enters in the measuring pore, it interfere with the electric field and produces a signal. This signal is measured as a cell count. The flow of cell displaces an amount of water equal to the volume of moving cell; thus the duration of the event of increased resistance is used to estimate the cell volume.
For both species, the growth in batch cultures was measured with daily cell counts. - Ln cells number (N) counted in exponential phase was plotted vs time; - The slope of the line obtained was the specific growth rate (μ).
∆N = N0 · eµt From which µ is derived:
µ = ln (Nt / N0) · 1/t 3.4 Cell dry weight and ash weight
The cell dry weight was determined according to Ratti et al. (2011). Fifteen ml of culture were centrifuged (3500 g, 5 min) with a centrifuge (MPW 551e centrifuge, MPW MED INSTRUMENT, Warzlawa, Poland). The pellet was washed once in an 0.5 M ammonium formate solution isosmotic to the culture media for D. tertiolecta and in deionized water for C. reinhardtii, and resuspended in the
17
same media used for washing. The cell suspension was then filtered on pre-combusted glass fibers filter (GF/C, Whatman, Kent, England) under mild vacuum. The filters were pre-combusted in a muffle furnace at 450°C, for 4 hours or until their dry weight was stable and then brought back to room temperature. The filtered samples were left in an oven (T6 Heraeus, ThermoFisher scientific, Waltham, MA, USA), at 80 °C, for 24 hours or until their weight was constant and were then allowed to equilibrate at room temperature. The dry weight was calculated from the difference between the dry weight of the filter with the sample and the weight of the pre-combusted filter. The dry weight of cells was estimated by dividing this number by the number of cells deposited on the filter. The dry cells were then incinerated in a muffle furnace, at 450 °C, for 4 hours (or until their weight was stable) and weighed again to obtain the weight of the ashes, i.e. the weight of what remains after all organic compounds have been fully combusted.
3.5 Ananlysis of organic composition by Fourier-transformed infrared (FTIR)
The organic composition of algae subject to different growth condition was analyzed over time by means of Fourier Transform Infrared (FTIR) spectroscopy, as described by Domenighini and Giordano (2009). For both species, the sample size that gave the highest signal to noise ratio was 4·108 cells. Cells (1.6 ·109) were harvested by centrifugation (3500 g, 5 minutes; MPW 551e centrifuge, MPW MED INSTRUMENT, Warzlawa, Poland), washed three times with either a 0.5 M ammonium formate solution (for D. tertiolecta) or deionized water (for C. reinhardtii). Finally, the cells were resuspended in 0.2 ml of the same solution used for the washes, with a final cell concentration of 8·106 cells·µl-1. Fifty µl of this cell suspension were deposited in the center of a silicon window (Crystran, Ltd, Poole, UK) and heated for 24 hours at 80 °C in an oven (T6 Heraeus , ThermoFisher scientific, Waltham, MA, USA). As a blank, 50 µl of 0.5 M ammonium formate solution were deposited on a silicon window and treated as the samples. The reading from this blank measurement was subtracted from the sample measurements (although the heating of the ammonium formate usually left no residue that could be detected by the spectrometer).
For each of the three biological replicates, three instrumental replicates were done.
FTIR spectroscopy is based on the principle that each molecule that has a dipole moment can absorb IR radiations. The wavelengths that are absorbed depend on the normal (vibrational) modes of the molecule, which are influenced by the strength of the dipoles, by the number of atoms in the functional group and by their geometry (Smith 1998) (Figure 3.2).
18
Figure 3.2: Normal (vibrational) modes of a water molecule. δ+ and δ- are the partial positive or negative charge of element, it is the dipole moment of water. The green arrows are the only possible movements of atoms.
A FTIR spectrometer (Fig. 3.3) is equipped with an infrared source, which emits a broad range IR radiation towards a beam splitter. Fifty percent of the IR radiation is deviated by the beam splitter towards a fixed mirror; the other 50% is directed towards a mobile mirror. The ensemble of the two mirrors and the beam splitter is the “Michelson interferometer”. The two mirrors reflect the IR beams towards the beam splitter, where the reflected beam interact; such interaction can be constructive (the two beams are in phase) or destructive (the beams are in counter-phase). The recombined beam, after crossing the sample, reaches the detector and generates an interferogram (Figure 3.3). The interferogram represents the intensity of the radiation as a function of the displacement of the mobile mirror. Such function is of difficult chemical and biological interpretation because it does not explicitly provide information on the IR frequency absorbed by the sample (frequency is usually expressed as its spatial analogue, the wavenumber, with units of cm-1). This function of the position of the mirror is converted to a function of the wavenumber through a mathematical operation, the Fourier Transform.
19
Figure 3.3: Schematic representation of a FTIR spectrometer and of the path of the IR beam. The fixed mirror, the mobile mirror and the beam splitter constitute the “Michelson interferometer”
The main organic pools (protein, carbohydrate and lipid) have characteristic functional groups that absorb at different wavelengths. The intensity of the absorbance of these functional groups can be used to identify them in whole cells (Domenighini and Giordano, 2009).
In this thesis, FTIR spectra were acquired with a Tensor 27 spectrometer (Bruker Optics GmbH, Ettlingen, Germany) and they were obtained through the software OPUS 6.5 (Bruker Optics GmbH, Ettlingen, Germany). The acquisition parameters are listed in Table 3.2.
Table 3.3: Parameters used for the acquisition of FTIR spectra.
Parameters Value
Spectral resolution 4 cm-1
Number of scans 32
Range of acquisition 4000-400
Apodization function 3-terms Blackman-Harris
Zero-filling factor 2
Pinhole aperture 3 mm
A baseline correction was applied with the "Rubber band" algorithm (64 baseline points): the CO2 and H2O bands were excluded. Regarding the peaks attribution was done according Giordano et al. (2001). The position of the peaks in the absorbance spectrum was identified by application of a second derivative with 9 smoothing points to the spectrum. The peaks with negative value in the second derivative indicate the position of peaks. The peak identified with this procedure was used to constrain
20
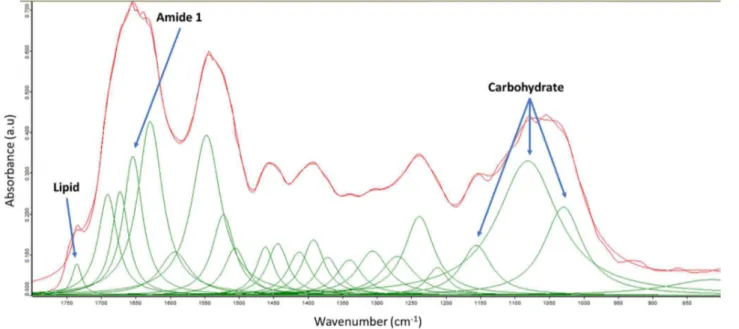
spectra deconvolution. The "Curve fit" function of the software OPUS 6.5 (Bruker Optics GmbH, Ettlingen, Germany) was used for peak deconvolution. The area of the relevant peaks was calculated using the integration routine of OPUS 6.5 (Figure 3.4).
Figure 3.4: An FTIR spectrum (1800–800 cm-1) with peak deconvolution representative of
Chlamydomonas reinhardtii cells grown in aerobic condition at 15 °C.
The peaks that were used for this work were those at: 1650 cm-1 ("amide I", C=O of amides associated with protein), as proxy for protein; 1740 cm-1 (C=O of ester functional groups of triglycerides and phospholipids), used as proxy for lipid; as proxy for carbohydrate the sum of the integrals of the peaks at 1024 cm-1, 1050 cm-1 and 1150 cm-1 (C-O-C of polysaccharides) was used (Giordano et al. 2001). The absorbance of the cell population deposited on a silicon window is influenced by thickness and unevenness of samples. For this reason, absolute quantification is not possible. In this thesis, relative quantification was used. Furthermore, based on the procedure described in Palmucci et al. (2011), semi-quantification of cell pools was conducted using protein as reference. It is worthwhile to stress the fact that this semi-quantification allows for the comparison of the same peak in different conditions, but does not allow to compare peaks at different wavenumbers.
3.6 Chlorophyll a/b
Chlorophyll amount was determined on samples containing from 5x10⁵ to 7x10⁶ cells. Cells were harvested by centrifugation at 3,000 g for either 5 minutes (for C. reinhardtii) or 3 minutes (for D.
tertiolecta) (MPW 551e centrifuge, MPW MED INSTRUMENT, Warzlawa, Poland). The pellet was
resuspended in 1 mL of 90 % (v /v) acetone and remained in 90 % acetone, in the dark and at 4 °C, for 1 hour or until no green pigment was visible. The samples were then centrifuged (3000 g for 5 or 3 minutes) to separate the water soluble phase and the cell fragments (pellet) from the acetone extract (supernatant).
21
Chlorophyll quantification was conducted with a spectrophotometer (Beckman Coulter, Bea, California, USA). Jeffrey and Humphrey (1975) equations were used:
Chl a (μg/ml) = (11.93·A664) - (1.93·A647) Chl b (μg/ml) = (20.36·A647) - (5.5·A664)
Chl TOT (μg/ml) = Chl a + Chl b
Where Chl is Chlorophyll a or b and A is the absorbance at different wavelengths (nm). 3.7 Protein determination
The pellets remaining after chlorophyll extraction were used for protein quantification.
The protein content was determined according to Peterson (1977): the pellet was resuspended in 500 μl of a solution containing 1% SDS and 0.1 M NaOH. The samples were then whirl-mixed for at least 1 minute. Five hundred μl of freshly made "reagent A" were subsequently added. Reagent A contained equal volumes of Milli-Q water, 10% SDS, 0.8 M NaOH and CTC (CTC contained 0.1% CuSO4·5H2O; 0.2% Na-K Tartrate; 10% Na2CO3; w/v). The samples were immediately vortexed and then incubated for 10 minutes at room temperature. Subsequently, 250 μl of freshly made "reagent B", containing 5 parts of Milli-Q water and 1 part of Folin-Ciocalteu (v/v), were added. After whirly-mixing, the samples were left for 30 minutes at room temperature and their absorbance was then measured spectrophotometrically at 750 nm by a Beckman DU 640 spectrophotometer (Beckman Coulter, Bea, California, USA). Milli-Q water was used as a blank. To calculate protein concentration, the absorbance of the samples was interpolated within a standard curve prepared with increasing amounts from 0 to 100 µg of Bovine Serum Albumin (BSA A-8022, SIGMA, St. Louis, MO, USA). The final volume of BSA samples was brought to a volumeof 500 μl with a solution of 0.1 M NaOH. Reagent A and B were subsequently added in the BSA standards, as for the samples.
3.8 Elemental composition
The elemental composition of algal cells in different growth conditions were determined with an elemental analyzer ECS 4010 (Costech International S.p.A., Pioltello, Mi, Italy) for C and N, and with a Total Reflection X-ray Fluorescence (TXRF) spectrometer (Picofox S2, Bruker Nano GmbH, Berlin, Germany) for P, S, Cl, K, Ca, Mn, Fe and Zn.
Cells for the determination of C and N contents were collected by centrifugation at 1,000 g for 10 minutes, with a Biofuge fresco Heraeus (Kendro Laboratory Products, Osterode am Harz, Germany). After centrifugation, the pellets were washed twice with either 0.5 ammonium formate (D. tertiolecta) or deionized water (C. reinhardtii); this was necessary to get rid of the salts in the medium, which would otherwise have introduced an artifact in the weight of the samples (cells). The pellets were then dried in an oven at 80°C for 24 hours, or until the weight was stable. For each sample, 0.07-2.0 mg of dry weight were transferred into tin capsules. The capsules were then carefully closed. The capsules were weighed before and after their closure, in order to make sure that no sample had escaped from the capsules in the closing process. For analysis, empty tin capsules were used as blanks, while sulphanilamide (41,84% C; 16,27% N; 18,62% S; w/w) was used as a standard for the preparation of a
22
calibration curve. Standards were used every time a measurement was conducted to check for the retention time of the different elements; the calibration curve type was set as linear for N and quadratic for C. To facilitate the complete oxidation of samples and standards, a small amount of V2O5 was added. Before each working session, a “leak check” was performed to ensure that no gas leak occurred in the system.
During C and N determination, a carrier gas (He) circulates through an analytic circuit made of a combustion reactor, a gas chromatographic (GS) separation column (Poropak Q/S 0/80 mesh) and a Thermal Conductivity Detector (TDC). With a presetting time, samples, blanks and standards, were one by one dropped into the combustion reactor, contained WO3 as an oxidation catalyst and copper wires as reduction catalyst, where they were combusted at 980 °C in the presence of saturating O2. Samples reacted with O2 and all C is converted to CO2, all N to NOx; the copper wires converted NOx into N2. The gases containing the elements were transported by the carrier gas into a water trap column filled with magnesium perchlorate, where the water generated in the combustion was trapped. Finally the gases entered the GC separation column and determined by the TCD. The EAS 4010 clarity (DataApex Ltd., Prague, Czech Republic) compares the elemental peak to sulphanilamide and generates a report for each element; the abundance of C and N were normalized over the mg of dry matter used for the analysis.
In order to have the best possible signal to noise ratio, for the samples with a weight lower than 1 mg the TCD control panel was set as follows;
Range switch = High (x10) Gain control = 1
Instead, when the sample weight was more than 1 mg the TCD control panel was set as follows: Range switch = Low (x1)
Gain control = 3
The smallest possibleamount of oxygen was used during the combustion of the sample. The amount of O2 injected in the combustion reactor was set on “µ = 5 ml of O2 for sample” for samples with a weight lower than 1 mg, while for the analysis of samples with weight higher than 1 mg the amount of O2 injected was increased and set to “Semi-µ = 10 ml of O2 for sample”.
The flow of He in the system was 100 ml·min-1; the O2 flow into the combustion reactor was 30 ml·min-1.
The following time cycle parameters were adopted:
• Autosampler is activated and the sample dropped into the combustion reactor;
• 12 of sample delay = It is the time for the samples to arrive in the combustion reactor. The samples should arrive almost 2 seconds before O2 flow;
• 20 s of sample stop = it determines the time of sample combustions;
• 40 s of Oxy stop = time waiting for electrovalves from activating of autosampler before starting to refill the instrument of oxygen volume needed for the next samples;
23
For the analysis with TXRF, were prepared as for the C: N analyses. In the end, however, the samples of both species were resuspended, at a concentration of 8·106 cells·ml-1, in 1 mL of Milli-Q water. The analysis was done following the protocol of Fanesi et al. (2013).
To allow an absolute quantification, 5 µl (5 mg·ml-1) of a gallium standard solution (Sigma-Aldrich Co. LLC, Saint Louis, United States) were added to each sample as an internal standard. An aliquot of 10 µL of sample was deposited on a quartz sample carrier (Bruker AXS Microanalysis GmbH, Berlin, Germany) and dehydrated on a hot plate prior to measurement. A Picofox S2 spectrometer (Bruker AXS Microanalysis GmbH) was used to measure the X-ray fluorescence of the various elements. The elements determination was performed with a measurement time of 1000 s. The software SPECTRA5.3 (Bruker AXS Microanalysis GmbH, Berlin, Germany) was used to acquire and analyze the spectra. In order to correct for the natural drift of the detector, which may cause a change in the energy to channel ratio, a recalibration of the energy to channel ratio by gain correction was performed prior to each analysis. One µg of arsenic was positioned on quartz sample carriers used for this purpose. Only the quartz sample carriers that had been previously checked and considered clean were used for the analyses.
The quartz sample carriers were cleaned by washing them with Milli-Q water; then, they were left to sit in water for 5 minutes at 70 °C and then treated for 10 minutes at 70 °C in a solution with the detergent RBS 50X (5% v/v - Sigma-Aldrich Co. LLC, Saint Louis, United States). After this, the sample carriers were washed with Milli-Q water and let sit for 2 hours in a 20% (v/v) solution of nitric acid, at room temperature. Finally, the sample holders were put in an M 1000-VF oven (Instrument Bernareggio, Bernareggio, Mi, Italy) at 60 °C to dry. Before the measurement, each disc was checked with the TXRF spectrometer for 60 seconds, in order to ensure that they were not contaminated; if no element had an abundance higher than the background noise, the quartz sample carriers were used.
3.9 Chlorophyll fluorescence: maximum PSII quantum yield (Fv/Fm)
Photosynthetic efficiency was measured with an AquaPen-C AP-C 100 (Photon Systems Instruments, Brno, Czech Republic). Cells (1·106 cells) for photosynthetic efficiency analysis were collected in a 1.5 ml tube and were kept in the dark for 20 minutes before being analysed. The maximum quantum yield at PSII was measured in dark-adapted cells by providing a blue light (455 nm) to excite chlorophyll. Fv / Fm was calculated according to the following equation:
Fv / Fm = (Fm - F0) / Fm
Where Fm is the maximal fluorescence yield observed in dark-adapted cells after stimulation with a saturating light pulse (3000 µmol photons·m-2·s-1); Measuring Light – a weak measuring light (0.15 mmol photons m-2 s-1) that induces fluorescence but not photosynthesis. F0 is the fluorescence yield
measured in dark-adapted sample when all PSII reaction centers are open and it was measured with a measuring light (0.045 µmol photons·m-2·s-1).
24
Figure 3.5: Analysis of variable fluorescence y saturation pulse method. Upward arrow = light on; downward arrow = light off. White arrows: actinic light; grey arrows: application of a short pulse of saturating light; black arrow: activation of non-actinic measuring light (Schreiber et al. 1986 modified from Büchel and Wilhelm 1993). Fo = fluorescence dark-adapted sample; Fm = maximal fluorescence in dark-adapted sample after application of saturating light pulse; Fv = variable fluorescence; Fm’ = maximum fluorescence yield in illuminated sample; F’ = fluorescence in illuminated sample; F0’= minimal fluorescence yield in non dark-adapted sample.
3.10 RNA extraction, cDNA synthesis and real-time PCR
Total RNA was extracted from a cells suspension of C. reinhardtii containing approximately 4·107 cells, using th e Eurogold TriFast kit (Euroclone SPA, Pero, Italy). The cells pellet was harvested in a 15 ml tube by centrifugation (3500 g, 5 minutes) with a MPW 551e centrifuge (MPW MED INSTRUMENT, Warsaw, Poland). The supernatant was discarded and 1 ml of TriFast lysis solution was added, in order to facilitate the cells lysis; ten mg of 425-600 µm glass beads were also added (Sigma-Aldrich Co. LLC, Saint Louis, USA). The sample was then transferred to a 2 ml tube and it was whirly mixed for 30 seconds; subsequently, the sample was incubated for 5 minutes at room temperature. At the end of the 5 minutes, 0.2 ml of chloroform were added and the solution was energetically mixed by hand for 20 seconds and then incubated at room temperature for 10 minutes. The Eurogold TriFast / chloroform
25
solution was centrifuged at 12000 x g for 20 minutes at 4 °C with a Biofuge fresco Heraeus (Kendro Laboratory Products, Osterode am Harz, Germany). The resulting aqueous phase was transferred to a new 2 ml tube, and 0.5 ml of Isopropanol were added. The aqueous phase/ Isopropanol mix was kept at 4°C for 15 minutes and then centrifuged at 12.000 x g for 10 minutes at 4°C. The supernatant was carefully removed and 1 ml of 75% ethanol was added to the pellet.
The samples was centrifuged again at 7500 g for 8 minutes at 4°. The ethanol was removed with a pipette and the RNA pellet was air-dried, for about 5 minutes. The dry RNA pellet was resuspended in 20-40 µl of RNase-free water and whirly-mixed for 2 seconds. The RNA resuspended in water was immediately put on ice or stored at -80°C for further analyses.
To remove genomic DNA, the extract was treated with RNase-free DNase I (Euroclone SPA, Pero, Italy), as described by the manufacturer. The concentration of RNA extracted was assessed using a nanophotometer (P330 Implen GmbH, Munich, Germany) at a wavelength of 260 nm. RNA integrity was checked by horizontal electrophoresis in a minisub cell GT box (Bio-Rad, Hercules, California, USA). The electrophoretic migration was carried out at 100 volts for 30 minutes in 1 % agarose (Sigma-Aldrich Co. LLC, Saint-Louis, USA) gels (1 g of molecular biology grade agarose in 100 ml of Tris-Acetate-EDTA buffer, TAE). Five µl of EuroSafe (Euroclone SPA, Pero, Italy) in 100 ml of 1% TAE (4.84 g/l TRIS + 0.02% 0,5 M EDTA at 8 pH + 0.1142% of glacial acetic acid in RNA-free Milli-Q water) were used as fluorescent RNA intercalant; a TFX-20 M UV transilluminator (Vilber Lourmat, Marne-la-vallée, France) was used to detect the fluorescence. The samples for the electrophoresis were prepared according to RNA concentration in the samples, one volume with 0.4 ng of total RNA mixed with 0.5 volume of gel loading Solution (Sigma-Aldrich Co. LLC, Saint Louis, Unite State) and RNase-free Milli-Q water was added to make a final volume of 20 µl.
The complementary DNA (cDNA) was synthesized by retrotranscriptase (RT) reaction carried out in a thermocycler. RT was performed by 500 ng of total RNA, 4 µl of 5X PrimerScript Buffer, 1 µl of PrimerScript RT Enzyme Mix I, 1 µl of Oligo dT Primer, 1 µl of Random 6 mers; the final volume was brought to 20 µL with RNase-free Milli-Q water. The PrimeScript kit was manufactured by Takara Holdings Inc. Kyoto, Japan. The PCR conditions were: 37 °C for 15 min, 85 °C for 5 sec. Before running the real-time PCRs, for each gene studied, a PCR was performed with both forward and reverse primers, in order to check the presence of genomic DNA in the cDNA solution. The final amplification was loaded on a 2% agarose gel (2% gel allow having a good separating resolution even for small fragments of DNA) with EuroSafe, and run together with the samples, and a molecular weight ladder (Sigma-Aldrich Co. LLC, Saint Louis, USA). For each gene, two primers were designed to be in two distinct exons adjacent to an intron; they allowed to amplify segments of known length; in addition, through the molecular weight ladder, it was possible to determine the length (molecular weight) of the amplified segments. If the amplification mix contained cDNA and DNA, two bands would appear on the gel after the electrophoretic run: a longer band for the genomic DNA containing both intron and exons in the amplified fragment, one band of lower molecular weight corresponding to the cDNA, which did not contain the intron. If only cDNA was present, only one band would appear. In all runs, no genomic DNA band was observed. Both reverse transcription and PCR were performed with a Biometra T3 Thermocycler (Biometra GmBH, Göttingen, Germany). The primers for gene analysis were specific for
C. reinhardtii; according to Aksoy et al. 2013, CBLP gene (G-protein β-subunit-like protein) was used as
26
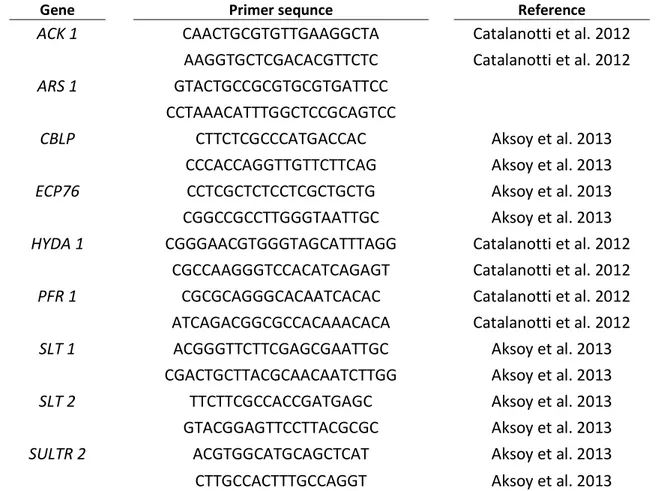
Table 3.4: List of primers used in this work. The primers for the PCR are shown in the 5’- 3’ orientation.
Gene Primer sequnce Reference
ACK 1 CAACTGCGTGTTGAAGGCTA Catalanotti et al. 2012
AAGGTGCTCGACACGTTCTC Catalanotti et al. 2012
ARS 1 GTACTGCCGCGTGCGTGATTCC
CCTAAACATTTGGCTCCGCAGTCC
CBLP CTTCTCGCCCATGACCAC Aksoy et al. 2013
CCCACCAGGTTGTTCTTCAG Aksoy et al. 2013
ECP76 CCTCGCTCTCCTCGCTGCTG Aksoy et al. 2013
CGGCCGCCTTGGGTAATTGC Aksoy et al. 2013
HYDA 1 CGGGAACGTGGGTAGCATTTAGG Catalanotti et al. 2012
CGCCAAGGGTCCACATCAGAGT Catalanotti et al. 2012
PFR 1 CGCGCAGGGCACAATCACAC Catalanotti et al. 2012
ATCAGACGGCGCCACAAACACA Catalanotti et al. 2012
SLT 1 ACGGGTTCTTCGAGCGAATTGC Aksoy et al. 2013
CGACTGCTTACGCAACAATCTTGG Aksoy et al. 2013
SLT 2 TTCTTCGCCACCGATGAGC Aksoy et al. 2013
GTACGGAGTTCCTTACGCGC Aksoy et al. 2013
SULTR 2 ACGTGGCATGCAGCTCAT Aksoy et al. 2013
CTTGCCACTTTGCCAGGT Aksoy et al. 2013
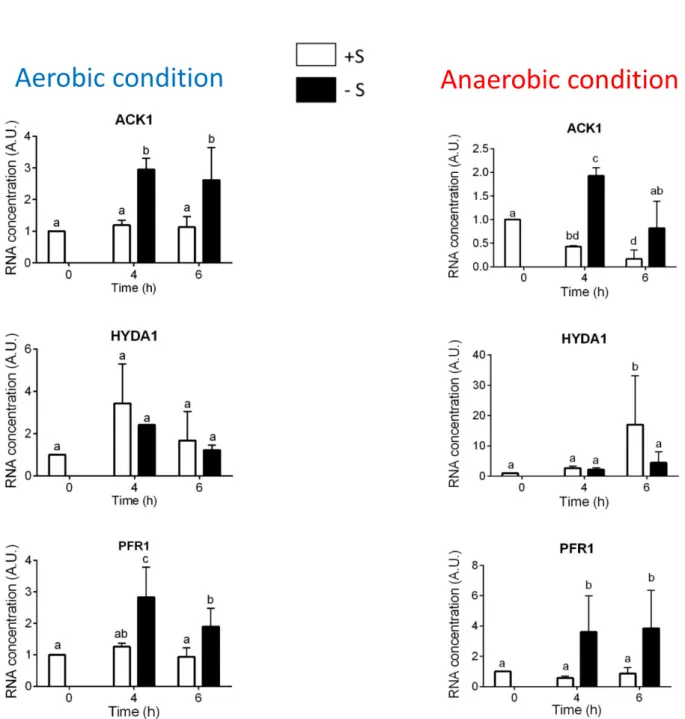
The genes analyzed involved in S metabolism (ARS 1, ECP 76, SLT1, SLT 2 and SULTR 2) or in anaerobic metabolism (ACK, HYDA 1 and PFR 1). Arylsulfatase (ARS1) is a periplasmic protein released in growth medium during S-deprivation condition (de Hostos 1988 and references therein); SLT1, SLT2 and
SULTR2 are high-affinity transporters for sulfate (Yildiz et al. 1994, Pootakham el al. 2010); ECP76 is a
polypeptide that contains almost no S-containing amino acids, ECP76 is used to replace S-rich amino acids of cell wall protein during S-starvation and thus the S of amino acids can be recycled (Takahashi et al. 2001). Regarding the genes involved in anaerobic metabolism refer to the chapter 2.2.
A preliminary real-time PCR was performed for each pair of primers to check annealing temperature and enzymatic efficiency (Ef) in working condition. For all couple of primes, the best annealing temperature turned out to be 60 °C. To test the real-time PCR efficiency, serial dilutions of cDNA, each in duplicate, were amplified using the specific primers for the target genes, only a Efs of 100% ± 10% were accepted. A specific temperature protocol was used for real-time PCR: the preincubation was conducted at 95 °C for 5 min; it was followed by 50 cycles of denaturation at 95° C for 10 s; annealing was allowed to take place at 60 °C for 20 s; elongation occurred at 72 °C for 30 s; one final extension was added at 72 °C for 5 min.
The RT-PCRs were performed with IQ5 real-time PCR (Bio-Rad, Hercules, California, USA). Each sample was prepared in a final volume of 10 µl and was mixed with 5 µl of ITAQ UniverSyber Green master mix