BT.4
Advanced Light Microscopy Techniques
Manel Bosch1, Benjamín Torrejón-Escribano2, Anna Bosch3, and Maria Calvo3
1 Unitat de Microscòpia Confocal, CCiTUB, Universitat de Barcelona. Fac. Biologia, 645. 08028 Barcelona, Spain.
2 Unitat de Biologia (Bellvitge), CCiTUB, Universitat de Barcelona. Feixa Llarga s/n. 08097 L’Hospitalet de Llobregat, Spain.
3 Unitat de Microscòpia Confocal, CCiTUB, Universitat de Barcelona. Fac. Medicina, Casanova, 143. 08036 Barcelona, Spain.
email: [email protected]
Abstract. This article summarizes the basic principles of light microscopy, with
examples of applications in biomedicine that illustrate the capabilities of the technique.
BT.4
1. 1. 1.
1. IntroductionIntroductionIntroduction Introduction
An optical microscope uses lenses and properties of light to magnify and resolve laterally small objects in the sample, with a maximum precision of 200 nm, under conventional conditions.
Due to the useful properties of light microscopy applied to biological samples, it has become a fundamental technique in biomedicine. Biological samples that can be studied are fixed or live, cells, tissues, organs, embrios and small animals. Studies of materials surface or solutions can also be performed.
One of the most important advantages of light microscopy is that the tridimensional structure and integrity of the sample can be very well preserved after its processing for observation. In addition, the almost non-invasive properties of light allow studying living cells, tissues and whole organisms.
By using optical microscopes with different light contrast techniques and a wide range of labellings, the different features of the samples such as morphology, structure and components can be highlighted. From among all light-contrast techniques, fluorescence is probably the most widely used. This is due to its multiple properties and advantages versus other light-contrast techniques. One of the advantages of fluorescence is its specificity. Fluorescent molecules are identified and discriminated from the others by their individual light absorption and fluorescence emission spectra. A particular fluorophore can be detected by using specific excitation light and emission range. This detection can be performed with a high contrast. Fluorescent molecules glow in a dark background and their signals can be isolated easily from the surrounding. Another important advantage is that fluorophores have several physical and chemical properties (lifetime, absorption and emission spectra, intensity, etc.) which are sensitive to environmental conditions (pH, temperature, concentration, molecular interaction, etc.) or can be used to make some processes evident; thus, a wide range of fluorophores are used as specific reporters of particular situations such as environmental conditons, molecular reactions or dynamics.
Recently, the discovery of fluorescent proteins from different organisms and subsequent genetic engineering has made it possible to express, in living cells, the proteins of interest tagged with these genetically encoded fluorescent proteins [1]. Numerous variants of fluorescent proteins have been developed for protein labelling or as reporters of specific conditions. The combination of this development together with the properties of fluorescence has revolutionized the study of localization and function of proteins in its natural environment, the living cell.
As a result, there has been an important development of advanced techniques which provide novel information about how, when and where changes in molecular states, dynamic processes and reactions occur in biological samples. Recently, some techniques have increased the conventional optical resolution up to 10 times [2]. Advanced optical microscopy techniques combine and take advantage of the properties of light, design and improvement of probes, progress in image analysis tools, new imaging techniques and development and commercialization of equipment and software that provide solutions to these new applications.
Light microscopy has become prevailing in biomedical research and, furthermore, the incoming techniques point out to give new insights into cell biology and molecular mechanisms.
This chapter summarizes some light microscopy techniques with examples of applications based on our specialization and experience.
2. 2. 2.
2. Contrast Techniques in Light MicroscopyContrast Techniques in Light MicroscopyContrast Techniques in Light Microscopy Contrast Techniques in Light Microscopy 2.1. Transmitted light contrast techniques
2.1.1. Brightfield microscopy
Brightfield microscopy is the simplest of all optical illumination techniques. It yields an image with the sample appearing black, surrounded by a bright background. This contrast is due to the absorption of light by dense areas of the sample. Most biological samples, however, have a low contrast and, therefore, they have to be observed using other methods. Staining the samples
BT.4 increases this contrast but it is not always possible or convenient, especially in the case of living
cells. There are special optical contrast-enhancing techniques based on changes in the phase of light due to differences in thickness and refractive index between the specimen (phase specimens) and the surrounding medium. These differences are converted in differences in colour or intensity of the image. Some of these contrast-enhancing techniques are: phase contrast or differential interference contrast (DIC).
2.1.2. Phase contrast
Phase contrast enhances the differences in the phase of the light between waves traversing the sample (diffracted) and waves passing through the surrounding medium (undiffracted). When both waves are combined, the resulting interference makes the phase variations observable in the image and, therefore, it is possible to distinguish the structure from the surrounding medium. It is a high-resolution technique and is ideal for fairly thin and uniform specimens, such as monolayers of cells. Some problems, however, may appear with very thick o highly refractile objects.
2.1.3. Differential interference contrast
Differential interference contrast (DIC), also known as Nomarski microscopy, generates contrast from local changes in refractive index of the specimen. The resulting images give the appearance of a three-dimensional physical relief, though not providing a topographically accurate image. DIC does not give much contrast when working with a thin object but it is the technique of choice for thick samples such as protozoa, embryos and small organisms.
2.2. Fluorescence as a contrast technique
Fluorescence microscopy has become an essential tool in biology and in the biomedical sciences, as well as in materials science due to its attributes that are not readily available in other contrast modes within traditional optical microscopy. It gives the possibility to label individual structures, molecules, or cell compartments, so that their observation under the microscope, and even the dynamics of the living cells, is possible. Moreover, it is possible to use several fluorescence probes at the same time to identify several target molecules simultaneously. Although the fluorescence microscope cannot provide spatial resolution below the diffraction limit of specific specimen features, the detection of fluorescing molecules below such limits is readily achieved. There are many fluorescent microscopes that provide different imaging solutions achieved by the variations in the different components of the microscope.
2.2.1. Fluorescence process
When specimens, living or non-living, organic or inorganic, absorb and subsequently re-radiate light, the process is described as photoluminescence. If the emission of light persists only during the absorption of the excitation light, the phenomenon is known as fluorescence. Fluorescence is the light emitted during the rapid relaxation of fluorescent molecules following excitation by light absortion.
The process consists of three phases (Fig. 1a). Briefly, in the first phase (absorption) a photon collides with a molecule that absorbs it. This process excites and promotes the atomic electrons of the molecule to a higher-energy level. In a second phase (relaxation), the excited electrons undergo a transition to the lowest excited state, losing energy as heat. Finally, in the third phase (emission), the electrons drop back to the ground state via a number of processes. One of these processes is the emission of light. As a consequence of this process, the energy of emitted light is lower than that of the absorbed light and, therefore, the wavelength of the emitted light is longer than that of the absorbed radiation. Because the emitted photon usually carries less energy and therefore has a longer wavelength than that of the excitation photon, the emitted fluorescence can be distinguished from the excitation light.
BT.4
Figure 1. a) Jablonski energy diagram of fluorescence (adapted from Ref. [3]); b) Different ways of staining a target molecule with a fluorochrome. GFP means green fluorescent protein, A antigen,
P protein of interest, F fluorochrome, S streptavidin and B is biotin.
The excitation and photon emission from a fluorophore is cyclical, and until the fluorophore is irreversibly damaged (or photobleached), it can be repeatedly excited. Because of the fact that fluorophores can emit numerous photons through the cycle of excitation and emission, fluorescent molecules are used for a broad range of research applications. Both the excitation and emission wavelengths are specific characteristics of each fluorophore and they exhibit broad excitation and emission spectra. The spectra for fluorescent molecules are graphed on x,y plots that indicate the wavelengths which correspond to the maximum and minimum excitation and emission signal intensity for each fluorophore.
2.2.2. Fluorescence labelling of samples
There are two different types of fluorescence used to detect molecules of interest with light microscopy techniques. Primary fluorescence is the property of some substances of emitting fluorescence (autofluorescence). Secondary fluorescence is a fluorescence generated by staining the molecule of interest with a fluorescent molecule (fluorochrome) [1] [4].
There are different options to detect a molecule by fluorescence (see figure 1 and 3). A very common labelling method is immunostaining. It consists of detecting a molecule by an specific antibody directly labelled with fluorescence (direct immunoflurorescence) or using a first antibody against the molecule of interest and, afterwards, one or various secondary antibodies directed to the first one labelled with fluorescence (indirect immunofluorescence). Indirect immunofluorescence is commonly used as an amplification method due to the strong non-covalent interaction between streptavidin and biotin [5]. In this case, a primary antibody biotinilated and avidin complexed with the desired fluorochrome can be used.
Another detection method is the use of fluorescent (non immunological) dyes. These can be fluorescent-labelled molecules that bind specifically to the molecule of interest or locate in an specific compartment due to its physico-chemical properties.
Recently, the discovery of fluorescent proteins from different organisms and subsequent genetic engineering have made it possible to express, in living cells, the proteins of interest tagged with these genetically encoded fluorescent proteins [9] [10]. Numerous variants of fluorescent proteins have been developed for protein labelling or as reporters of specific conditions. This development has opened the field of in vivo microscopy, to follow many processes in situ.
BT.4 2.3. Conventional fluorescence microscopy
Modern fluorescent microscopes universally use incident-light (epi-) illumination, where the excitation light comes through the objective. Objectives are therefore the condenser of the microscope.
Usually fluorescent microscopes use Mercury or Xenon lamps as light source, however, they are being progressively substituted by new metal-halide lamps that offer longer lifetime.
Another major component of a fluorescent microscope is the filter cube. It contains a set of three filters: an excitation filter, a dichroic mirror and a barrier filter. Traditional glass filters, such as excitation and barrier filters, absorb some wavelengths while passing others: longer (long-pass filters), shorter (short-pass filters) or of a specific band of wavelengths (band-pass filters). The dichroic mirror is an interference filter that acts as a chromatic beamsplitter, reflecting short wavelengths and transmitting long ones. In other words, the excitation filter permits only selected wavelengths from the illuminator to pass through on the way toward the specimen. Barrier filters are designed to block (absorb) the excitation wavelengths and permit only selected emission wavelengths to pass toward the eye or other detector. Dichroic mirrors are designed to efficiently reflect excitation wavelengths and pass emission wavelengths. All three filters have to be properly chosen to match the spectral excitation and emission characteristics of the fluorophore used to label the specimen. Multi-color images of multi-fluorophore staining must be composed by combining several single-color images acquired using different filter cubes. For this purpose, these different filter cubes are mounted in a filter wheel that can be turned manually or automatically.
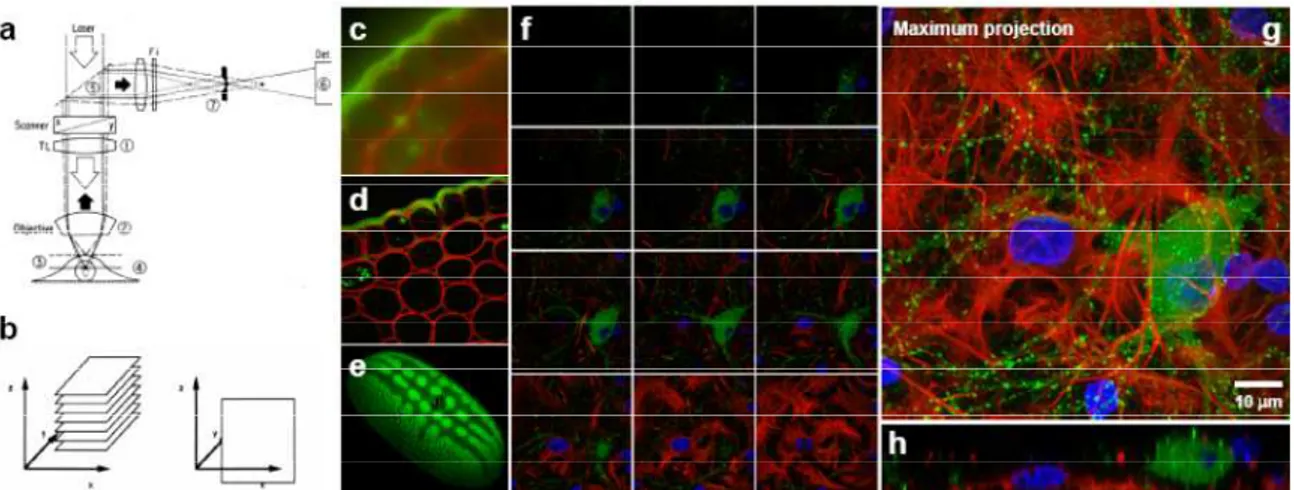
2.4. Confocal laser scanning microscopy
Confocal laser scanning microscope (CLSM) uses a laser light source. Laser passes through a diaphragm (excitation pinhole) and is focused on a small point of the sample and it scans the sample point by point on the focal plane. Fluorescence or reflection light from the focal plane passes through an emission pinhole (rejecting out of focus light), and it is detected by a detector, generating optical sections. Finally, point by point information is compiled in a computer and a final image is composed (see figure 2a).
The main advantages of CLSM are: the ability to control the depth of field, elimination or reduction of background information away from the focal plane, serial production of thin and non-invasive optical sections (maximum axial resolution would be 0.5 micrometers) through fluorescent specimens that have a thickness ranging up to 50 micrometers or more (increasing axial resolution in “Z” dimension), improvement of lateral resolution until 0.2 micrometers or more (X-Y dimensions) and elimination of scatter light thanks to the point-by-point illumination (laser source). The mechanical improvements in confocal microscopy are: a powerful excitation light source (laser beam light versus mercury lamps), pinhole diaphragm, motorized “Z” stage and image detectors (new generation of photomultipliers versus CCD cameras) [2].
Modern CLSM instruments are equipped with 3-5 laser systems controlled by high-speed acousto-optic tunable filters (AOTFs), which allow a very precise regulation of wavelength and excitation intensity. Emission is detected by photomultipliers and some confocal systems can select freely the detection range [2] thus allowing versatile configuration and minimizing spectral crosstalk.
The non-invasive confocal optical sectioning technique enables the examination, with enhanced clarity, of both, living and fixed specimens, under a variety of conditions. With most confocal microscopy acquisition software packages, optical sections are not restricted to the perpendicular lateral (x-y) plane, but can also be collected and displayed in transverse planes (Fig. 2). Most of the software packages for image analysis, accompanying commercial confocal instruments, are capable of generating composite and multi-dimensional views of optical-section data acquired from stacks of optical section (often termed a z-series) (Fig. 2). The three-dimensional software packages can be employed to create either a single three-dimensional representation of the specimen or a video (movie) sequence compiled from different views of the specimen volume [11] [12].
BT.4
Figure 2 a) Depth discrimination in laser-scanning confocal fluorescent microscope. 1-Objective. 2-
Objective lens. 3- Out of focus light emitted from the specimen. 4- In focus light emitted from the specimen. 5- Dicroic mirror. 6- Detector (photomultiplier) and 7- Pinhole diaphragm. Figure adapted from ref. 2. b)
Optical sectioning: Stack of xy slices (left), xz slice (right); Images of Convalaria obtained with widefield fluorescence microscopy (c) and CLSM (d) ; e) 3D reconstruction of a pollen grain
obtained from optical sections (Image courtesy of Albert Lleal, CSIC); f, g an h) Triple fluorescence labelling of a culture of neurons and astrocytes. Green: GFP-Actin; Red: anti Glial
fibrillary acidic protein; Blue: Hoechst; f) xy sections; g) Maximum projection; h) xz sections (Image courtesy of Miguel Morales,CIBIR-Rioja and University of Barcelona).
CLSM is being used in a wide variety of very important and innovative biomedical applications such as: FRET (Fluorescence resonance energy transfer), photobleaching techniques, FISH (fluorescence in situ hybridization), in vivo imaging, ions imaging, 3D and nD digital reconstructions, colocalization of fluorophores, epitope tagging, morphometry and volumetry analisys, high-throughput screening, multicolor acquisition, profilometry, etc [2].
2.5. Nonlinear Microscopy
Nonlinear microscopy is based on the modification of the optical properties of matter by intense light, typically laser light [5] [6]. The nonlinear term refers to the response of matter to an applied optical field (light), which is not directly proportional to the stregth of the applied optical field. This response can result non linear in terms of intensity, as in two photon microscopy, or in the creation of radiation fields that propagate at new frequencies as in second harmonic generation or in new directions.
In contrast, single-photon excitation (conventional fluorescence) is directly proportional to the incident light, since each photon has an equal probability of exciting a molecule in the ground state.
2.5.1. Two-photon microscopy
Two-photon excitation is the process in which fluorescent molecules in the sample absorb two near infrared photons during the same quantum event. The probability of two-photon excitation is proportional to the square of the light intensity applied because it depends on the probability of one photon being there multiplied by the probability of another photon being there. The maximum probability of two-photon absorption is only achieved at the focal plane thus producing intrinsically optical sectioning. In this kind of microscopy, out of focus fluorescence is practically never generated, thus reducing the background from the acquired image and photobleaching and fototoxicity at out of focus planes.
The principal advantages of multiphoton microscopy for the study of biological samples are: optical sectioning, excitation at a single point of the sample in the focal plane, high penetration of the near infrared photons, low phototoxicity and photoextinction at out of focus planes.
The quantum-mechanical selection rules for two-photon excitation are very different from those for single photon excitation and result in very different absorption cross section from those for
BT.4 single photon excitation [7]. The absorption cross sections of fluorophores are very different from
the single photon cross sections and they commonly exhibit a broader two-photon excitation cross section. The emission characteristics of the excited fluorochrome are the same for the different absorption processes (single and two-photon processes).
Two photon microscope consists of a a laser scanning microscope with an ultrafast near infrared laser pumped by a solid-state laser, a high-numerical aperture lens and descanned or non-descanned detectors.
In order to have a high probability of two-photon excitation in the focal plane, a high density of photons is needed. This can be achieved by two factors. First of all, a pulsatile and powerful laser sends short peaks of photons of large intensity at high frequency. Secondly, a high collecting angle of the lens concentrates a big density of photons in the volume of the focal plane.
Detection can be performed by descanned and non-descanned detectors. In the descanned detection, pinholes are removed or completely open and the same optical pathway and scanning mirrors are used as in confocal laser scanning microscopy. Non-descanned detectors do not use pinholes, the emision is selected with dichroic mirrors and detected from the whole image without passing back through galvanometric scanning mirrors. One type of non-descanned detectors are those that are external, in which light does not pass back through the objective. These detectors are very efficient and suitable for light scattering samples because they detect the photons from the whole area.
The main applications of two-photon microscopy are: imaging of thick samples: intact tissue, animals (intravital microscopy, see fig. 3a) or tissue sections, live cell analysis during long periods of time due to less phototoxicity and photobleaching at the focal plane, excitation of ultraviolet fluorophores with near infrared laser (see fig. 3b), adaptability to new fluorescent probes (lipid probes), simultaneous excitation of various fluorophores (see fig. 3a), photoactivation, photolabelling, uncaging and photobleaching for molecular dynamic studies in living cells at a known volume, etc.
Figure 3. a) Two photon intravital microscopy of mouse liver. Image of liver of a mouse injected with Hoescht for DNA labelling (blue) and membrane potential sensitive probe TMRM (red) both excited at 800 nm (Figure adapted from ref. [17]). b) Two-photon imaging of an ultraviolet probe (Laurdan) to study lipid order in plasma membrane. General polarization (GP) images, of Laurdan-labeled wt (right) and mhtt (left) cells, were pseudo-colored, with blue to red representing fluid and
ordered domains, respectively (Image courtesy of J. Alberch, University of Barcelona [8]).
2.5.2. Second Harmonic Generation
Non centrosymmetric molecules illuminated with a high-intensity light of a given frequency and wavelength have the capability to generate second harmonic, i. e. light with double frequency and half the wavelength of the fundamental light [5] [6].
BT.4
Second harmonic generation (SHG) is a nonlinear scattering process because its efficiency depends on the square of the incident light intensity. Therefore, second harmonic generation needs a very high intensity light that, in microscopy, it is only achieved at the focal plane by a powerful pulsing laser. As a result, SHG provides intrinsic optical sectioning. Another characteristic is that the generated wave propagates in the same direction as the incident light and in phase with it, although it has a different plane of polarization. As SHG and TPE imaging requirements are very similar, SHG imaging can also be performed, with some modifications, using a two-photon microscope.
Figure 4. Example of second harmonic generation application. Imaging of sarcomere distribution in cardiomyocites of left ventricle of mouse.
The main applications of SHG are the visualization, without staining, of structural proteins such as collagen, myosin and tubulin and the visualization of specific labellings with probes that generate second harmonics.
3. 3. 3.
3. Applications of Light Microscopy in BiomedicineApplications of Light Microscopy in BiomedicineApplications of Light Microscopy in BiomedicineApplications of Light Microscopy in Biomedicine 3.1. Cell tracking
As its name suggests, particle or cell tracking, is the ability to follow the movements of cells or particles in vivo (during a time period), using light microscopy techniques such as transmitted light and fluorescence microscopy or other techniques. The idea is that one can follow tagged particles or cells by means of various detection methods over the time, in two or three dimensions. This kind of analysis can generate big amounts of data and a powerful image analysis is necessary. In order to optimize the process, image analysis automation should be incorporated (see 3.4 section below). Different processes can be analysed, for example: mitosis, apoptosis, cellular shape, direction and velocity of particles, organelles or cells, etc and they have many application in basic and clinical biomedical research.
In the following example, cell tracking with differential interference contrast imaging (DIC) and fluorescence (EGFP) showing that Hsp27 phosphorylation is required for BMP-2 induced cell migration was examined [4]. C2C12 cells were grown on 4-well coverslip-bottom plates, before being placed at 37ºC in a CO2 incubation system. Images (typically 4 Z-stack sections) were
recorded at 5-min intervals for 16 h using a LEICA TCS-SL confocal microscope. Individual cells were traced from the resulting time-lapse movies and analyzed using ImageJ software with manual cell tracking plug-in. Cell migration was analyzed by marking the position of the nucleus in individual cells in each frame to obtain the migration tracks. In this case, only the migration tracks are used for quantification of the total distance between time zero and the final time (Fig. 5). Also the velocity of the cells, directionality of the movement and quantification of mitosis, can be analyzed.
3.2. Fluorescence Resonance Energy Transfer
Fluorescence Resonance Energy Transfer (FRET) is a process where an excited fluorophore (donor) transfers energy to another fluorophore (acceptor). The resonance energy transfer is dependent on the distance, due to the dipole-dipole interaction from the donor and acceptor, and since it is non radiative, there is no photon emision. FRET technique can be used to report molecular associations and biochemical reactions. When it is combined with fluorescence microscopy, the FRET signal can be precisely located at the subcellular level where the process is taking place. This is very important because molecular associations and biochemical reactions
BT.4 depend greatly on subcellular localization and on the differential and specific microenvironment
conditions in that compartment or region.
Figure 5. A) ImageJ analysis of cell tracking (total distance in microns) in presence or absence of BMP-2. B) Quantification of migration tracks. Histogram shows migration tracks obtained from at
least 80 cells in each experimental condition from two independent experiments. Values correspond to the mean ± SEM. (Image courtesy of F. Ventura, University of Barcelona [4]). There are different conditions for energy transfer to occur. First of all, donor and acceptor molecules have to be at a physical distance less than a specific radius- between 1- 10 nm. Secondly, the donor emision spectrum has to overlap with the acceptor absorption spectrum at least 30%. Finally, the orientation dipole transition of donor and acceptor molecules has to be approximately parallel. FRET pairs for fluorescence microscopy are couples of synthetic fluorophores. Each FRET pair is defined by a distance at which the efficiency of energy transfer is 50%. This distance is known as the Förster radius (R0).The relation between FRET efficiency (E) and distance is
defined by the equation
E = 1 / [1+(r / R0) 6
],
where r is the distance between donor and acceptor and R0 is the Förster radius. It can be observed
from Fig. 1 that FRET is very sensitive to distance and it decays very abruptly for an small increase of distance between donor and acceptor [14]. FRET has become a good tool to report changes in molecular proximity or biochemical reactions because of its sensitivity to changes in distance and the fact that the Förster radius of most of the FRET pairs are in the range of biomolecules size (1-10 nm).
Inter molecular proximity can be elucidated by measuring FRET between one molecule of interest labelled with donor and the other with acceptor fluorochrome. Intramolecular FRET can also be used as a reporter of biochemical reactions by designing molecules, with donor and acceptor in them, which change distance by changing conformation of aminoacids or proteins sensitive to the process of interest. The latter process reports a biochemical reaction such as phosphorilation, Ca2+ concentration, membrane microdomains.
3.2.1. Intensity-based FRET methods
Different methods exist for calculating FRET. During the energy transfer, a phenomenon of donor quenching (loss of emission signal) corresponding to an increase of acceptor intensity can be observed.
The different quantification FRET methods take advantage of the phenomena that occurr during the process. For example, acceptor photobleaching and sensitized emission are intensity-based methods that take advantage of donor loss of emission signal and of the increase in acceptor signal due to FRET, respectively. For instance, fluorescence lifetime measurement exploits the fact that donor fluorescence lifetime is reduced. Ratiometric methods are optimal for intramolecular FRET experiments.
BT.4
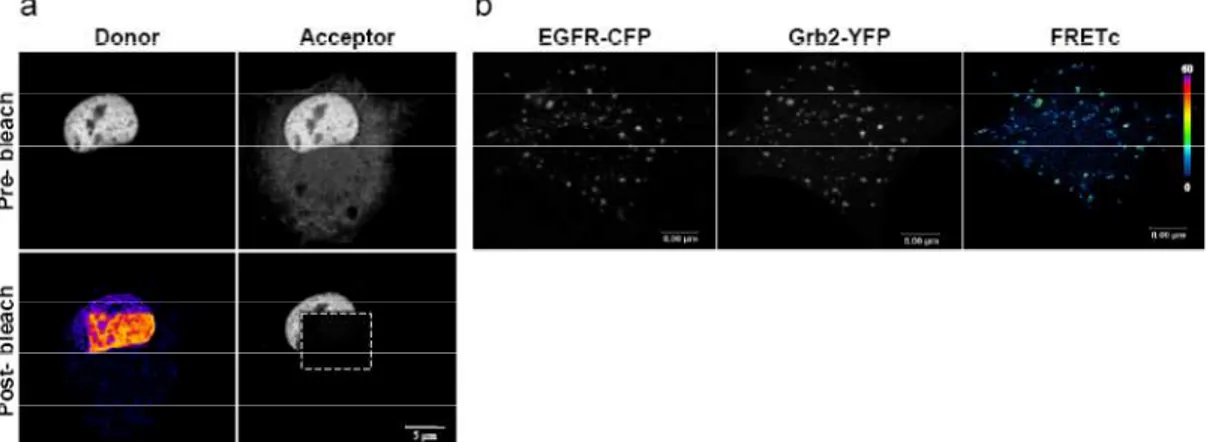
Acceptor photobleaching is an intensity-based method that takes advantage of loss of donor signal due to FRET. It compares images of donor before and after photobleaching of the acceptor in a region of interest in the sample. If FRET occurs, donor will increase its emision signal after acceptor photobleaching (see example in fig. 6a). The efficiency is calculated as
E= (D2-D1)/D2,
where D2 is the donor intensity of the region of interest after acceptor photobleaching in that area and D1 is the donor intensity before photobleaching. For this method, fixed samples are necessary.
Sensitized emission method is another intensity-based method that takes advantage of the increase of acceptor signal under FRET conditions when illuminating specifically the donor . This method is based on the acquisition of an image called FRET channel that is the acceptor image under donor excitation light, together with the images of donor and acceptor (see fig. 6b). FRET image has to be corrected for i) the emission of acceptor directly excited with donor excitation light and ii) crosstalk of donor emision. The crossexcitation and crosstalk values are calculated from images of samples labelled only with either donor or acceptor. FRET corrected image can be normalized by the amount of donor or acceptor or both. FRET efficiency can be further calculated if the G factor is calculated. The latter factor is the ratio of increase of acceptor emission due to FRET to the quenched donor intensity due to FRET, for a particular fluorophore pair and instrument imaging settings.
Figure 6.a) Acceptor photobleaching FRET experiment between cyan fluorescent protein (CFP), as donor, and yellow fluorescent protein (YFP), as acceptor, fused to two nuclear proteins. (Image
courtesy of Anna Perearnau and Oriol Bachs, University of Barcelona); b) Sensitized emission FRET experiment between Epidermal growth factor receptor- CFP (EGFR-CFP), and Grb2-YFP. Maximum FRET signal is localized at endosomes. FRET corrected image is shown in pseudocolor
in arbitrary linear units of fluorescence 3.3. Photobleaching techniques
Photobleaching is the irreversible loss of fluorescence after an exposure to high-intensity and continuous light. This phenomenon is used as a strategy to make evident the dynamics of molecules or the connection between compartments or cells in live cells, tissues or organisms. In a photobleaching experiment, under optimal conditions, fluorescence is irreversibly extinguished but the functionality of the tagged molecules is preserved. Molecules may be directly or indirectly labelled with fluorescent dyes or expressed as genetically-encoded fluorescent fusion proteins in live cells.
The l basis of these techniques is as follows. In unaltered cells, fluorescent molecules are in equilibrium. Photobleaching of molecules in a region of interest of the cell will disturb this equilibrium and redistribution of fluorescent and non fluorescent molecules along time will make evident the dynamics of the molecules. Photobleaching techniques are very flexible and can be adapted to resolve various biological problems [13].
The most straightforward photobleaching technique is fluorescence recovery after photobleaching (FRAP). In this technique, fluorescent molecules in a region of interest are bleached by a focused light (tipically a laser beam) and the fluorescence recovery in that region is
BT.4 quantified and compared to the initial conditions. Fluorescence recovery into the bleached region is
due to diffusion of surrounding non-bleached fluorescent molecules. Two parameters describe the molecular equilibration kinetics. The mobile fraction is the percentage of recovered fluorescence after photobleaching, compared to the initial conditions, and half time of recovery is the time at which half of the mobile fraction has recovered. Further analysis by kinetic modelling provides information on the molecular dynamics. This technique can provide information of mobile and immobile fraction, kinetics at different conditions, diffusion coefficient and association and dissociation kinetics (Fig. 7).
In Inverse FRAP experiments, all the fluorescent molecules in the cell, except for a small area, are bleached. The loss of fluorescence from the unbleached region in the postbleach images is then analysed. This technique allows to analyse dissociation parameters of molecules which are bound to an immobile structure (Fig. 7). FRAP can also be used as a contrast technique to visualize with a better signal-to-noise ratio the fluorescence structures dissociating from the region of interest.
Figure 7. a) FLIP experiment of p21-GFP to evaluate connectivity between intranucleolar body (red) and nucleoplasm (white). Representative images at different timepoints; b) FRAP experiment to evaluate dynamics of p21- GFP in intranucleolar body (red) and nucleoplasm (white)
under Adriamycine treatment.; c) Inverse FRAP experiment of GFP- vesicular stomatitis virus G wild type protein (GFP VSVG wt) in Golgi. Representative images at different timepoints of two different iFRAP experiments. d) Quantification of kinetic parameters of FLIP experiments in a); e)
Quantification of kinetic parameters of FRAP experiments in b) f) Quantification of various iFRAP experiments under the effect of different actin disrupting reagents (jpk: jasplakinolide; LtB:
LatrunculinB) (a, b, d and e adapted from Ref. [16]; c and f adapted from Ref. [15] ). Fluorescence Loss In Photobleaching (FLIP) experiments are different from FRAP experiments because a specified region of the cell is repetitively photobleached and the loss of fluorescence in non bleached parts of the cell is measured. These experiments are useful for studying connectivity between different regions and compartments of a cell and for studying fluxes between them (Fig. 7).
3.4. Extracting information from bioimaging: Image Analysis
Computer image analysis methods are available to help to observe the information in images, to minimize human bias, and to introduce rigor into the process of obtaining quantitative information. Images have to be processedbefore any numerical data can be obtained. This image processing
BT.4
acquisition (i.e, non-uniform illumination of the sample or high level of noise generated by the acquiring device). In a second step, differences in grey values (representing the brightness of the pixels) between the objects of interest and the background can be improved. Once objects or features to be measured are clearly identifiable, they can be easily segmented. Segmentation, the last step, will divide images into two domains, namely the objects and the rest. It generates, therefore, a two-level or binary image which can be used directly for quantification or can be applied over the original image as a mask, restricting those pixels in the original image that will be used for quantitative evaluation.
Image quantification can provide different types of information. The number of objects is one of the typical measurements that is obtained but many morphometric parameters can also be measured: area, shape, orientation, etc. Densitometric parameters (intensity, optical density) can also be obtained from image analysis. A common application derived from intensity measurements is for instance, the analysis of the degree of overlap between two different proteins, that is, the colocalization between them. Moreover, quantification can also be performed in multidimensional images. A stack or sequence of xyz images can be used, for instance, to make a 3D reconstruction to visualize the shape and appearance of real objects (Fig. 2e), or to measure 3D parameters such as the volume. The time dimension (xt, xyt, or xyzt images) allows the analysis of live biological processes. In this sense, the movement of cells (cell tracking, Fig. 5) or the concentration of ions (i.e. intracellular Ca2+) after different treatments or in different biological conditions can be quantified. Moreover, as mentioned above, the loss and recovery of fluorescence (FLIP and FRAP respectively, Fig. 7) are also examples of intensity measurements over time.
Acknowledgements Acknowledgements Acknowledgements Acknowledgements
The authors would like to acknowledge the invaluable contribution of Esther Castaño from her expertise in citometry. We would like to thank Elisenda Coll and Katarzyna Górka for their help in reviewing the manuscript and for image acquisition and processing.
References References References References
[1] Pawley JB 2006 Handbook of biological confocal microscopy. New York: Plenum Press.
[2] Huang B, Babcock H, Zhuang X. 2010 Cell. 143(7):1047
[3] http://www.piercenet.com/browse.cfm?fldID=4DD9D52E-5056-8A76-4E6E 217FAD0D86B#brightness.
[4] Gamell C, Susperregui AG, Bernard O, Rosa JL, Ventura F. 2011 PLoS One 28
[5] Campagnola 2011 P.Anal Chem. 1;83(9):3224
[6] Cox G, Kable E. 2005 Methods in Molecular Biology 319
[7] Diaspro A, Chirico G, Collini M. 2005 Q Rev Biophys38(2):97
[8] Del Toro D, Xifró X, Pol A, Humbert S, Saudou F, Canals JM, Alberch J. 2010 J Neurochem. 115(1):153
[9] Prasher D, Eckenrode V, Ward W, Prendergast F, Cormier M 1992. Gene 111 (2): 229.
[10] Shaner N, Steinbach P, Tsien R. 2005. Nat Methods 2 (12): 905.
[11] Fellers TJ, Davidson MW 2007 Olympus Fluoview Resource Center. National High Magnetic Field
Laboratory.
[12] Claxton N S, Fellers T J, Davidson M W 2008 Laser scanning confocal microscopy.
[13] Rabut, G., and J. Ellenberg. Live Cell Imaging: A Laboratory Manual. Vol. 1. R.D. Goldman and D.L.
Spector, editors. Cold Spring Harbor Laboratory Press, Cold Spring Harbor. 101-127
[14] Stryer L, Haugland RP. Proc Natl Acad Sci U S A. 1967 58(2):719
[15] Lázaro-Diéguez F, Colonna C, Cortegano M, Calvo M, Martínez SE, Egea G. 2007 FEBS Lett.
7;581(20):3875
[16] Abella N, Brun S, Calvo M, Tapia O, Weber JD, Berciano MT, Lafarga M, Bachs O, Agell N. 2010
[17] Traffic 11(6):743
[18] Consejo General de Colegio Oficiales de Farmacéuticos. 2010. Biotecnología y Biofármacos (Módulo
![Figure 1. a) Jablonski energy diagram of fluorescence (adapted from Ref. [3]); b) Different ways of staining a target molecule with a fluorochrome](https://thumb-eu.123doks.com/thumbv2/123dokorg/4426312.29266/4.892.502.767.138.420/figure-jablonski-diagram-fluorescence-different-staining-molecule-fluorochrome.webp)