DETERMINANTS OF FURTHER SURVIVAL IN CENTENARIANS FROM THE PROVINCE OF MANTOVA
P. Gueresi, R. Miglio
1. INTRODUCTION
The interest in centenarians as a study model for ageing and longevity on one hand (IMUSCE, 1995; Franceschi, 1993) and the demographic explosion of cen-tenarians (Vaupel and Jeune, 1995) with its consequences on society, economy and welfare on the other, encouraged several Italian research groups in the mid Nineties to undertake multidisciplinary studies on population-based samples of extremely old people (Deiana et al., 1999; INRCA, 1999).
Among these was the MALVA study which addressed subjects aged 98+ resid-ing in the province of Mantova (Northern Italy) at the 1st April 1998. The aims of the project were to add to the knowledge about geographic distribution, demo-graphic and socio-economic characteristics and state of health of extremely old people as well as to contribute to the establishment of a biological bank contain-ing cells and DNA of centenarians, useful for investigatcontain-ing the immunological and genetic bases of longevity.
We would like to mention here that Prof. Antonio Parmeggiani, to whom this paper is dedicated, was greatly interested in the topic of longevity which led him to act as supervisor on an undergraduate thesis entitled (“La misura della popo-lazione centenaria in alcuni comuni dell’Emilia Romagna (1990-1996)” by Daniela Bertuccini, 1996-97). Based on data obtained from Registry offices regarding residents and deceased between 1990 and 1996 in some municipalities of Emilia-Romagna, the work supervised by Prof. Parmeggiani defined a framework for comparison of demographic data on centenarians from the province of Mantova. Moreover it also provided life tables distinguished by age classes on an annual ba-sis for the male and female population aged 85+.
In comparison with previous studies, MALVA’s objective was also to evaluate the health status of the oldest old reducing as far as possible the bias caused by the extremely high mortality rate, as required by a cross-sectional study. The per-centage of 98+ subjects in good mental and physical conditions (category A of the health status classification proposed by Franceschi et al., 2000) recorded in the MALVA study was 12% (Gueresi et al., 2003), therefore lower than that observed
in the previous Italian studies which had not been able to enrol the frailer sub-jects.
In the Mantova province, 49% of the severely disabled subjects did not benefit from any kind of assistance, neither in an institution or at their home, and were therefore dependent on their family members. However, the subjects whose functional status was heavily compromised fell into a condition of severe disabil-ity at a median age of 95.5 with 83 and 99.8 years as the 5th and 95th percentile, and therefore generally enjoyed a state of good health right into very old age (Gueresi et al., 2008).
With the extinction of the cohort of participants in the MALVA project (the last female having died in April 2008 at the age of 109), to conclude the study it seemed interesting to evaluate which variables pertaining to socio-demographic characteristics, functional and nutritional status and predictors of mortality in the younger elderly influenced further survival in the subjects aged 98+ of the Man-tova province.
The data were analysed using Cox regression models estimated on a set of pre-defined variables and considering methods for multiple imputation of missing values.
2. SAMPLE AND METHODS 2.1. Sample
The eligible subjects for the Malva study were the subjects resident in the Man-tova province aged 98 years at 1st April 1998 according to the lists of residents provided by the Registry offices of the 70 municipalities in the province.
At that time residing in the Mantova province were 117 subjects aged 98+ (about 32 every 10000 residents) among which 101 were females and 16 males, with a female/male ratio of 6.3.
Of the 117 eligible subjects, 84 agreed to participate in the study, 29 refused to be interviewed, while 4 were in actual fact domiciled outside the province and were unobtainable.
In order to preserve as far as possible the characteristics of a cross-sectional study, reducing the bias due to the extremely high mortality rate at advanced ages, the strategy of enrolment (detailed in Gueresi et al., 2003) included choosing a cir-cumscribed geographical area, identifying and contacting the potential partici-pants before the starting date of the survey, containing as far as possible the time required for data collection (a three month period between April and June 1998) and interviewing firstly the frailer subjects according to indications by their gen-eral practitioners. As a result, only 7 of the 84 (i.e. 8%) subjects who agreed to participate in the study died before the interview.
The age of participants was validated by the Census registry and other documents. Age and gender distribution of the participants in the MALVA study is shown in table 1.
TABLE 1
Age and gender distribution of the participants in the MALVA study
Age Females Males Total
98 29 5 34 99 12 0 12 100 12 0 12 101 3 3 6 102 2 1 3 103 3 1 4 104 5 0 5 105 1 0 1 Total 67 10 77
As discussed thoroughly elsewhere (Gueresi et al., 2003), the participants can be considered representative of the whole 98+ population residing in the Man-tova province as regards age range, sex ratio and territorial distribution. More-over, it can be observed that the survival after six months from the interview was 79.8% among those who agreed to participate in the study and 79.3% among the refusals, suggesting a similar health status in the two groups.
The study protocol comprising inclusion criteria, informed consent form, col-lecting procedure and questionnaire was submitted to and approved by the Ethi-cal Committee of the Italian National Research Centre on Ageing (INRCA), An-cona.
Data were collected at the subjects’ homes by a physician and a biologist, both specifically trained for the task. The participants were administered an interview and various tests to evaluate physical and cognitive functions and underwent a medical examination, anthropometric measuring and blood sampling. The ques-tionnaire, much of which shared with other Italian studies on centenarians (IMUSCE, 1995; Deiana et al., 1999; INRCA, 1999), is specified in Gueresi et al., 2003.
2.2. Methods
Data were analysed using different Cox proportional hazard regression models using first a set of predefined variables as will be described. Each model adjusts for the effects of gender and age.
Assume we observe time to the event of interest for n independent subjects, and let (ti, i) denote the observed time and the event indicator for the i-th sub-ject. Denote also by Xj the vector of subject specific covariate. The Cox propor-tional hazard regression assumes that the individual hazard function (t,xi) has a multiplicative form that models the effects of covariates:
0
( , )t i ( )exp( ' )t i
x x (1)
0(t) is the baseline hazard function at time t. The regression parameters are estimated by maximizing the partial likelihood l() (Collett, 1994).
A key assumption of the Cox regression model is proportional hazards. The proportional hazards assumption means that the hazard ratio is constant over
time, or that the hazard for an individual is proportional to the hazard for any other individual. Proportional hazards assumption for each Cox regression model was assessed using test based on the Schoenfeld partial residuals which is a meas-ure of the difference between the observed and expected value of the covariate at each time (Shoenfeld, 1982; Therneau and Grambsch, 2000).
The analysed data contain missing values, however, and standard casewise deletion would result in an important reduction in sample size. In this paper Multivariate Imputation by Chained Equations (MICE, van Buuren et al, 1999) has been used. Following this approach a conditional distribution is specified for the missing data of each incomplete variable, for example in the form of a linear or (polytomous) logistic regression of the incomplete covariate given a set of predictors. Predictors themselves can be incomplete. It is assumed that a multivariate distribution exists from which these conditional distributions can be derived, and that iterative Gibbs sampling from the conditionals can gener-ate draws from it.
The method of multiple imputation (MI) is used increasingly for analyzing data-sets with missing observations.
The basic idea of data analysis with multiple imputation is to create a small number, m, of copies of the data, each of which has the missing values suitably imputed. It is usual to choose m=3 or 5, in this paper m=5 have been used. Then, each complete dataset is analysed independently. Estimates of parameters of in-terest are averaged across the m copies to give a single estimate. Standard errors are computed according to the “Rubin rules” (Rubin, 1987).
Suppose that initially our primary interest lies in a scalar estimand Q. In a typi-cal case, this might be a regression coefficient, for example, the log hazard ratio in a Cox regression model. Suppose that we have imputed m complete data-sets us-ing an appropriate model. In each of these data-sets, we use standard complete-data methods to obtain an estimate of Q with an associated estimated variance.
Let (k) and V(k) denote the point estimate and variance respectively from the k-th (k = 1, 2,...,m) data-set.
As might be expected, the multiple imputation point estimate of is the aver-age of the m complete-data estimates .
Combining information on within-imputation and between-imputation varia-tion is required to obtain a valid standard error for this estimate (Carlin et al., 2003). Between-imputation variation is important in reflecting variability due to imputation uncertainty.
The within-imputation variance component is obtained as the average of the complete-data variance estimates:
1 1 m k k W V m
(2)While the between-imputation variance is calculated by a simple empirical combination of the complete-data point estimates:
( ) 2 1 ˆ 1 ( ) 1 m k k B m
(3)The total variance in the combined estimate of is then given by 1 1 T W B m (4)
and Rubin (1987) shows that, approximately,
1/2( ) ~ T t (5) where 2 ( 1) 1 (1 1/ ) W m m B (6)
Therefore a 100(1 − α)% interval estimate for is
,1 /2
t T
(7)
The simple methods described above for scalar estimands do not generalize immediately for a multidimensional (vector) quantity, but Li, Raghunathan, and Rubin (1991) have proposed an approximate method to give a p-value for the null hypothesis that all components of a vector Q are equal to zero.
The overall estimates incorporate the missing data uncertainty as well as sam-pling variation. An essential requirement for the MI method to work in practice is that imputation should be performed under a model that is general enough to make the missing at random (MAR) assumption defensible, even if this model uses variables that are not of substantive interest for later data analysis.
Adopting methods for multiple imputation of missing value, four distinct Cox regression models were estimated, as will be described below. Finally two com-plete models have been considered: the first one included the statistically signifi-cant variables in the previous analyses, while the second one was obtained with a backward selection procedure using a p-value of 10% for removal. Analyses were carried out using STATA (ver. 9.0).
The four estimated models refer to groups of features which may have a sig-nificant impact on survival of the elderly as reported in the literature: socio-demographic characteristics, functional status, nutritional status, cardiovascular risk factors.
Among the very numerous variables collected during the course of the survey, included were those variables which according to previous studies have been shown to be predictive of survival in the elderly, focusing on factors that may be still relevant in the extreme stages of life. Not taken into consideration instead
were certain features of potential interest to the analysis due to their reduced vari-ability in the examined group (e.g. only four out of the 77 participants in the study were or had been smokers) or to the great number of missing data (e.g. the Geriatric Depression Scale could not be administered to 43% of the participants due to serious cognitive or sensory impairment).
“Socio-demographic” model.
Included in the “socio-demographic” model are the following variables: gen-der, age, offspring (has living offspring, had offspring now deceased, never had offspring) institutionalization (yes/no), civil status (widowed, unmarried), level of education (schooling years), financial support from relatives, acquaintances or the social services (yes/no).
“Functional” model.
The variables included in the “functional” model (ADL-Activities of Daily Liv-ing, walking 400m, MMSE- Mini Mental State Examination, Self-rated health) are considered salient aspects in any classification of the health status at very old age.
The degree of autonomy was determined by the WHO scale that assesses the degree of self-maintenance considering 21 different activities of daily living. Among these, five items covering Katz’s ADL scale were examined: bathing, dressing, feeding, toileting and transfer. Each activity was rated on a 4-point scale: 1, the subject carries out the activity without difficulty; 2, with some difficulty but without assistance; 3, with partial assistance; and 4, with total assistance. In order to summarize the information on the ability of the elderly to perform daily activi-ties, subjects have been classified as follows: “independent or moderately de-pendent” (the subject needs assistance in performing 0-2 activities) and “severely or completely dependent” (the subject needs assistance in performing 3-5 activi-ties).
Not considered were performance-based measures included in the MALVA protocol, due to the high number of subjects who did not perform the tests. However, to examine more thoroughly the functional status of the subjects be-yond their capacity to perform the basic activities of daily living, considered was the ability to walk 400 m, as evinced by their answers to the WHO questionnaire.
Cognitive function was assessed by the “Mini Mental State Examination” test (Folstein et al., 1975). The crude score was adjusted for years of schooling. Sub-jects unable to carry out the test since they were classified by physicians as suffer-ing from dementia were assigned score 0. Categorization of cognitive impairment was made according to the classification criteria proposed by Franceschi et al., 2000, where a score of 12 or more points indicates absence of severe cognitive impairment, while a score <12 points suggests the presence of severe cognitive impairment.
General self-rated health was evaluated according to a 5-point scale; to the question “How do you feel about your health?” the interviewees could answer: “very well”, “well”, “not too bad”, “bad” or “very bad”. The analysis considered three groups: “very well or well”, “not too bad”, “bad or very bad”.
For this group of variables it was not possible to estimate a single model be-cause of the high association between variables. In fact, almost all the subjects with cognitive problems are seriously limited in their daily activities or in walking, whereas the subjects with severe limitations in daily activities are not able to walk 400m without assistance. Different models have therefore been considered in-cluding alternatively ADL, MMSE and the WHO question about the ability to walk 400 m. Each of these models comprises, as usual, age, gender and, in addi-tion, the self-rated health scale.
“Cardiovascular” model.
This model included several known factors representing risk or protection for cardiovascular diseases: hypertension (in presence of therapy for hypertension or blood pressure values above 140-90 mmHg), previous cardiovascular or cere-brovascular disease (angina, myocardial infarction, stroke), serum total cholesterol levels (>200 mg dl-1/<=200 mg dl-1), serum HDL(>60 mg dl-1/<=60 mg dl-1) and serum triglycerides (>150 mg dl-1 /<=150 mg dl-1).
Also considered was pulse rate (beats min-1), given that a fast heart rate has been recognized as a precursor of hypertension and atherosclerosis and a predic-tor for cardiovascular and non-cardiovascular mortality (Kannel et al., 1987; Fuji-ura et al., 2001).
To record pulse rate and blood pressure mean values of at least three consecu-tive measurements were used.
Finally, added to the model was Body Mass Index1. Subjects were divided into three BMI categories: “underweight” (BMI <18.5), “normal weight” (BMI ≥ 18.5 and <25), “overweight - obese” (BMI ≥ 25).
In 44% of cases it was not possible to measure height and weight directly and therefore the values referred by the participant or their proxy were used.
“Nutritional” model
The variables in the “nutritional” model included haematochemical parameters used as indicators of the protein, carbohydrate and lipid supply (serum albumin (mg/dl), blood glucose (mg/dl) and total cholesterol (mg/dl) respectively), be-sides the information directly provided by the subjects concerning their con-sumption of fruit/vegetables rich in vitamins and minerals (yes/no) and their consumption of liquids (“less than 3 glasses”, “3-5 glasses” and “over 5 glasses”). Other items in the questionnaire were not used given a certain uniformity in the diet of the centenarians: for example 87% of the subjects had pasta or rice and 95% had milk, cheese or yoghurt every day. Considered lastly were several an-thropometric characters: to BMI were added the arm circumference (cm) and tri-ceps skinfold thickness (mm) according to Lohman et al. (1988).
3. RESULTS AND DISCUSSION
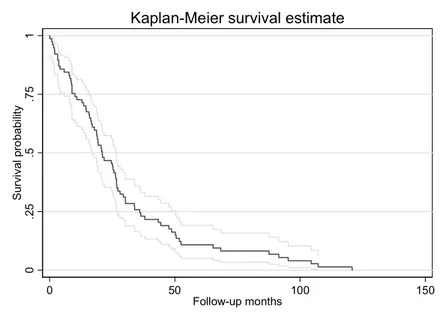
Figure 1 depicts the Kaplan Meier estimates of the survival function for the entire follow-up: the median survival time is equal to 21 months, while after about 35 months 75% of subjects were died. Tables 2 and 3 report some descrip-tive statistics for the variables used in the Cox models.
Table 4 shows the results obtained from the Cox models that used as covari-ates the four set of variables illustrated in the previous paragraph. All the esti-mated models satisfy the proportional hazard assumption.
In the “socio-demographic” model institutionalization is the only variable sig-nificantly related to survival time, with an increase in the risk of death of 247% and quite a large confidence interval (95% CI=80-669).
It has previously been reported that in the MALVA study the only significant determinant for institutionalization was the absence of living offspring, however among the participants in the study about 83% of institutionalized subjects were severely disabled (Gueresi et al., 2008). Since institutionalization concerns often frail and dependent individuals who cannot receive support at home from the family, being institutionalized can involve unfavourable conditions such as a dete-riorated state of health, reduced environmental, social and affective stimuli, a worsened psychological state and increased risk of malnutrition, all of which may have repercussions on survival.
In the “functional” models the variables that significantly influence survival are those describing cognitive function (MMSE test), the ability to walk and the self-rated health scale, showing that only two of the three estimated models appear of interest in the analysis of survival. Table 4 shows the results for the “functional” framework: in the first model (model a) the absence of severe cogni-tive impairment reduces the hazard rate by 48% (95% CI 2-72), while an increase in the hazard rate of 282% (95% CI 2-1340) is shown when comparing “bad or very bad” with respect to “very well or well” categories of the self-rated health scale. The model including the WHO item (model b) shows an increase in the hazard rate of 87% (95% CI 5-233) when comparing centenarians unable to walk 400m without assistance with those able to, and an increase of 368 % (95% CI 16-1783) when comparing health self-rating “bad or very bad” with “very well or well”.
Despite the fact that the ADL score did not here predict survival, the signifi-cant influence on mortality of the ability to walk 400m confirms that disability, which represents a common outcome for acute and chronic diseases, can be con-sidered a valuable indicator of worsened health in the oldest old. On the whole, the results of the “functional” model are in agreement with the findings from Nybo et al. (2003), reporting that in Danish nonagenarians mortality was pre-dicted by high disability level, poor physical and cognitive performance, and self-rated health (in women).
Interestingly, in the “cardiovascular” model the conditions recognized as car-diovascular risk factors in the middle-aged and younger elderly do not represent a risk for centenarians. On the contrary, a total serum cholesterol level above 200
mg/dl has an hazard ratio of 0.6, however not statistically significant (p-value = 0.16). The relative risk associated with higher serum total cholesterol seems to decline with age and in older persons cholesterol might be inversely associated with total mortality (Weverling-Rijnsburgeret al., 1997; Brescianini et al., 2003).
The well-known protective effect of high serum HDL concentration, which has also been reported for centenarians (Hagberg and Samuelsson, 2008), does not reach the statistical significance in the extremely aged people from the Mantova province, probably because here the generally high HDL values suggested the use of a decidedly high threshold.
0 .2 5 .5 .7 5 1 S ur vi val pr o babi lit y 0 50 100 150 Follow-up months
Kaplan-Meier survival estimate
Figure 1 – Kaplan Meier estimates of the survival function.
TABLE 2
Descriptive statistics for quantitative variables
N. Mean Std. Dev. Min Max
Age 77 100.20 1.86 98.01 105.58
Serum albumin (mg/dl) 73 3.63 0.47 2.17 4.49
Serum total cholesterol (mg/dl) 73 199.40 43.21 100.00 313.00
Arm circumference (cm) 69 21.06 2.60 15.60 27.30
Education (schooling years) 67 5.04 3.04 2.00 14.00
Pulse rate (beats/min) 73 71.45 11.47 47.00 108.00
TABLE 3
Descriptive statistics for qualitative variables
N. Percent
Offspring 72
had offspring now deceased 11.11
has living offspring 69.44
never had offspring 19.44
Institutionalization 77 no 62.34 yes 37.66 Gender 77 female 87.01 male 12.99 Civil status 76 unmarried 11.84 widowed 88.16
Financial support from relatives, acquaintances or the social services 77
no 50.65
yes 49.35
MMSE 71
presence of severe cognitive impairment 53.52
absence of severe cognitive impairment 46.48
ADL 77
severely or completely dependent 74.03
independent or moderately dependent 25.97
Hypertension 75
no 73.33
yes 26.67
High density lipo-protein (HDL) 73
<=60 mg/dl 53.42
>60 mg/dl 46.58
Triglycerides 71
<= 150 mg/dl 77.46
> 150 mg/dl 22.54
Previous cardiovascular or cerebrovascular diseases 75
no 61.33 yes 38.67 BMI 77 <18.5 9.09 18.5-24.9 63.64 >= 25 27.27 Consumption of fruit/vegetables 75 no 21.33 yes 78.67
Daily liquid intake 77
less than 3 glasses 24.68
3 - 5 glasses 68.83
over 5 glasses 6.49
WHO 4: walking 400m without assistance 69
yes 28.99
TABLE 4
Variables predicting survival after 98 years of age. Models for group of prognostic factors
HR [95% CI] P-value
Socio-demographic characteristics
Has living offspring [had offspring now deceased] 0.87 0.36 2.09 0.76
Never had offspring [had offspring now deceased] 0.68 0.24 1.93 0.47
Institutionalization [no] 3.47 1.80 6.69 <0.001
Education (schooling years) 0.89 0.69 1.14 0.35
Gender [female] 1.82 0.87 3.82 0.11
Age 1.23 0.93 1.63 0.15
Financial support [no] 1.06 0.65 1.73 0.81
Civil status [unmarried] 1.89 0.87 4.11 0.11
Functional status (model a)
MMSE: presence of severe cognitive impairment [yes] 0.52 0.28 0.98 0.04
Perceived health “not too bad” [“very well or well”] 0.87 0.47 1.61 0.66
Perceived health “bad or very bad” [ “very well or well”] 3.82 1.02 14.40 0.05
Gender [female] 1.64 0.82 3.29 0.16
Age 1.22 0.93 1.61 0.15
Functional status (model b)
WHO 4 : walking 400m without assistance [yes] 1.87 1.05 3.33 0.03
Perceived health “not too bad” [“very well or well”] 1.18 0.68 2.05 0.55
Perceived health “bad or very bad” [“very well or well”] 4.68 1.16 18.83 0.03
Gender [female] 1.30 0.63 2.65 0.48
Age 1.16 0.90 1.51 0.25
Cardiovascular risk factors
Hypertension [no] 1.19 0.65 2.20 0.58
Serum total cholesterol [<=200 mg/ dl] 0.60 0.29 1.22 0.16
Serum HDL [<= 60 mg/ dl] 0.82 0.41 1.62 0.57
Serum triglycerides [<=150 mg/dl] 0.86 0.42 1.75 0.67
BMI < 18.5 [18.5-24.9] 3.83 1.45 10.11 0.01
BMI >= 25 [18.5-24.9] 1.09 0.58 2.06 0.80
Previous cardiovascular or cerebrovascular diseases [no] 1.02 0.59 1.77 0.95
Gender [female] 1.31 0.60 2.86 0.50
Age 1.10 0.80 1.50 0.53
Pulse rate (beats/min) 0.94 0.70 1.26 0.67
Nutritional status
Serum albumin (mg/dl) 0.62 0.43 0.88 0.01
Blood glucose (mg/dl) 1.14 0.83 1.58 0.41
Serum total cholesterol (mg/dl) 0.74 0.56 0.99 0.04
Consumption of fruit/vegetables[no] 0.83 0.40 1.72 0.62
Daily liquid intake: 3 - 5 glasses [less than 3 glasses] 0.83 0.36 1.95 0.68 Daily liquid intake: over 5 glasses [less than 3 glasses] 1.39 0.47 4.08 0.55
BMI < 18.5 [18.5-24.9] 2.33 0.78 6.91 0.13 BMI >= 25 [18.5-24.9] 1.25 0.67 2.36 0.49 Triceps skinfold (mm) 1.14 0.78 1.65 0.50 Arm circumference (cm) 0.72 0.49 1.06 0.10 Gender [female] 1.63 0.68 3.88 0.27 Age 0.92 0.68 1.25 0.61
Note: for polychotomous variables the reference category is reported in brackets; HR=hazard ratio; HDL=High-density lipo-protein. Hazard ratios for quantitative variables relate to a variation of 1 SD in each variable
TABLE 5
Variables predicting survival after 98 years of age. Synthetic model
Hazard ratio [95% CI] P-value
Institutionalization [no] 2.65 1.49 4.70 <0.001
MMSE: presence of severe cognitive impairment [yes] 0.52 0.29 0.91 0.02
Serum albumin (mg/dl) 0.74 0.52 1.06 0.10
Serum total cholesterol (mg/dl) 0.78 0.58 1.03 0.08
BMI < 18.5 [18.5-24.9] 4.33 1.75 10.72 <0.001
BMI >= 25 [18.5-24.9] 1.44 0.80 2.59 0.22
Gender [female] 2.30 1.04 5.06 0.04
Age 1.23 0.91 1.67 0.18
Note: for polychotomous variables the reference category is reported in brackets; HDL=High-density lipoprotein. Hazard ratios for quantitative variables relate to a variation of 1 SD in each variable.
The only factor that confirms a protective role at a younger age is having a BMI within normal values vs. being underweight, with an increment in risk for people with BMI below 18.5 of 283% (95% CI=45-1011). A U-shaped relation-ship between BMI and mortality has been often reported for the middle-aged but it is emerging that the WHO BMI thresholds for overweight and obesity may be too restrictive for older people. Indeed, among the oldest old the highest BMI is often associated with the lowest mortality (Nybo et al., 2003; Allard et al., 2000). Nevertheless, risk factors measured at old age do not necessarily reflect lifetime exposure to these factors (Nybo et al., 2003).
It has been put forward that the decreasing effect of some risk factors with ad-vancing age can be due to selective survival into very old age of “disease-resistant” phenotypes (Perls, 1995). Several studies have shown, in fact, that cen-tenarians have better cardiovascular risk profiles compared to younger old people, as reviewed in Galioto et al. (2008). This can depend on a favourable genetic pro-file, as suggested by the lower prevalence of cardiovascular diseases in centenari-ans’ offspring compared to controls without centenarian parents (Terry et al., 2003), together with a healthy past lifestyle, which seems widespread among sub-jects who have reached extreme longevity (Perls and Terry, 2003).
In the “nutritional” model serum albumin is a predictor of survival along with total cholesterol, with a reduction of 38 % (95% CI= 12-57) and 26 % (95% CI=1-44) respectively for a variation of 1 SD each (0.5 and 43). The protective effect of a BMI within normal values has shown to be not significant in this model, probably because BMI was included together with more predictive vari-ables that are related to it. Indeed, closer to statistical significance is arm circum-ference (p-value=0.10), a measure that has a biological meaning not unlike that of BMI (higher values indicate greater mass, without distinction between fat or lean mass) but seems to be more suitable for evaluating the elderly, being easy to measure.
On the whole, these results seem to confirm the importance of maintaining adequate nutrition in the oldest old. Chan et al. (1999) observed that centenarians have a poorer nutritional status compared to elderly and young subjects, which may be due to their decreased metabolism or to the selective advantage of slen-derness in achieving old age. However, malnutrition is one of the principal de-terminants of mortality in the very elderly.
Serum albumin has been recognized as an independent risk factor for mortality in the elderly (Sahyoun et al., 1996). In the study of Shimizu et al. (2001) on a sample of Japanese centenarians, serum albumin was the only significant factor influencing survival, after adjustment for clinical variables.
Besides malnutrition, there are several medical conditions predisposing to low levels of serum albumin (Fuhrman, 2002; Rozzini et al., 1997), which can be therefore considered an indicator of health status. However, a significant associa-tion between serum albumin and ageing has recently been observed (Gomi et al., 2007).
Low serum albumin concentration has also been associated with an increased risk of disability, suggesting a relation between hypoalbuminaemia and
sarco-penia, i.e. the loss of peripheral muscle tissue (Baumgartner et al., 1996). Inciden-tally, sarcopenia can be also related to a low BMI or low arm circumference, both emerging, in the “cardiovascular” or in the “nutritional” model, as unfavourable conditions for survival in the MALVA study participants.
Poor muscle strength consequent to loss of muscle mass is an important com-ponent of “frailty” and may be a predictor for adverse outcomes (Bergman et al., 2007). “Frailty” is considered a useful concept by geriatricians but there is still uncertainty and debate regarding its definition (Bergman et al., 2007). Widely used criteria include exhaustion, low handgrip strength, low gait speed, low physical activity and weight loss (Fried et al., 2001). However, an association between obe-sity and frailty syndrome has been reported in older women (Blaum et al., 2005). According to Rockwood (2005) frailty is likely to be correlated with disability, co-morbidity and self-rated health, and should identify a group that is vulnerable to adverse outcomes.
A low serum total cholesterol too can be seen as a marker of frailty in the old-est old (Spada et al., 2007), having been associated with unfavourable conditions such as a compromised cognitive function, comorbidity, disability, or malnutri-tion (Ranieri et al., 1998). Moreover, a combinamalnutri-tion of low albumin and low total cholesterol levels may identify subjects at risk of future functional decline (Schalk
et al., 2004).
It is worth noting that all the variables which have been shown to be signifi-cant in the “socio-demographic”, “functional”, “cardiovascular” or “nutritional” model – institutionalization, MMSE score, ability to walk, perceived health, BMI, serum albumin, serum total cholesterol- can be seen as markers of frailty or corre-lated conditions, so that the final model including these variables can be defined as a “frailty” model. In this model the functional status was represented by the MMSE variable, since it seemed to be of more general interest than the WHO questionnaire variable relating to the ability to walk 400m.
As can be seen in table 5, almost all the variables included in the final model confirmed their importance in predicting survival. Only the perceived health vari-able was excluded since it was no longer associated with survival. Furthermore, a significant disadvantage in terms of survival emerged for the male gender.
The same variables included in this final “frailty” model, with the addition of the civil status, were kept in the final model obtained with a backward selection procedure. Whatever path is selected for the final model, the best predictors of mortality are a Body Mass Index less than 18.5 and institutionalization. These characteristics emerge therefore as the best “frailty” indicators in the centenarians from the province of Mantova.
It has been suggested that frailty, favouring fractures, infections or other dis-eases, may amplify the role of “accidental” risk factors for death in the oldest old (Hagberg and Samuelsson, 2008; Rockwood and Mitnitski, 2007). Nevertheless, as Nybo et al. (2003) observed, death at extremely advanced age is not an entirely stochastic phenomenon simply because factors predicting survival do exist.
Indeed, it is emerging that survival of centenarians is influenced by factors on the whole similar even in geographical areas that are far apart, despite the
differ-ent genetic background and differdiffer-ent climate, nutrition, economic status, social and medical services to which the subjects have been exposed during the course of their whole life. Several studies (Shimizu et al., 2001; Allard et al., 2000; Nybo et
al., 2003; Hagberg and Samuelsson, 2008 and present study) agree on the finding
that factors predicting mortality in centenarians are not the same well-known predictors of mortality in the middle-aged and younger elderly.
Further research on predictors of mortality at advanced ages may help in better defining the state of health and the condition of “frailty” in the oldest old as well as in planning interventions for improving their survival and quality of life.
Dipartimento di Scienze Statistiche “P. Fortunati” PAOLA GUERESI
Università degli Studi di Bologna ROSSELLA MIGLIO
ACKNOWLEDGEMENTS
Thanks are due to Claudio Franceschi, coordinator of the MALVA project, to Leo-narda Troiano, Gabriella Pini, Ciro Lenti and Beniamino Coppa who collected the data and to Giulia Cavrini, Elisabetta Bonafede and Elisa Cevenini who collaborated in the preliminary phases of this study. Data collection in the MALVA study was supported by a grant from ‘Fondazione Cassa di Risparmio di Verona Vicenza Belluno e Ancona’.
REFERENCES
M. ALLARD, J.M. ROBINE, N. HENON (2000), Medical predictors of survival among centenarians, in P. Martin, C. Rott, B. Hagberg, K. Morgan (eds.), “Centenarians. Autonomy Versus De-pendence in the Oldest Old”, Serdi Edition, Paris, Springer Co., New York, pp. 41-59. R.N. BAUMGARTNER, K.M. KOEHLER, L. ROMERO, P.J. GARRY (1996), Serum albumin is associated with
skeletal muscle in elderly men and women, “The American Journal of Clinical Nutrition”, 64,
pp. 552-558.
H. BERGMAN, L. FERRUCCI, J. GURALNIK, D.B. HOGAN, S. HUMMEL, S. KARUNANANTHAN AND C. WOLF-SON (2007), Frailty: An Emerging Research and Clinical Paradigm-Issues and Controversies, “The Journals of Gerontology” series A Biological Sciences Medical Sciences, 62, pp. 731-737.
C.S. BLAUM, Q.L. XUE, E. MICHELON, R.D. SEMBA, L.P. FRIED (2005), The association between obesity
and the frailty syndrome in older women: the Women’s Health and Aging Studies, “Journal of the
American Geriatric Society”, 53, pp. 927-934.
S. BRESCIANINI, S. MAGGI, G. FARCHI, S. MARIOTTI, A. DI CARLO, M. BALDERESCHI, D. INZITARI; ILSA GROUP (2003), Low total cholesterol and increased risk of dying: Are low levels clinical warning signs in the elderly? Results from the Italian LongitudinalStudy on Aging, “Journal of the American
Geriatric Society”, 51, pp. 991-996.
J. B. CARLIN, N. LI, P. GREENWOOD, AND C. COFFEY (2003), Tools for analyzing multipleimputed
data-sets, Stata Journal, 3(3), pp 226-244.
Y.C. CHAN, M. SUZUKI, S. YAMAMOTO (1999), A Comparison of Anthropometry, Biochemical Variables
and Plasma Amino Acids among Centenarians, Elderly and Young Subjects, “Journal of the
American College of Nutrition”, 18, pp. 358-365.
L. DEIANA, L. FERRUCCI, G.M. PES, C. CARRU, G. DELITALA, A. GANAU, S. MARIOTTI, A. NIEDDU, S. PET-TINATO, P. PUTZU, C. FRANCESCHI, G. BAGGIO (1999), AKEntAnnos. The Sardinia study of
ex-treme longevity, “Aging Clinical Experimental Research”, 11, pp. 142-149.
M.F. FOLSTEIN, S.E. FOLSTEIN, P.R. MC HUGH (1975), Mini mental state: a practical method for grading the
cognitive state of patients for the clinician, “Journal of Psychiatric Research”, 12, pp. 189-198. C. FRANCESCHI(1993), Basi biologiche dell’invecchiamento e della longevità, in G. Crepaldi (ed.),
“Trattato di Gerontologia e Geriatria”, UTET, Torino, pp. 3-58.
C. FRANCESCHI, L. MOTTA, S. VALENSIN, R. RAPISARDA, A. FRANTONE, M. BERARDELLI, M. MOTTA, D. MONTI, M. BONAFÈ, L. FERRUCCI, L. DEIANA, G.M. PES, C. CARRU, M.S. DESOLE, C. BARBI, G. SARTO-NI, C. GEMELLI, F. LESCAI, F. OLIVIERI, F. MARCHEGIASARTO-NI, M. CARDELLI, L. CAVALLONE, P. GUERESI, A. COSSARIZZA, L. TROIANO, G. PINI, P. SANSONI, G. PASSERI, R. LISA, L. SPAZZAFUMO, L. AMADIO, S. GIUNTA, R. STECCONI, R. MORRESI, C. VITICCHI, R. MATTACE, G. DE BENEDICTIS, G. BAGGIO AND
THE ITALIAN MULTICENTER STUDY ON CENTENARIANS (IMUSCE) (2000), Do men and women
follow different trajectories to reach extreme longevity? “Aging Clinical Experimental Research”,
12, pp. 77-84.
L.P. FRIED, C.M. TANGEN, J. WALSTON, A.B. NEWMAN, C. HIRSCH, J. GOTTDIENER, T. SEEMAN, R. TRACY, W.J. KOP, G. BURKE, M.A. MCBURNIE; CARDIOVASCULAR HEALTH STUDY COLLABORATIVE RE-SEARCH GROUP (2001), Frailty in older adults: evidence for a phenotype, “The Journals of Ger-ontology” series A Biological Sciences Medical Sciences, 56, pp. M146-156.
M.P. FUHRMAN (2002), The albumin-nutrition connection: separating myth from facts, “Nutrition”, 18, pp.199-200.
Y. FUJIURA, H. ADACHI, M. TSURUTA, D.R. JR JACOBS, Y. HIRAI, T. IMAIZUMI (2001), Heart rate and
mortality in a Japanese general population: an 18-year follow-up study, “Journal of Clinical
Epi-demiology”, 54, pp. 495-500.
A. GALIOTO, L.J. DOMINGUEZ, A. PINEO, A. FERLISI, E. PUTIGNANO, M. BELVEDERE, G. COSTANZA, M. BARBAGALLO (2008), Cardiovascular risk factors in centenarians, “Experimental Gerontology” 43, pp. 106-113
I. GOMI, H. FUKUSHIMA, M. SHIRAKI, Y. MIWA, T. ANDO, K. TAKAI, H. MORIWAKI(2007), Relationship
between Serum Albumin Level and Aging in Community-Dwelling Self-Supported Elderly Popula-tion “Journal of NutriPopula-tional Science and Vitaminology” 53, pp. 37-42.
P. GUERESI, L. TROIANO, N. MINICUCI, M. BONAFE`, G. PINI, G. SALVIOLI, C. CARANI, L. FERRUCCI, L. SPAZZAFUMO, F. OLIVIERI, G. CAVRINI, D. VALENTINI, C. FRANCESCHI (2003), The MALVA
(MAntova LongeVA) study: an investigation on people 98 years of age and over in a province of Northern Italy, “Experimental Gerontology” 38, pp. 1189-1197.
P. GUERESI, G. CAVRINI, L. TROIANO, N. MINICUCI, L. SPAZZAFUMO, C. FRANCESCHI (2008), Health
Status and Quality of Life at Extremely Advanced Ages: an Investigation on People 98 Years of Age and Over in a Province of Northern Italy, “Biennial Books of the European
Anthropo-logical Association”, 5, pp. 73-89.
B. HAGBERG, G. SAMUELSSON (2008), Survival after 100 years of age: a multivariate model of
excep-tional survival in Swedish centenarians, “The Journals of Gerontology”, series A Biological
Sciences, Medical Sciences, 63, pp. 1219-1226.
INRCA- ITALIAN NATIONAL RESEARCH CENTERS ON AGING (1999), Caratteristiche socio-economi-
che-epidemiologiche dei centenari della Regione Marche: studio pilota degli ultranovantacinquenni nella città di Ancona, Aniballi Grafiche, Ancona.
ITALIAN MULTICENTER STUDY ON CENTENARIANS(IMUSCE) (1995), I centenari in Italia: aspetti epidemiologici e clinico-biologici, “Atti del 96° Congresso della Società Italiana di Medicina
Interna”, Pozzi, Roma, pp. 117-218.
K. LI, T. RAGHUNATHAN, D. RUBIN (1991), Large sample significance levels from multiply-imputed data
using moment-based statistics and an F reference distribution, “Journal of the American
W.B. KANNEL, C. KANNEL, R.S. JR. PAFFENBARGER, L.A. CUPPLES (1987), Heart rate and cardiovascular
mortality: the Framingham Study, “American Heart Journal”, 113, pp. 1489-1494.
T.G. LOHMAN, A.F. ROCHE, R. MARTORELL (1988), Anthropometric Standardization Reference Manual, Human Kinetic books, Champaign-Illinois.
H. NYBO, H.C. PETERSEN, D. GAIST, B. JEUNE, K. ANDERSEN, M. MCGUE, J.W. VAUPEL, K. CHRISTENSEN (2003), Predictors of Mortality in 2,249 Nonagenarians-The Danish1905-Cohort Survey,
“Jour-nal of the American Geriatric Society” 51, pp. 1365-1373. T. PERLS (1995), The oldest old, “Scientific American”, 272, pp. 70-75.
T. PERLS, D. TERRY (2003), Understanding the determinants of exceptional Longevity, “Annals of In-ternal Medicine”, 139, pp. 445-449.
P. RANIERI, R. ROZZINI, S. FRANZONI, P. BARBISONI, M. TRABUCCHI (1998), Serum Cholesterol Levels
as a Measure of Frailty in Elderly Patients, “Experimental Aging Research”, 24, pp.
169-179.
K. ROCKWOOD (2005), What would make a definition of frailty successful?, “Age and Ageing”, 34, pp. 432-434.
K. ROCKWOOD, A. MITNITSKI (2007), Frailty in relation to the accumulation of deficits, “The Journals of Gerontology” series A Biological sciences Medical sciences, 62, pp. 722-727. R. ROZZINI, P. BARBISONI, G.B. FRISONI, M. TRABUCCHI (1997) Albumin as a predictor of mortality in
elderly patients, “Journal of clinical epidemiology”, 50, pp. 865-867.
D. B. RUBIN (1987), Multiple imputation for non-response in surveys, John Wiley & Sons. New York.
N.R. SAHYOUN, P.F. JACQUES, G. DALLAL, AND R.M. RUSSELL (1996), Use of Albumin as a Predictor of
Mortality in Community-Dwelling and Institutionalized Elderly Populations, “Journal of Clinical
Epidemiology”, 49, pp. 981-988.
B.W.M. SCHALK, D. VISSER, D.J.H. DEEG, L.M. BOUTER(2004),Lower levels of serum albumin and total cholesterol and future decline in functional performance in older persons: the Longitudinal Aging Study Amsterdam, “Age and Ageing”, 33, pp. 266-272.
K. SHIMIZU, N. HIROSE, Y. ARAI, Y. GONDO, Y. WAKIDA (2001), Determinants of further survival in
cen-tenarians, “Geriatrics and Gerontology International”, 1, 14-17.
d. SCHOENFELD(1982), Partial residuals for the proportional hazards model, “Biometrika”,69, pp 551-555.
R.S. SPADA, G. TOSCANO, F.I. COSENTINO, I. IERO, B. LANUZZA, M. TRIPODI, R. FERRI (2007), Low total
cholesterol predicts mortality in the nondemented oldest old, “Archives of Gerontology and
Geri-atrics”, 44 Suppl .1, pp. 381-384.
t.m. THERNEAU, P.M. GRAMBSCH (2000), Modelling Survival Data: Extending the Cox Model, Springer, New York.
D.F. TERRY, M. WILCOX, M.A. MCCORMICK, E. LAWLER, T.T. PERLS (2003), Cardiovascular advantages
among the offspring of centenarians, “The Journals of Gerontology”, series A, Biological
Sci-ences Medical SciSci-ences, 58, pp. M425-431. Erratum in Vol. 63, p. 706, 2008.
S. VAN BUUREN, H.C. BOSHUIZEN, D.L. KNOOK (1999), Multiple imputation of missing blood pressure
covariates in survival analysis, “Statistics in Medicine”, 18, pp. 681-694.
J.W. VAUPEL, B. JEUNE (1995), The emergence and proliferation of centenarians, in: B. Jeune, J.W. Vaupel (eds.), “Exceptional Longevity: From Prehistory to the Present”. Odense Monographs on Population Aging n. 2, Odense University Press, Odense, Denmark. A.W. WEVERLING-RIJNSBURGER, G.J. BLAUW, A.M. LAGAAY, D.L. KNOOK, A.E. MEINDERS, R.G.
WESTENDORP (1997), Total cholesterol and risk of mortality in the oldest old, “Lancet”, 350, pp. 1119-1123.
SUMMARY
Determinants of further survival in centenarians from the province of Mantova
The MALVA project, one of the first Italian studies on population-based samples of centenarians, was addressed to the subjects aged 98+ residing in the province of Mantova (Northern Italy) at the 1st April 1998. The present study aims at analyzing the impact of selected clinical and socio-demographic variables on further survival of the 77 participants in the MALVA study.
Adopting methods for multiple imputation of missing value, four distinct Cox regres-sion models were estimated using groups of predefined variables describing socio-demographic characteristics, functional status, nutritional status, cardiovascular risk fac-tors. Each model was adjusted for the effects of gender and age. Finally two complete models have been considered: the first one including the statistically significant variables in the previous analysis, and the second one obtained with a backward selection proce-dure. The variables included in the final models can be seen as markers of “frailty” or cor-related conditions. Most of these variables maintained a significant influence on survival, however belonging to the “underweight” BMI category and being institutionalized emerged as the best “frailty” indicators in the centenarians from the province of Mantova. The results of this study are in agreement with several previous studies in recognizing that factors predicting mortality in centenarians are not the same well-known predictors of mortality in the middle-aged and younger elderly.